The Study In Brief
Recent high inflation shows starkly that the Canadian economy’s ability to produce goods and services is not keeping up with surging nominal spending. One key suspect in the economy’s disappointing ability to produce is a declining stock of business capital per available worker – that is, member of the labour force. Business investment in Canada has been weak since 2015 – both in areas of traditional strength, such as non-residential and engineering structures, and in areas we look to for innovation and future productivity: machinery and equipment (M&E) and intellectual property products (IPP).
Comparing investment in Canada to that in the United States and other OECD countries reveals that, before 2015, Canadian businesses had been closing a long-standing gap between investment per available worker in Canada and abroad. Since 2015, however the gap has become a chasm. Business investment and productivity are closely related: productivity growth inspires investment by creating opportunities, and investment drives productivity growth by equipping workers with more and better tools. Having investment per worker much lower in Canada than abroad tells us that businesses see less opportunity in Canada, and prefigures weaker growth in Canadian earnings and living standards than in other OECD countries.
Recent economic policies in Canada have hurt business investment in several ways. Governments’ own consumption of goods and services (including compensation of employees) and transfers to households raised the share of consumption and housing in GDP to unprecedented levels, reducing the resources available for nonresidential investment. Concerns about unsustainable debt and rising taxes undermine confidence. Regulations currently in place, together with expansive but uncertain plans for more – notably affecting energy production and use – make Canada less attractive to investment than it could be. Changes of direction, particularly at the federal level, are needed for Canadian workers to get more of the tools they need to thrive and compete.
Introduction
Recent inflation numbers give Canadians stark evidence that something is wrong with their economy. Expansionary monetary policy, deficit-financed governments, and rebounding household spending as the COVID pandemic ebbed have spurred a surge of consumption.
Current-dollar GDP is approaching its historic growth rate in expansions. But real output has responded far less. Figure 1, which shows two-year growth rates of four-quarter averages (to smooth out volatility), highlights the contrast. Nominal spending, the blue line, has been growing at a rate similar to past periods of expansion since the early 1990s. By contrast, real activity, the orange line, is still in negative territory.
Prices are rising rapidly. Real incomes are not. Among the likely reasons for this disappointing performance, one highlighted by the Bank of Canada itself, is weak business investment and a consequent slow growth in Canada’s productive capacity.
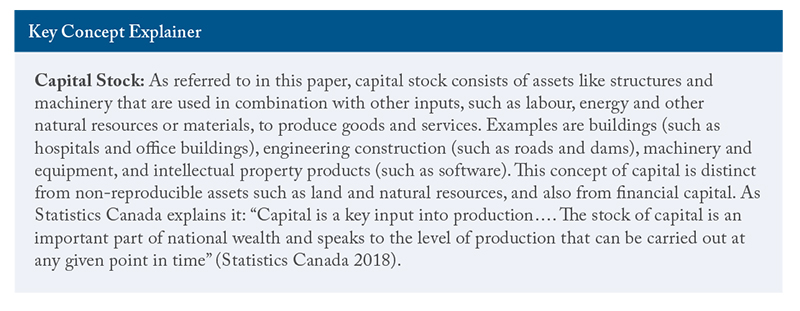
Weak business investment is not just a short-term concern. A country’s stock of non-residential buildings, engineering infrastructure, machinery and equipment (M&E), and intellectual-property products (IPP) is critical to its ability to generate output and incomes (see Key Concept Explainer). But Canada’s capital stock is barely growing, and not keeping pace with its workforce.
New business investment per worker is declining. Not only have areas of traditional strength in Canadian business investment – non-residential and engineering structures – fallen in recent years, but the categories most associated with innovation and future productivity – M&E and IPP – are weaker yet.
High or low levels of capital and productivity tend to go together.
Whatever is depressing business investment in Canada seems unusually severe. The United States and other countries in the Organisation for Economic Co-operation and Development (OECD) are investing at higher rates. Business investment per available Canadian worker was approaching comparable US and OECD measures from the early 2000s to the mid-2010s. But it sagged after mid-decade and plummeted during the pandemic.
To the extent that Canada’s weak performance reflects perceptions of limited opportunities or little need for higher investment by business leaders, public policy can and should help. First and foremost it can do so by addressing policies that are hurting investment. Government consumption and transfers are crowding out private saving and non-residential investment. Concerns about unsustainable debt and rising taxes undermine confidence. Regulations currently in place, and expansive but uncertain plans for more – notably affecting energy production and use – are making Canada appear hostile to private investment. Canada’s workers need changes of direction, particularly at the federal level, to get more of the tools they need to thrive and compete.
The Numbers
The capital they use on the job is critical to workers’ ability to produce goods and services, earn incomes and compete internationally. Human capital and natural capital like land and water are intuitively important, but we do not yet have good measures of either and very little that we can compare internationally. Capital created and owned by governments also matters, but the services it yields are harder to relate to production and income, and also hard to compare internationally.
We do have relatively robust measures of built capital in the business sector: non-residential buildings and engineering structures, M&E, and IPP. These complement human and natural capital, and government infrastructure, in producing goods and services and generating incomes. For a snapshot of the correlations between capital stock on one hand and incomes and output on the other, consider Figure 2, which compares 2022 OECD estimates for both, divided by the labour force in each country.
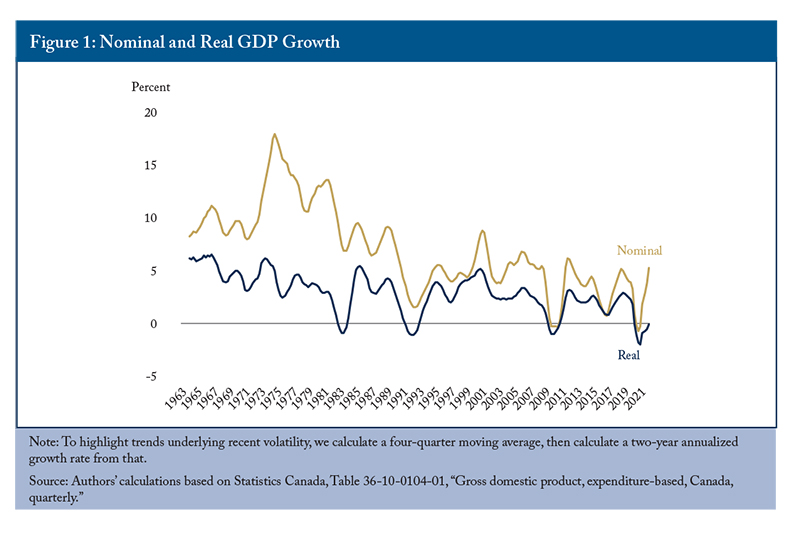
Figure 2 shows the link between per-worker measures of productive capital stock and output for Canada and other OECD countries with comparable data. The stock of productive capital consists of physical assets like structures and machinery to be used as an input in production. To get this measure, the cumulative sum of past investment volumes are adjusted for age and efficiency loss – that is an older asset is likely less productive than a newer one due to wear and tear. A high stock of productive capital means that the capital stock is more efficient – a better complement to labour inputs – and embodies more recent technology. It is not a surprise that Figure 2 shows that countries with high productive capital stocks also have high levels of output.
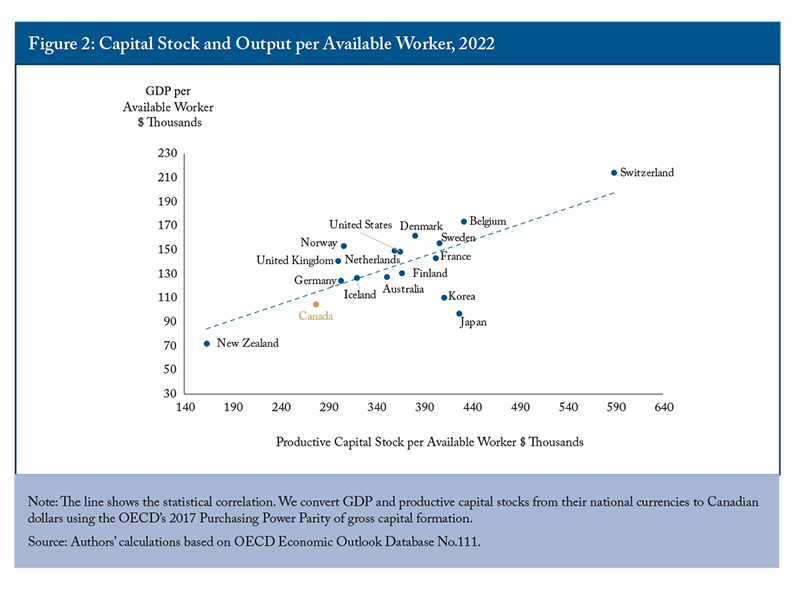
Figure 2 highlights per-worker measures – labour productivity rather than total, or multifactor, productivity – and capital stock rather than output per unit of capital and labour considered together.
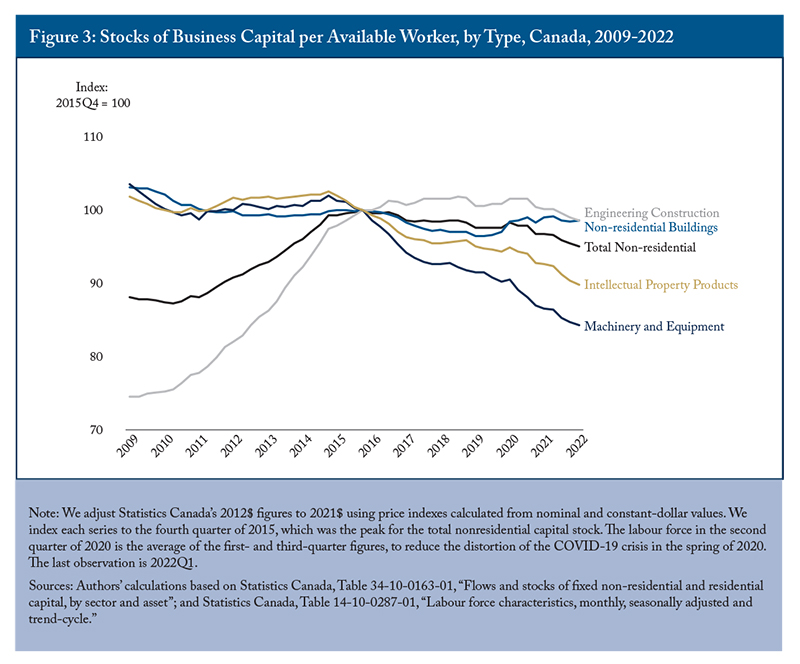
Figure 3 which shows real stocks of each type of capital per member of Canada’s labour force. The fact that capital formation is both a result of productivity growth and a driver of it makes recent trends in those stocks troubling.
The stock of non-residential capital relative to the labour force peaked in the last quarter of 2015. By the first quarter of 2022, every type of capital was below that peak. Only engineering construction did not begin to decline shortly after 2015. It continued to grow through 2021, and its stock per available worker was down a comparatively small 1 percent by the first quarter of 2022. The stock of non-residential buildings per available worker fell between 2015 and 2020 before growing in 2021. The stocks of IPP and M&E per worker have been falling quite steadily since 2014.
The declines in the stock of M&E and IPP per member of the workforce are particularly worrisome. Past research has identified M&E investment as particularly important for productivity growth (Sala-i-Martin 2001, Rao et al. 2003, Stewart and Atkinson 2013). IPP investment is a plausible indicator of Canada’s likely future performance in a world where intangible capital is increasingly important (Marple 2021 and Bafale and Robson 2022).
We would like to compare Canada’s capital-stock numbers over longer periods and against comparable numbers abroad. These particular numbers, however, exist in Canada only since 2009, and are not available for many other countries. Comparisons over longer periods and with other countries are easier using a related flow measure: gross business investment. Figure 4 shows the Canadian numbers for the three types of this investment tracked by Statistics Canada and most other national statistical agencies: non-residential structures (both buildings and engineering), M&E and IP products since 1990.
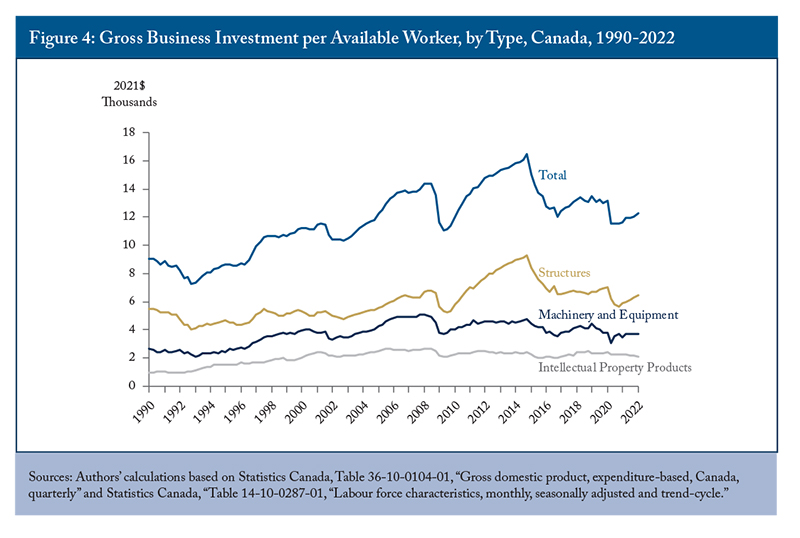
Absent any changes in estimated depreciation and write-offs for existing capital, changes in gross investment should line up with inflections in net capital stock. As the net stock figures would lead us to expect, the gross investment figures show relative strength in non-residential structures before mid-decade along with weaker performance in M&E and IPP.
During the second part of the 2010s, investment in structures and M&E per member of the workforce declined, and investment in IPP flat-lined. In 2021, notwithstanding a modest rise in non-residential structures and M&E investment from quarter to quarter – a rise sadly not evident in IPP – the starting point for the year was so low that per-available-worker investment in 2021 dollars in Canada was only about $11,900. That is down one quarter from its peak of $16,000 in 2014 and barely above the 2009 trough of $11,300, during the post-financial-crisis recession.
Canada’s Performance against Competitors Abroad
The growing importance of intangible assets, and the declining materials intensity of economic activity generally, might mean that the warning signals from weak standard measures of capital formation are less alarming than they would have been in the past. These trends affect many countries, so we look now to see how Canada’s experience compares with that of the United States and other OECD countries with comparable data (those shown in Figure 2). Is capital investment trending similarly elsewhere, or does Canada appear to be on a path toward relatively higher capital intensity, implying relatively higher productivity and wages, or toward relatively lower capital intensity, implying relatively lower productivity and wages?
Canada versus the United States
Because Canada and the United States collect similar capital investment data, and because Statistics Canada takes particular care to compare Canadian to US prices, we can measure investment per available worker in the two countries with some confidence that we are getting meaningful numbers.
We convert the different types of capital investment into Canadian dollars using Statistics Canada’s measures of relative capital-equipment price levels to adjust for different purchasing power differences in the two countries.
Canada has an edge in investment in structures (panel A). Canadian businesses, with their relatively greater focus on natural resources, tend to invest more per worker in this area. The gap narrowed sharply after 2014, with lower oil prices and a policy environment in Canada more hostile to natural resource industries. However, it widened somewhat in 2021, with the rebound in Canadian’s non-residential structures in 2021 coinciding with a slackening of pace in the United States.
The comparison in M&E investment (panel B) is much less favourable to Canada. While the measure is at an all-time high in the US, investment has been flat in Canada since 2009. US businesses typically spend more per available worker on such investment, and the gap has widened over the past decade. The gap in 2021 was $6,300.
The IPP gap (panel C) is worse yet. Since the mid-2000s, Canadian businesses’ spending on these products has been in a narrow range around $2,000 per available worker, while the US figure has risen from around $3,000 to more than $8,000. Some of this difference reflects slumping exploration expenditures by Canada’s struggling resource sector. To the extent this growing gap reflects greater use by Canadian businesses of information technology owned abroad, its implications for productivity are ambiguous. Reliance on foreign-owned technology might be simply a smart business decision, or it might reflect Canada’s lack of competitiveness in commercializing its own IP, leading to lower accumulation of IPP by Canadian firms.
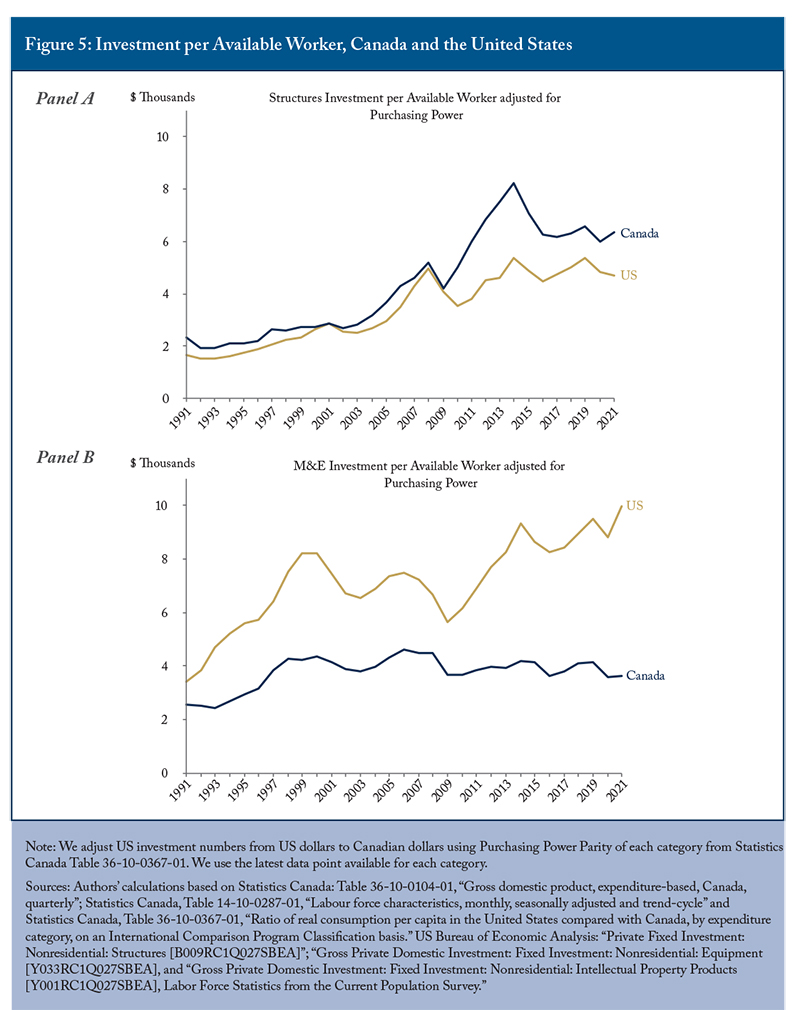
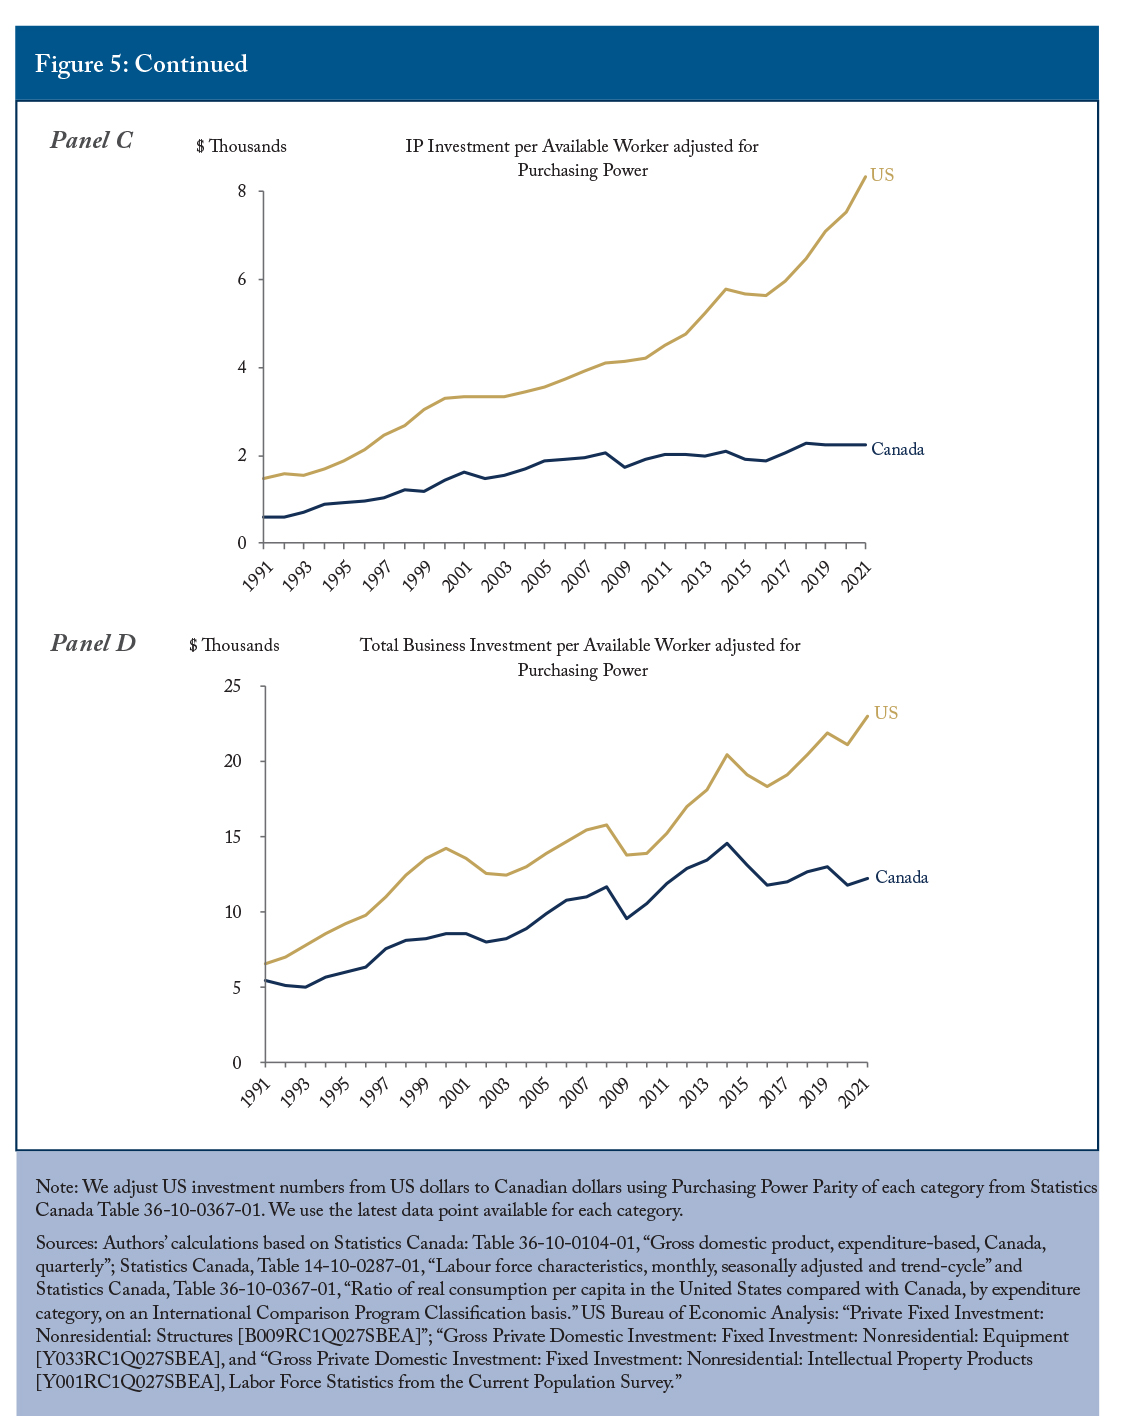
Looking at the three types of investment together (panel D), we see that business investment per available US worker has exceeded that in Canada since the 1990s. The gap narrowed in the 2000s but widened markedly after the mid-2010s and has widened further during the pandemic. The US recovery from the pandemic has been better than the Canadian recovery: in 2021, business investment per available worker rose 9 percent in the United States versus only 3 percent in Canada.
The gap between gross investment per available worker in the United States and in Canada was almost $11,000 in 2021. Such a large amount represents a significant shortening of the replacement and upgrade cycle for a piece of capital equipment such as a truck or an excavator, a major upgrade of health and safety in a workplace, or a complete replacement of many office workers’ entire information and communications technology.
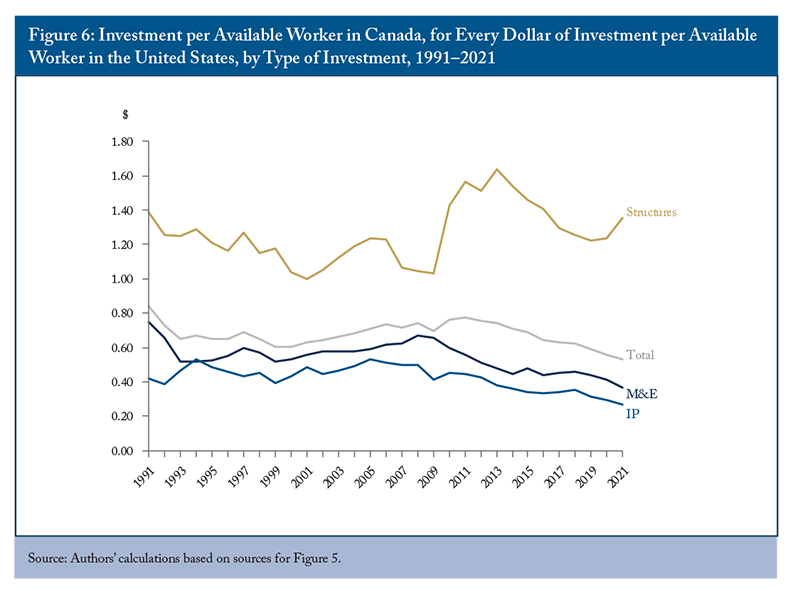
Asking how many cents of new investment per available Canadian worker occurs for every dollar of new investment per available US worker yields a summary comparative measure. In Figure 6, we show our measure of investment in Canada per dollar of its US equivalent in total and in each investment category.
Canada’s relatively robust rate of structures investment stands out in Figure 6. The surge to the 2013 peak – when each available Canadian worker was getting more than $1.60 for every dollar of new structures enjoyed by her or his US counterpart – is striking. So is the subsequent decline to less than $1.25 in 2019. In this category, at least, the 2020 and 2021 comparisons are positive for Canada, with the average member of the Canadian workforce receiving $1.35 of new capital for every dollar received by the average member of the US workforce in 2021.
Not so in M&E. After improving from fewer than 60 cents around the turn of the century to close to 70 cents around the time of the 2008–2009 financial crisis and slump, the amount of M&E investment per member of the Canadian workforce per dollar per member of the US workforce dropped to a dismal 37 cents in 2021.
The situation with IP products is even worse. A steadily declining trend since the mid-2000s has taken us to the point where the average member of the Canadian workforce in 2021 enjoyed only 27 cents of new investment in IP products for every dollar enjoyed by the average member of the US workforce.
Add the three types of capital together, and new investment per available worker in Canada, adjusted for purchasing power, was only slightly above 50 cents for every dollar of investment per available US worker in 2021. That is lower than at any point since the beginning of the 1990s. Many observers identify investment in M&E and IP products as creating spillovers that may be particularly important for productivity and economic growth, which would make the composition of Canadian investment even more troubling.
Canada versus the OECD
Although the United States, as Canada’s closest trading partner and competitor, is a natural comparator, it has a unique industrial structure and economic cycles. A wider comparison offers more perspective on Canada’s situation. We now extend our view to other OECD countries, and take advantage of OECD projections to say something about how Canada appears likely to fare comparatively in 2022.
This broader and more forward-looking view comes with caveats. Not all OECD countries break down business investment by type as Canada and the United States do, and not all measure IP products the same way. So we use aggregate investment with less confidence that we are comparing like with like. We also do not have current measures of relative prices for different types of investment. So we resort to a less precise bang-per-buck adjustment: purchasing-power-adjusted exchange rates benchmarked to relative prices of investment goods in 2017.
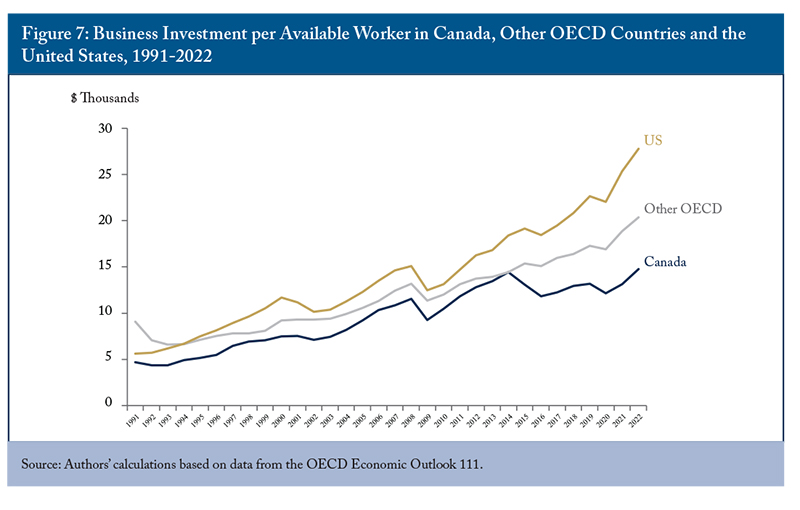
For consistency, we use the same OECD measures for the United States as well, which means that the per-available-worker numbers in Canadian dollars are not identical to those in our Canada-US comparison. But the big picture – notably, the story of Canadian underperformance – is consistent (Figure 7).
Investment per available worker in the other OECD countries with comparable data (see Figure 2) has typically been less robust than in the United States, but more robust than in Canada. The only exception to this tendency was in the early 2010s, when Canada’s resources sector was booming and many other advanced economies were still suffering from the lingering effects of the 2008-09 crisis and slump. At that point, the gap between investment per member of the labour force in Canada and the other OECD countries (excluding the United States) narrowed, and the two measures were essentially equal in 2014.
Since then, slumping investment in Canada and steady growth in the other OECD countries has caused the gap to grow wider than at any point since the early 1990s. Notwithstanding some improvement in Canada’s performance considered on its own, the OECD’s projections for 2022 yield a figure of $20,400 of new capital per available worker this year for the other OECD countries compared to $14,800 for Canada. In other words, the OECD’s projections for countries other than Canada and the United States indicate that new capital per available worker in Canada will be at least one-quarter less than in those countries this year and next.
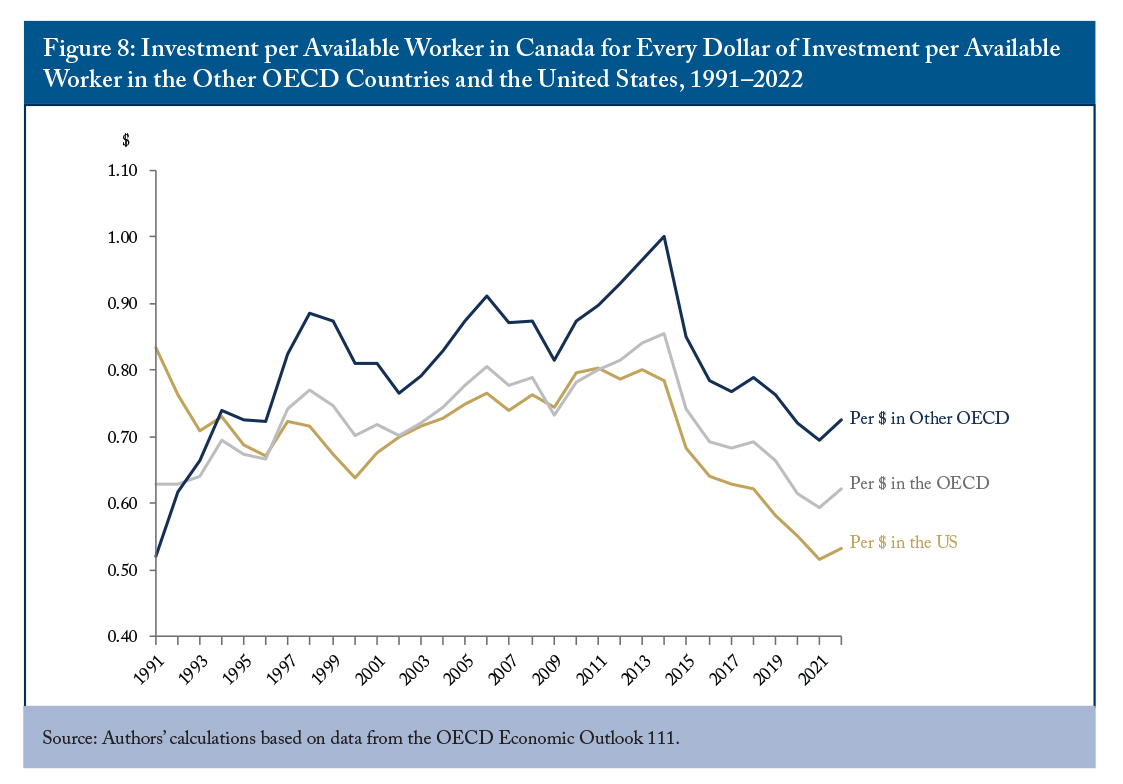
In Figure 8, we highlight Canada’s relative performance by showing Canadian investment per worker for each dollar invested elsewhere. The figure shows how much new capital each available worker in Canada enjoyed per dollar of new capital per available worker in the United States, the OECD as a whole and in the other OECD countries since 1991, along with the figures calculated from the OECD’s projections for 2021 and 2022.
As the previous numbers prefigured, a long-standing gap between investment rates in Canada and those abroad narrowed between the late 1990s and the mid-2000s. For every dollar of investment enjoyed by the average member of the labour force in the OECD as a whole, Canadian counterparts enjoyed about 75 cents in the early 2000s. Compared to other OECD countries excluding the United States, Canadian workers received 80 cents. By 2014, the average member of the Canadian labour force was enjoying some 81 cents of new investment per dollar invested per worker in the OECD as a whole, and the same amount as workers in the other OECD countries. In 2022, however, Canadian workers will likely enjoy only something like 62 cents of new capital for every dollar enjoyed by their counterparts in the OECD as a whole. The figure compared to workers in the other OECD countries is 73 cents. The figure compared to workers in the United States is a dismal 53 cents.
Higher investment is not a goal in its own right. Spurring investment in uneconomic assets – such as intermittent electricity generation lacking suitable storage or transmission (Trebilcock 2017), dairy farms that require prohibitive tariffs to survive (Schwanen 2018), or an inefficient new public agency to pursue vaccine self-sufficiency (Grootendorst et al. 2022) – with subsidies or regulation could raise capital spending but lower productivity and future incomes. Our concern about these numbers is their implication that Canadian businesses do not see opportunities and threats that would prompt them to undertake productivity-improving capital projects, or that they see opportunities and threats but do not respond to them. To that extent, these numbers presage trouble for Canadian workers. Countries with higher capital intensity tend to have higher productivity and higher wages. Countries with lower capital intensity tend to have lower productivity and lower wages. We want Canadian workers to have higher productivity and higher wages. Higher business investment would improve their chances.
Equipping Canadian Workers Better
Since 2015, Canada’s stock of capital per worker has been stagnant or declining and its rate of gross investment per worker has been weak. Other countries have not seen the same stagnation and weakness. The adverse contrast has deteriorated during the pandemic and its aftermath. Why might Canada be doing so badly, and what might we do about it?
Weakness in Natural Resource Industries
The fall in the price of oil in 2014 is clearly responsible for much of the weakness of business investment from 2015 until recently. The fossil fuel industry uses a lot of engineering capital, a substantial amount of machinery and equipment, and intellectual property products.
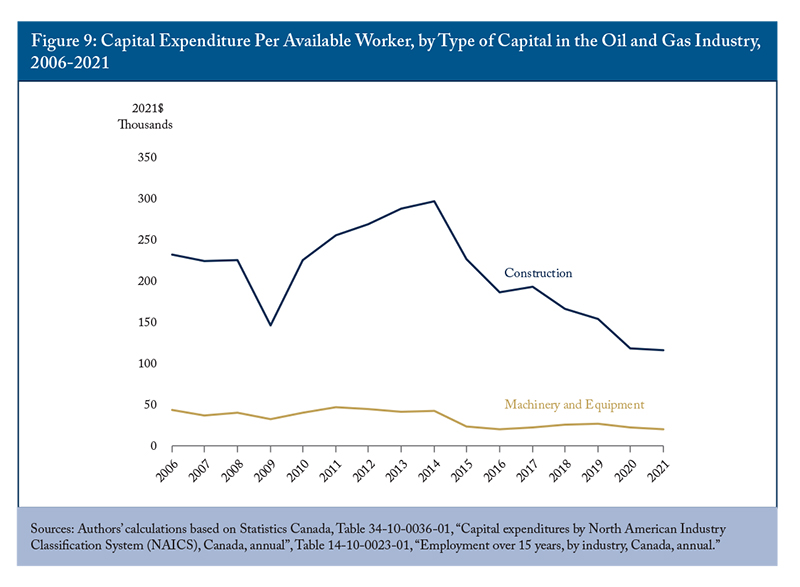
Measures of capital spending per available worker in the mining, quarrying, and oil and gas extraction industry reached their peak in 2014. By 2021, both types of available capital were well below that peak. From 2014 to 2021, investment in non-residential structures and machinery and equipment in the industry fell by 61 percent and 53 percent respectively (Figure 9).
The fact that recent strong prices for oil and natural gas have not produced a comparable rebound in capital spending likely reflects a hostile regulatory environment and skepticism among potential suppliers of capital. Investors, thinking that the world may transition quickly away from fossil fuels, or seeing the federal government prioritizing lower greenhouse gas emissions, would rather take industry profits in the form of dividends and share buy-backs than reinvest them in more production. The amount of new capital invested in oil and gas extraction per available worker in Canada for every dollar per available worker in the United States shows that the environment in Canada is worse than in at least one key competitor. Canadian oil and gas workers received almost as much investment per person as their US counterparts in 2016, shortly after the oil price collapse. By 2020, however, they received barely more than half as much (Robson and Wu 2021). A more realistic approach to oil and gas production and transportation by the federal government would spur investment – including investment in greenhouse-gas abatement – in a sector that will continue to be vital to Canada and the world for many years to come.
Crowding Out by Consumption and Residential Construction
A more subtle contributor to low business investment may be low national saving, with an outsize share of what saving is occurring flowing into residential investment rather than other forms of capital. Governments’ in-house spending and transfers to households have promoted flows of resources into consumption and housing rather than non-residential investment. Consumption and residential investment together have exceeded 85 percent of GDP for an unprecedented seven years (Figure 10).
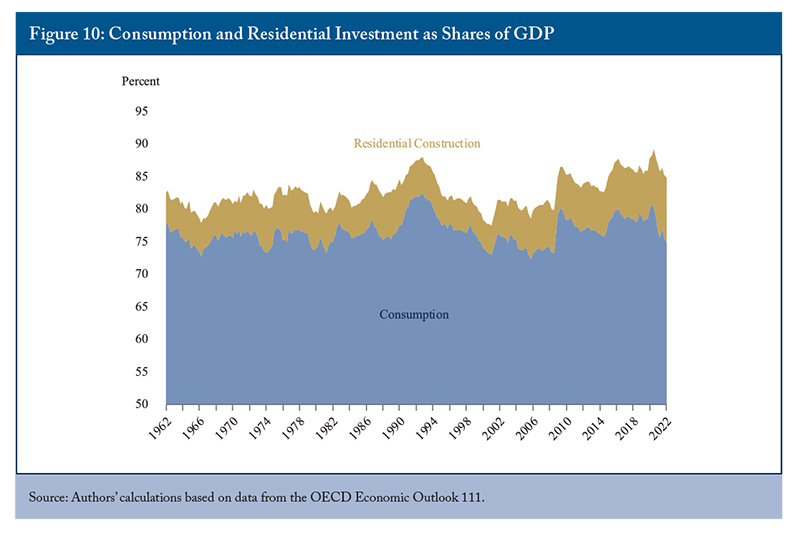
Higher interest rates will damp residential construction – and, over time, should lead governments to borrow less for consumption. Shrinking the proportion of residential mortgages backed by the federal government through the Canada Mortgage and Housing Corporation would also help reduce the incentive financial institutions have to lend against housing as opposed to business capital, as would introducing risk-based premiums for residential mortgage insurance, to discourage lending to less credit-worthy households (Kronick and Omran 2021).
Restricted Access to Finance for Small and Mid-Size Firms
Potential financers of investment in Canada also appear recently to have favoured larger over smaller firms. In 2018, the share of total outstanding loans in Canada extended to small and medium-size enterprises (SMEs) hit its lowest level since 2000. The spread between interest rates on bank loans to SMEs and larger firms is higher in Canada than almost any other OECD country. Options to improve SMEs’ access to capital include exempting from taxation capital gains realized on the sale of certain small business shares and deepening Canada’s capital markets beyond domestic bank debt financing (Schwanen, Kronick, and Omran 2019).
Uncompetitive Corporate Income Taxes
A likely suspect in Canada’s flagging relative investment performance is that Canada has lost its competitive edge in business taxation, notably against the United States (Bazel and Mintz 2017; McKenzie and Smart 2019). Newly proposed rules to limit the amount of interest costs deductible by large firms would exacerbate this problem. A lower corporate income tax rate would help on this front: the C.D. Howe Institute’s 2022 Shadow Federal Budget advocated lowering the standard corporate income tax rate from 15 percent to 13 percent, starting in 2025 (Drummond, Laurin and Robson 2022).
A more immediate spur to investment would be a temporary general investment tax credit, applying to all investments in depreciable assets, including intangibles. A temporary credit would encourage early investment, and although an investment tax credit is not neutral across all types of capital, it is more neutral than the subsidies that governments lately seem to favour (Drummond, Laurin and Robson 2022).
An Uncongenial Environment for Intellectual Property Investment
Canada supports research and development relatively generously, and generates a lot of intellectual property. Yet Canada lags in commercializing intellectual property products – while it is a major net exporter of IP-related services, it is a major net payer of IP royalties (Schwanen 2021). One way of spurring investment in intellectual property products in Canada would be to establish an “IP Box” tax regime, with a lower corporate tax rate on income from patents and other intellectual property generated in Canada (Pantaleo, Poschmann, and Wilkie 2013; Parsons 2011; Lester 2022).
Regulatory Uncertainty
Although the increasing scope and complexity of regulation is a concern for businesses everywhere, it is reasonable to wonder if the current environment in Canada is particularly discouraging for potential investment. Governments, including the federal government, have processes for evaluating regulatory changes that, in principle, involve calculations of benefits and costs on the basis of transparent modeling. The federal government’s recent move to ban certain types of single-use plastics appears not to have taken the relevant calculations of benefits and costs into account (Green 2022), and has packagers of food and other items wondering what measures might come next (Rubin 2022). More sensitivity to the economic impact of regulations, and the need for predictable processes, if not outcomes, would improve the environment for business investment in Canada.
Policy uncertainty has an important role to play in determining capital investment, as uncertainty about future policy and regulatory outcomes can depress investment (Gulen and Ion 2016). Baker et al. (2016) constructed a policy uncertainty index for Canada and a number of major economies. This index shows that policy uncertainty in Canada soared to record levels in 2019. It has subsided since a further spike during the pandemic, but in early 2022 was still more than double its average level between the mid-1990s and the mid-2010s. As we noted already, uncertainty over regulation in the energy sector is particularly important. The recent survey of business by the Bank of Canada reveals that some energy producers are uncertain about demand for hydrocarbon resources over the long life cycle of projects due to the energy transition.
Unpredictable Fiscal Policy
The 2022 federal budget highlighted the threat of stagnating living standards as a result of low business investment. The budget cited a long-term OECD projection in which growth of potential GDP per person in Canada was lower than in any other OECD country during the 2020-2060 period: “Most Canadian businesses have not invested at the same rate as their U.S. counterparts. Unless this changes, the OECD projects that Canada will have the lowest per-capita GDP growth among its member countries” (Canada 2022). Yet the budget’s measures leaned toward more transfer payments and direct federal consumption spending. Measures in areas such as supply-chain infrastructure were modest, and too many initiatives intended to spur business investment took the form of subsidies – which, given the likelihood of a much more constrained fiscal environment in the near future, may not last long enough to tip the scale on a 30-year capital project. On the tax side, the budget featured discriminatory taxes on financial services firms and on high-end automobiles, aircraft and boats – completely inconsistent with a predictable, investment-friendly approach.
Conclusion
After improving against international competitors during the 2000s and in the early 2010s, business investment per available worker in Canada slipped badly after 2014, and has been conspicuously weak during and after the pandemic. This weakness is both a likely effect of weak productivity growth in the present and a harbinger of weak productivity growth in the future. The mutually reinforcing nature of productivity and investment means that Canada’s low investment rates are both a symptom of lower productivity than we should aspire to and signs that future productivity will be lower than we want.
The prospect that Canadians will find themselves increasingly relegated to lower value-added activities relative to workers in the United States and elsewhere, who are raising their productivity and earnings faster, should spur Canadian policymakers to action. The first step is to recognize that recent trends are a symptom of threats to Canada’s prosperity and competitiveness – that low business investment is a problem that governments can and should address.
References
Alvarez, Jorge, Ivo Krznar, and Trevor Tombe. 2019. “Internal Trade in Canada: Case for Liberalization.” IMF Working Papers 19/158. Washington, DC: International Monetary Fund. July 22.
Bafale, Mawakina, and Robson, William B.P. 2022. “Canadian Investment in Intellectual Property Products is Too Low.” Intelligence Memo. Toronto: C.D. Howe Institute. May.
Baker, Scott, Nicholas Bloom, and Steven Davis. 2022. “Economic Policy Uncertainty: Canada Monthly Index.” https://www.policyuncertainty.com/canada_monthly.html
Dachis, Benjamin. 2018. Death by a Thousand Cuts? Western Canada’s Oil and Natural Gas Policy Competitiveness Scorecard. Commentary 501. Toronto: C.D. Howe Institute. February.
Dachis, Benjamin, and John Lester. 2015. Small Business Preferences as a Barrier to Growth: Not so Tall After All. Commentary 426. Toronto: C.D. Howe Institute. May.
Department of Finance Canada. 2022. “Budget 2022.” Retrieved from the Budget 2022 website: https://budget.gc.ca/2022/report-rapport/toc-tdm-en.html
Drummond, Donald, and Alexandre Laurin. 2021. “Rolling the Dice on Canada’s Fiscal Future.” E-Brief. Toronto: C.D. Howe Institute. July.
Found, Adam, and Peter Tomlinson. 2017. “Business Tax Burdens in Canada’s Major Cities: The 2017 Report Card.” E-Brief. Toronto: C.D. Howe Institute. December.
Green, Kenneth. 2022. “Canada’s Wasteful Plan to Regulate Plastic Waste.” Vancouver: The Fraser Institute.
Grootendorst, Paul, Javad Moradpour, Michael Schunk, and Robert Van Exan. 2022. Home Remedies: How Should Canada Acquire Vaccines for the Next Pandemic? Commentary 622. Toronto: C.D. Howe Institute. May.
Gulen, Huseyin, and Mihai Ion. 2016, “Policy Uncertainty and Corporate Investment.” Review of Financial Studies 29: 523–564.
Kronick, Jeremy, and Farah Omran. 2019. Productivity and the Financial Services Sector – How to Achieve New Heights. Commentary 555. Toronto: C.D. Howe Institute. October.
________. 2021. “Upping our Game: How Canada’s Financial Sector Can Spur Economic Performance.” E-Brief. Toronto: C.D. Howe Institute. May.
Lortie, Pierre. 2019. Entrepreneurial Finance and Economic Growth: A Canadian Overview. Commentary 536. Toronto: C.D. Howe Institute. February.
McKenzie, Kenneth, and Michael Smart. 2019. Tax Policy Next to the Elephant: Business Tax Reform in the Wake of the US Tax Cuts and Jobs Act. Commentary 537. Toronto: C.D. Howe Institute. March.
Marple, James. 2021. “Meeting Canada’s Innovation Challenge through Targeted Investment and Competition.” TD Economics. July.
Organisation for Economic Co-Operation and Development. 2021. “2017 PPP Benchmark Results.” Retrieved from: https://stats.oecd.org/Index.aspx?DataSetCode=PPP2017#
Powell, David. 2020. Filling the Gap: Emergency Funding Programs and Asset-Based Finance in Times of Economic Crisis. Commentary 569. Toronto: C.D. Howe Institute. March.
Rao, Someshwar, Jianmin Tang, and Weimin Wang. 2003. “Canada’s Recent Productivity Record and Capital Accumulation.” International Productivity Monitor. Centre for the Study of Living Standards. 7: 24-38. Fall.
Robson, William B.P., and Miles Wu. 2021. “From Chronic to Acute: Canada’s Investment Crisis.” E-Brief. Toronto: C.D. Howe Institute. February.
Rubin, Josh. 2022. “Grocers worry about which plastics Ottawa will ban next – and say prices could go up,” Toronto Star, June 22.
Sala-i-Martin, Xavier. 2001. “15 Years of New Growth Economics: What Have We Learnt?” Speech, Fifth Annual Conference of the Central Bank of Chile. November.
Schwanen, Daniel. 2018. “NAFTA: The Case for More Competition in the Dairy Market.” Intelligence Memo. Toronto: C.D. Howe Institute. September.
________. 2021. “Canada’s Commercialization Deficit.” Intelligence Memo. Toronto: C.D. Howe Institute. December.
Schwanen, Daniel, Jeremy Kronick, and Farah Omran. 2019. “Growth Surge: How Private Equity Can Scale Up Firms and the Economy.” E-Brief. Toronto: C.D. Howe Institute. May.
Statistics Canada. 2016. “User Guide: Canadian System of Macroeconomic Accounts. Chapter 5 Income and expenditure accounts.” Catalog No. 13-606-G. August.
Statistics Canada. 2018. “Canadian System of Macroeconomic Accounts, Investment and Capital Stock Statistics” www150.statcan.gc.ca/n1/pub/13-607-x/2016001/43-eng.htm.
Stewart, Luke A., and Robert D. Atkinson. 2013. “Restoring America’s Lagging Investment in Capital Goods.” The Information Technology & Innovation Foundation. October.
Trebilcock, Michael, 2017. “Ontario’s Green Energy Experience: Sobering Lessons for Sustainable Climate Change Policies.” E-Brief. Toronto: C.D. Howe Institute.


