Graph of the Week is a new series from the C.D. Howe Institute's Graphic Intelligence that presents valuable and easily digestible data. Each Monday we unveil one new captivating chart or graph with interesting insights, explaining it in two-to-three sentences. Dive into the data with us.
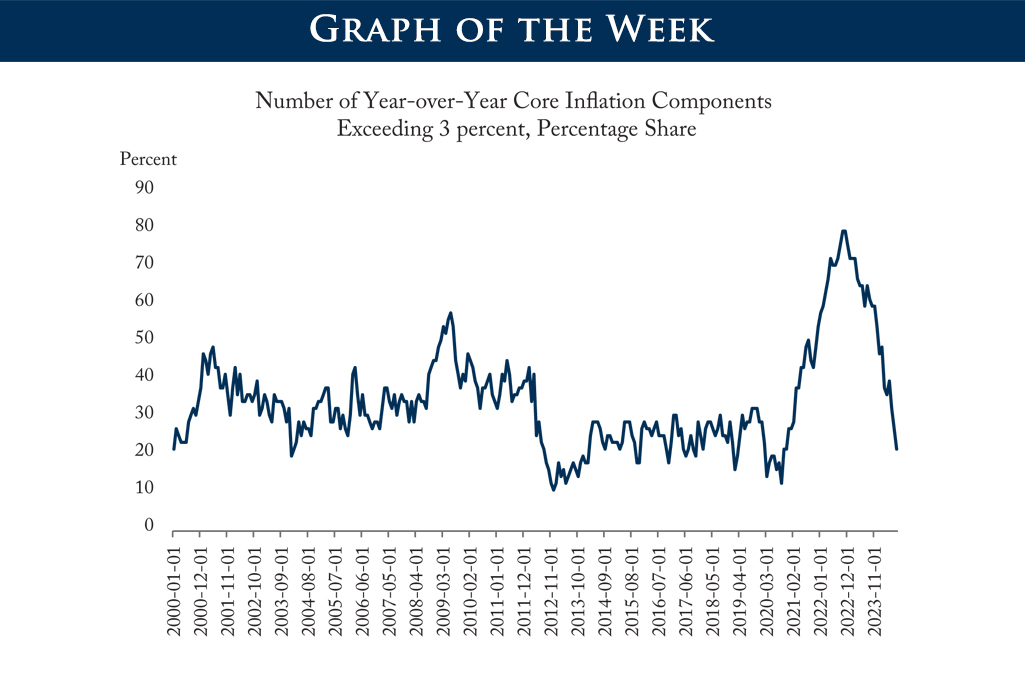
Headline inflation came in right at the 2 percent target last week, with the Bank of Canada's preferred core inflation measures - CPI-Trim and CPI-Median - falling to 2.4 and 2.3 percent, respectively. The share of the components that make up these core measures facing inflation above 3 percent, after peaking at 80 percent during the recent surge in inflation, is now at 22 percent, slightly below its average during the 2010s. A sign of the breadth of the softening inflation.

