Graph of the Week is a new series from the C.D. Howe Institute's Graphic Intelligence that presents valuable and easily digestible data. Each Monday we unveil one new captivating chart or graph with interesting insights, explaining it in two-to-three sentences. Dive into the data with us.
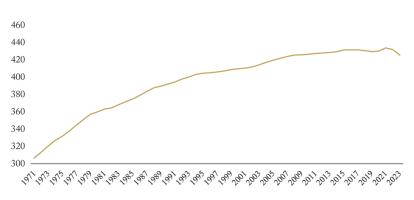
In the ensuing months after the Bank of Canada lowered the overnight rate to its effective lower bound in March 2020, house prices increased substantially. However, as the Bank engaged in a tightening campaign to deal with well above-target inflation, the likes of which we have not seen in the inflation-targeting era, house prices have not fallen by nearly the same degree.