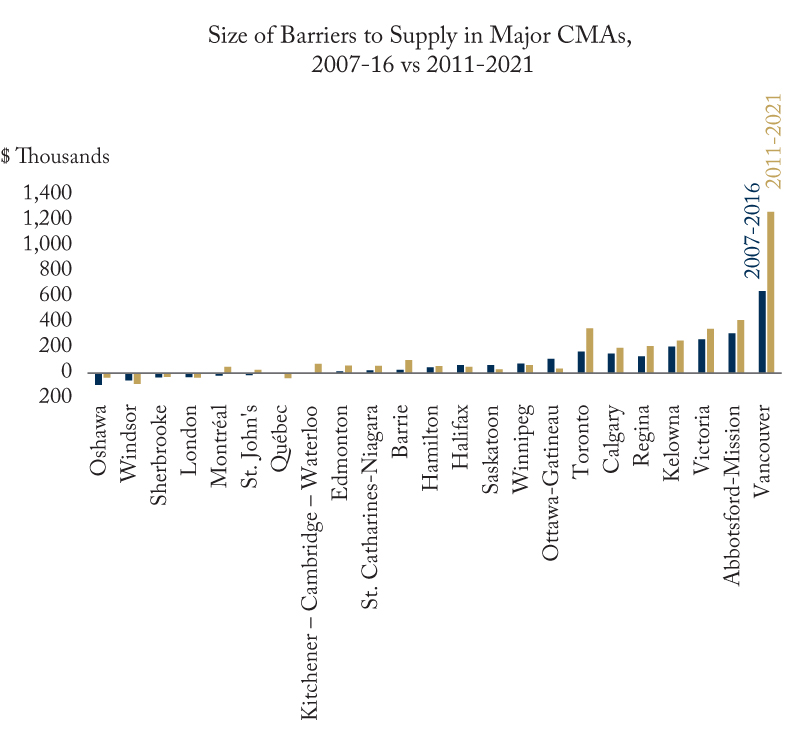
A widely-cited 2018 C.D. Howe Institute study of major Canadian Census Metropolitan Areas (CMAs) for the 2007–16 period found that the barriers to constructing new single-detached homes – including government regulations and other market dysfunctions – added upwards of $644,000 in Vancouver, for example.
This Graphic Intelligence compares those figures with similar data for the period from 2011 through to the end of 2021 as published in our recent study (see graph 1). The results over this decade-long period show that barriers to supply are still costly, and now a much larger amount in some CMAs. Over the 2011-2021 period, the market price of a single-detached home in Vancouver was nearly $1.3 million more than the cost to build. This estimate of supply barriers is so much higher now because supply barriers began to bind more significantly in 2015. It was in that year, near the end of the previous study period, that demand began to majorly outstrip supply. The market price of homes in the Toronto CMA is now $350,000 more than the cost to build. These two CMAs saw the largest total increase in the cost of homes attributable to supply barriers.
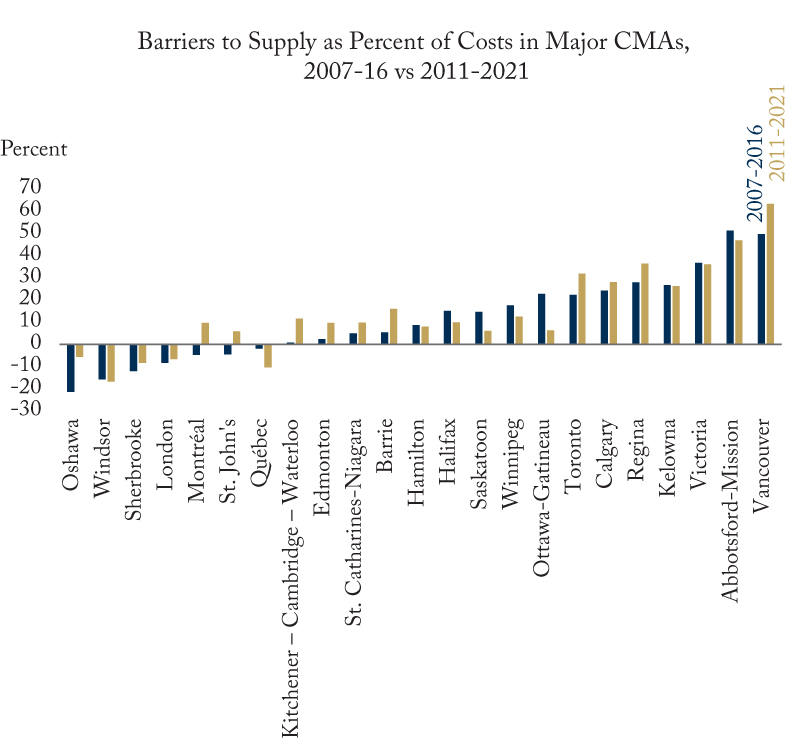
The gap between market price and the cost of construction is one way to look at the cost of supply barriers. The other way is to divide the gap by the market price (graph 2). This produces the share of the market price due to supply barriers. A comparison of the percentage gaps between the 2018 study and this year’s study allows us to ask if barriers in a city are getting relatively worse. Both market prices and construction costs have gone up in these markets. But if construction costs have grown more than market prices, barriers to construction will matter relatively less as a percentage of the overall market price. Indeed, this was the case in places like Abbotsford, Kelowna and Victoria. This indicates that in these areas, supply barriers have not gotten relatively worse between these periods.

