From: David Johnson
To: Ontarians concerned about class sizes
Date: February 27, 2020
Re: Time travelling in the Ontario elementary school system
How much has instructional staffing changed in the Ontario elementary public school system? Time travel, a staple of books and film, provides insight.
Ontario’s elementary students are taught by two categories of teachers: full-time teachers (FT); and long-term occasional teachers (LTOs).
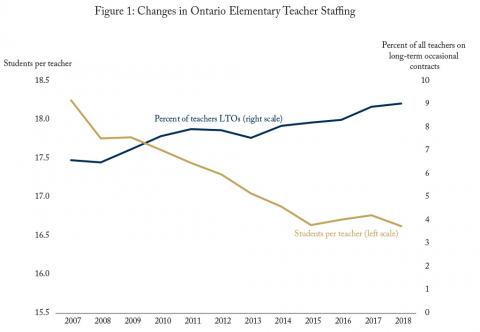
The percentage of LTOs in the teaching staff rose from 6 percent in 2006-07 to 9 percent in 2017-18, according to consistent Ministry of Education data on the number of teachers in Ontario elementary schools (data for 2018-19 are not yet available). It is very important to include LTO’s in the count of teachers as the percentage of teachers with LTO contracts has increased substantially.
Figure 1 shows a substantial increase in total teaching resources per student at Ontario elementary schools over this period. Virtually all of the increases took place before the 2014-15 academic year. The number of students per teacher declines from 18.25 in 2006-07 to 16.88 per teacher in 2013-14, a large increase in resources per student. There were 16.62 students per teacher in 2017-18. Complicating the analysis is the rolling out of full-day kindergarten that added classes usually staffed with one teacher and one early childhood education (ECE) worker. ECE workers are first recorded in school complements in 2010-11. Full day kindergarten was fully in the system in the 2014-15 year. However, in the standard full day kindergarten model of one teacher, one ECE, and 30 students, the roll out of full day kindergarten would actually increase the number of students per teacher if non-kindergarten classes were typically less than 30.
In the current arguments about proposed reductions in elementary teachers across the province, forecast reductions of teachers fall into a range depending on the source quoted. A Ministry memo forecast total reductions, elementary and secondary, of 1,558 teachers in one year and 3,475 in five years. The Financial Accountability Office of Ontario forecasted a one-year reductions of 967 elementary teachers and a similar number in five years. How can a possible reduction in elementary teaching staff be better understood?
A little time travelling provides food for thought. A reduction of 1000 elementary teachers from the 2017-18 complement would return to the system to the level of teaching resources in 2013-14.
Was the Ontario public education system a disaster in 2013-14? If your answer is no, then some of the language around possible reductions in teaching staff should be tempered with some realism about what a reduced number of teachers actually means for the elementary school system in Ontario.
David Johnson is professor of economics at Wilfrid Laurier University and a C.D. Howe Institute Research Fellow.
To send a comment or leave feedback, email us at blog@cdhowe.org.
The views expressed here are those of the author. The C.D. Howe Institute does not take corporate positions on policy matters.


