The Study In Brief
Governments around the world rely on the predictions of global energy agencies to inform their own domestic energy policies and regulations. The most notable agencies include the International Energy Agency (IEA), the Organization for Petroleum Exporting Countries (OPEC), and the US Energy Information Administration (EIA).
This paper explores the role of forecasts and scenarios in federal energy policymaking, identifies key limitations, and offers policy recommendations for strengthening their development and use by the Canadian Energy Regulator (CER) and the federal government.
The federal government increasingly relies on the CER’s energy policy scenarios to shape its own energy emissions policies and regulations, to the point where it expressly tied the CER net zero scenario to its proposed oil and gas emissions regulation. While it makes sense to consider net zero scenarios, incorporating them into regulatory instruments is problematic.
The author recommends that:
-
the CER incorporate assumptions from a breadth of comparable global agencies in the development of all its scenarios, including its net zero scenarios, which currently rely overly heavily on the IEA;
-
the federal government enhance the independence of CER’s energy information function, by structuring it as an arm’s-length objective information sharing agency; and
-
rather than directing the work of the CER, the government should create its own publicly available energy scenarios that are used to inform energy policy discussions, but not as binding policy and regulatory instruments.
The author thanks Charles DeLand, Jeremy Kronick, Alexandre Laurin and anonymous reviewers for helpful comments on an earlier draft. The author retains responsibility for any errors and the views expressed.
Introduction
Energy systems are intricate and interwoven. Policymakers in Canada, and globally, strive to grasp the nuances of energy markets in order to keep energy secure, affordable, and reliable while also reducing emissions and driving economic growth. For net-importers of energy it is crucial to keep an eye on global supply and demand, understand where energy comes from, and monitor how much it costs. This knowledge helps inform smart decisions regarding energy purchases, and presages potential risks to energy supply. Meanwhile, net-exporters of energy consider the current and future need for different energy sources, and determine supply by shaping energy policies, budgets, and production plans.
Poor energy planning can have disastrous consequences for a country’s broader economy. Germany, in the aftermath of the Russian invasion of Ukraine, lost its main supply of natural gas, which had been central to its long-term energy policy and transition objectives. The country had been reducing its reliance on nuclear power and was transitioning off coalfired generation, shifting towards increased wind and solar capacity backstopped by natural gas. Germany’s coalfired electricity consumption has now increased by 35 percent since 2020, and its total coal emissions have correspondingly increased 22 percent (IEA 2024). Its electricity spot prices reached an all-time high in August 2022 and have increased by 332 percent since the beginning of 2024 (Trading Economics 2024). Germany was the worst-performing major developed economy in 2023 (IMF 2024), and its high energy costs and inability to advance new energy supply projects are risking the de-industrialization of its once dominant manufacturing base (McHugh 2023).
Governments around the world rely on the predictions of global energy agencies to inform their own domestic energy policies and regulations. The most notable of these include the International Energy Agency (IEA), the Organization for Petroleum Exporting Countries (OPEC), and the US Energy Information Administration (EIA). These agencies forecast reference or baseline cases of total energy demand and supply by source (e.g., oil, gas, renewables, coal, etc.), all informed by complex models that consider factors such as population, economy, efficiency, investment, technology deployment, and greenhouse gas (GHG) emissions.
Ideally, these forecasts are as objective as possible in their underlying assumptions so that they may be relied upon as an indication of future energy supply and demand for decision-making on government policy. However, the mandates and/or affiliations of these agencies can influence their modelling assumptions, which can lead to results that meet a particular goal or objective, rather than anticipate probable future outcomes.
Agencies will also produce scenarios, or conceptual exercises, developed to help governments and others understand the energy investment, consumption, and policy requirements needed to achieve a particular policy outcome, such as reducing emissions. The goal, in other words, is set in advance. Scenarios, by definition, are highly uncertain, and have a low probability of occurrence compared to forecasts.
Governments increasingly rely on scenarios to inform public policy, and this is problematic because policy scenarios are purely conceptual. Their use in directing macro-level energy investment policies risks creating country-level exposure to significant energy supply, affordability, and security disruptions, all while discounting the probability of success in achieving the scenario outcomes.
Ideally, forecasts and scenarios would be developed objectively and used as context to inform policy and regulatory decisions, rather than as policy or regulatory instruments in and of themselves.
This paper explores the role of forecasts and scenarios in federal energy policymaking, identifies key limitations, and offers policy recommendations for strengthening their development and use by the Canadian Energy Regulator and the federal government.
Forecasts Versus Scenarios
Energy forecasts seek to predict the future as accurately as possible. Just as budget forecasts assist governments in determining taxes and expenditures, and inflation forecasts inform monetary policy decisions, energy forecasts help governments understand market dynamics, anticipate supply and demand balances, and guide where and when new investments are needed.
Forecasting, at its core, involves anticipating features of the future. This often involves both forecasting future demand and anticipating future supply, to ensure that the necessary actions are taken to provide for sufficient and reliable resources under a short, medium, and long-term timeframe. (Vegh and Thomson 2021.)
Forecasts can play a significant role in shaping, guiding, and justifying investment decisions on multi-billion-dollar energy projects. Forecasts that are based on poor assumptions due to bias, poor modeling quality, or political motives can lead to under or over investment in energy infrastructure, which not only wastes public funds but also undermines the affordability, reliability, and security of a country’s energy systems.
Credible criticisms of government forecasts abound. Hendriks et al. (2017) estimate British Columbia’s Site C hydroelectric project cost ratepayers between $1.4 to $1.7 billion (17-20 percent) more than if an alternative portfolio of resources had been pursued, due to optimistic demand assumptions, cost overruns, and a decline in the cost of alternatives (including wind supported by combined cycle natural gas (CCGT)). Similarly, Goulding (2019) found that the carbon-adjusted levelized costs of Site C in BC, and the Keeyask hydroelectricity plant in Manitoba, exceeded those of CCGT.
Policy scenarios, on the other hand, contemplate hypothetical futures that deviate from what would be expected. They help decision-makers understand what would be required to achieve a desired outcome and are ideally developed relative to a “reference case” or “current policy baseline” forecast to understand the magnitude of change required relative to what would otherwise be anticipated.
Scenarios are, by definition, influenced by mandate or selection bias, in which a government or agency has a particular objective or lens (e.g., an emissions-reduction goal) through which it develops its scenario outputs. They are highly uncertain due to the complexity of adding conceptual variables to an already uncertain exercise and are best used for illustrative purposes rather than as regulatory instruments or to direct investment decisions.
Comparing Global Energy Agencies and their Scenarios
The International Energy Agency (IEA), the Organization for Petroleum Exporting Countries (OPEC), and the US Energy Information Administration (EIA) produce forecasts and scenarios that governments rely on to inform their own domestic energy policies. These agencies produce reference cases, which are effectively baseline forecasts, as well as scenarios that model specific policy outcomes, such as reduced emissions.
The IEA was created in 1974 “to help co-ordinate a collective response to major disruptions in the supply of oil” (IEA 2024). Its members must also belong to the Organisation for Economic Co-operation and Development (OECD). While the IEA was initially established with a focus on energy security and affordability, its mandate has evolved and now has a central focus on “leading the global energy sector’s fight against climate change” (IEA 2023:6).
The IEA produces an annual global energy outlook report. Initially the agency produced a supply and demand reference case (called the current policy scenario), but now it produces scenarios with varying degrees of emission reduction commitments beyond the status quo.
• The Stated Policies Scenario (STEPS) reflects existing policies in place and announced policy intentions related to reducing emissions (2017:22,35). This is effectively the reference case forecast.
• The Announced Pledges Scenario (APS) “assumes that governments will meet, in full and on time, all of the climate-related commitments that they have announced” (IEA 2023:91). This is a conceptual scenario that assumes government aspirational climate commitments are fully applied in practice.
• The Net Zero Emissions by 2050 Scenario (NZE) “portrays a pathway for the energy sector to help limit the global temperature rise to 1.5 °C above pre-industrial levels in 2100” (IEA 2023:91). This is a conceptual scenario that does not necessarily reflect any government commitments in place.
Created in 1960, Vienna-based OPEC represents petroleum exporting countries and focuses on coordinating country production levels in an effort to stabilize production and prices, to the benefit of its members (OPEC 2024a). OPEC members and affiliates control approximately 40 percent of global oil supply. OPEC and the IEA represent two sides of the same coin – the former representing producing nations and their interests, and the latter representing consumer nations and their interests, although there are some producer member countries in the IEA, including Canada, the US, the UK and Norway.
OPEC produces a world oil outlook report annually (OPEC 2023a):
• The OPEC reference case forecast is based on current policies in place.
• The OPEC Advanced Technology Scenario (ATS) “illustrates a technology-driven means of limiting the global temperature increase to well below 2°C.”
• The OPEC Laissez-Faire Scenario (LFS) assumes a high economic growth scenario for developing countries.
In contrast to both of these, the US EIA is a Washington-based agency that was created in 1974 to serve as an energy information collection, analysis and dissemination agency (EIA 2024). Unlike the IEA and OPEC, the EIA does not serve a particular membership base of countries, nor does it seek to advance a particular policy agenda on behalf of its members, rather its mandate focuses on energy information gathering and dissemination.
The EIA produces an annual International Energy Outlook (EIA 2023).
• The EIA reference case forecast assumes “current policies, as of March 2023, remain in place…policies without enforcement mechanisms are discounted, and those with expiration dates expire as indicated.”
• The EIA also produces two scenarios that deviate from the reference case. These are high and low technology cost scenarios based on “variations in costs of zero-carbon technologies [which] affect the energy mix and emissions.”
Despite comparable population and GDP growth assumptions, the IEA, OPEC and EIA produce baseline and emissions reduction scenarios with substantial variation in their conclusions.1
The Paris-based IEA’s stated policy (STEPS) and announced policy (APS) scenarios model total energy demand levels ranging between 279-325 million barrels of oil equivalent per day (Mboe/d) (Figure 1). These estimates are well below those of the EIA, OPEC’s reference case, and OPEC’s Laissez scenario (LFS). The EIA cases model much higher demand of between 402-406 Mboe/d, and the OPEC reference case and LFS scenario range between 359-373 Mboe/d.
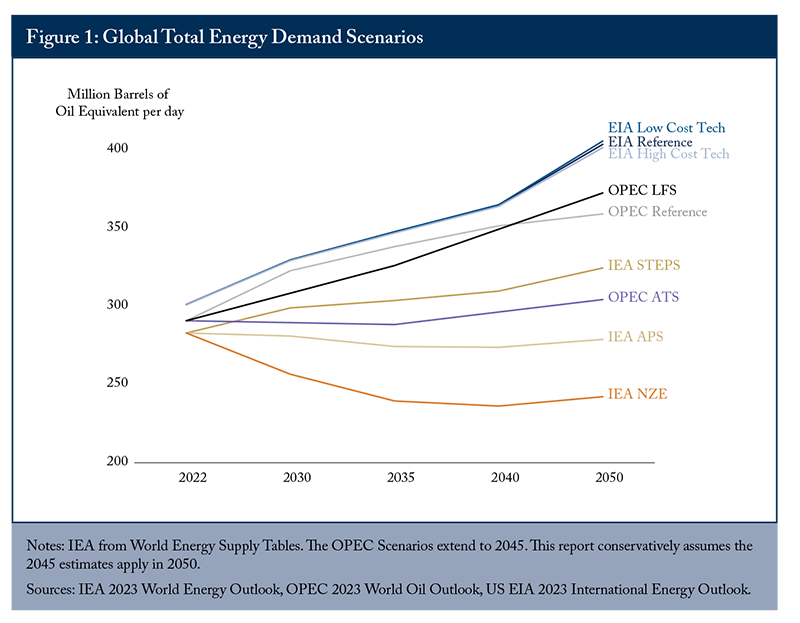
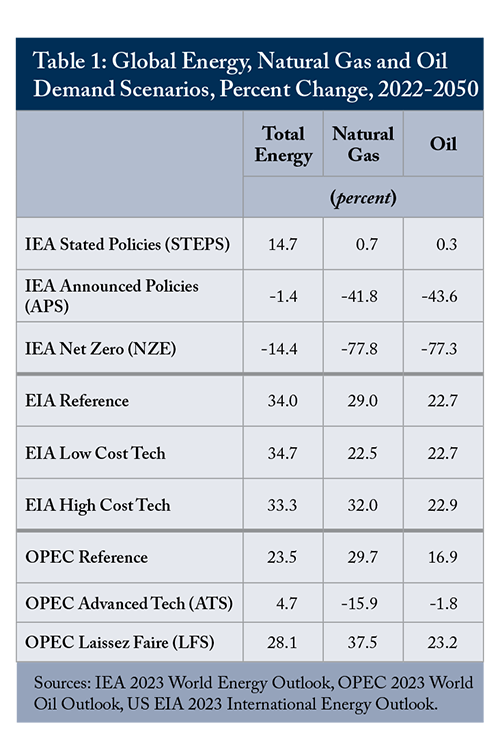
Comparing changes in demand, the EIA and OPEC reference cases anticipate an energy demand increase of 34 percent and 23.5 percent respectively by 2050, while the IEA STEPS anticipates an increase of only 14.7 percent (Table 1). For the more aggressive emissions reduction scenarios, OPEC’s ATS anticipates a 4.7 percent increase in demand, while the IEA’s NZE and APS anticipate decreases of -14.4 percent and -1.4 percent, respectively.
3.5 Global Natural Gas and Oil Demand
The IEA scenarios for oil and gas demand also diverge from those of the other agencies.
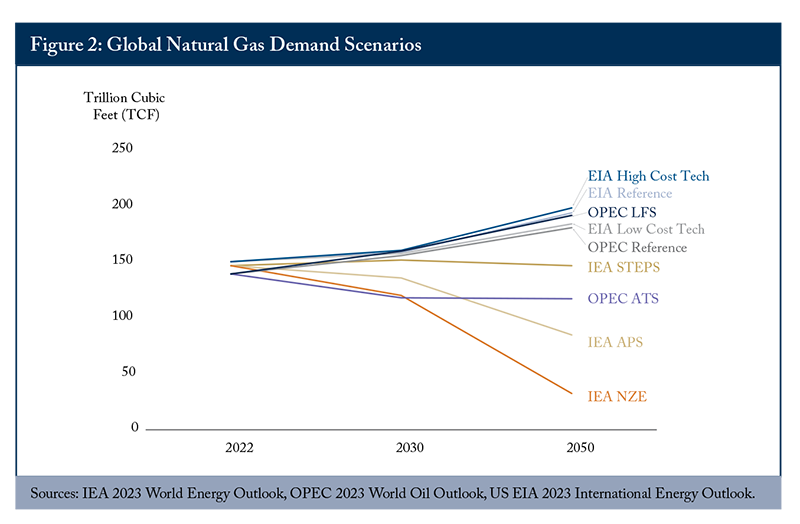
The EIA and OPEC reference cases anticipate natural gas demand in the range of 181-195 trillion cubic feet (TCF) by 2050 (Figure 2) – or approximately 29 percent growth from 2022 levels (Table 1). Conversely, the IEA STEPS models natural gas demand as largely flat at 147 TCF, while its APS and NZE scenarios model a decline of 42 percent and 78 percent, respectively.
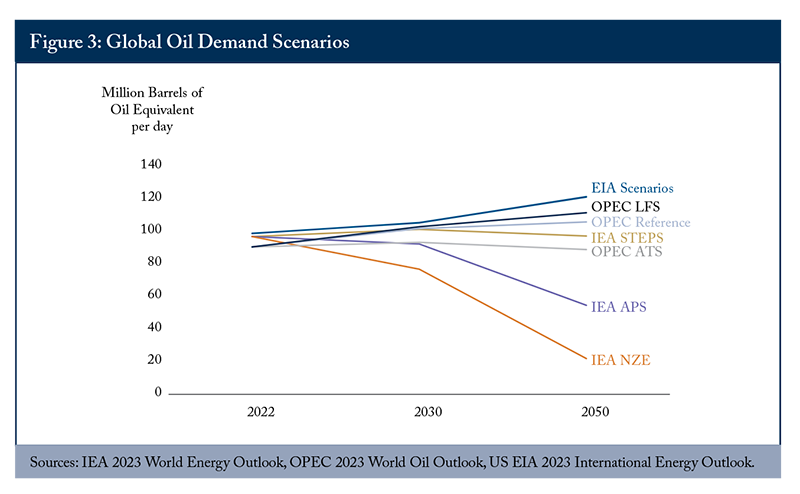
For oil, the IEA STEPS models flat growth to 2050 while the OPEC and EIA reference outlooks anticipate 17 percent and 23 percent growth respectively (Table 1). Similar to natural gas, the IEA’s APS models a 44 percent decline in gas demand.
While there is variation among the agency energy reference cases and scenarios, the IEA models starkly different outcomes than the others. The IEA STEPS, which is the reference case, models 2050 total energy demand between 26 and 61 Mboe/d lower than the OPEC and EIA reference cases respectively. The IEA STEPS scenario also models flat oil and gas growth to 2050, while OPEC and EIA predict 17-23 percent oil growth and 29-30 percent gas growth.
The IEA announced policy (APS) and net zero (NZE) scenarios can best be compared to the OPEC advanced technology scenario (ATS). Even then, the APS and NZE are between 24-76 Mboe/d lower in terms of total energy demand.
These findings have important implications for energy scenario modelling in Canada. Notably, relying on the IEA will automatically build in lower total energy and oil and gas demand assumptions, relative to the other global agencies.2
Energy Forecasts and Scenarios in Canadian Public Policy
Energy forecasting and scenario modelling are materially relevant for Canada in both a domestic and international context. Our economy is highly dependent on oil and gas production for both consumption and export. At the same time, policymakers in Canada and elsewhere are making an effort to reduce GHG emissions.
In 2023, Canada produced approximately 17.8 billion cubic feet of gas per day (bcf/d) and ~4.8 million barrels of oil per day (Mb/d) (CER 2023b). Globally, Canada is the 6th largest producer of natural gas, and 4th largest producer of petroleum and petroleum liquids – the majority of which are exported (EIA 2022). Canada has an additional 1,373 trillion cubic feet (tcf) of natural gas (Canadian Gas Association 2023) and 164 billion barrels of oil reserves (Government of Alberta 2022, OPEC 2023b). In 2022, the oil and gas industry contributed over $110 billion to GDP (5.4 percent) and over 567,000 jobs.3
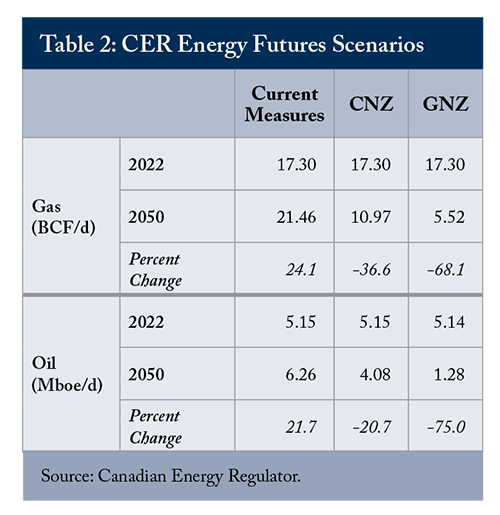
The Canadian Energy Regulator (CER) produces an annual energy outlook entitled Canada’s Energy Futures. In its 2023 edition, three scenarios are developed: a Current Measures Scenario based on existing policies in place, a global net zero scenario (GNZ) and a Canadian net zero scenario (CNZ) (CER 2023).4
The federal government increasingly relies on the CER’s energy policy scenarios to shape its own energy emissions policies and regulations, to the point where it expressly tied the CER net zero scenario to its proposed oil and gas emissions regulation (Government of Canada 2023).
While it makes sense to consider net zero scenarios, incorporating them into regulatory instruments is problematic. Energy scenarios are purely conceptual, and their use as a tool to direct macro-level energy investment policies and regulations can create country-level exposure to significant energy supply, affordability and security disruptions – particularly if they lack objectivity in their development and application. A number of significant risks arise in the development and production of the CER net zero scenarios and in their use by the federal government, which are discussed below.
4.1 CER Overreliance on the IEA in its Net Zero Scenarios
In terms of the development of the CER scenarios themselves, the international assumptions for the CER global net zero (GNZ) and Canadian net zero (CNZ) scenarios rely on the IEA’s net zero (NZE) and announced policy (APS) scenarios, respectively (CER 2023 22). Specifically, the CER uses the IEA’s projections of key global variables such as oil and gas prices. Figures 4 and 5 depict CER’s Scenarios for Canadian oil and natural gas production.
The CNZ and GNZ oil and gas production scenarios follow trajectories very similar to the IEA APS and NZE scenarios, with significant reductions in oil and gas production.
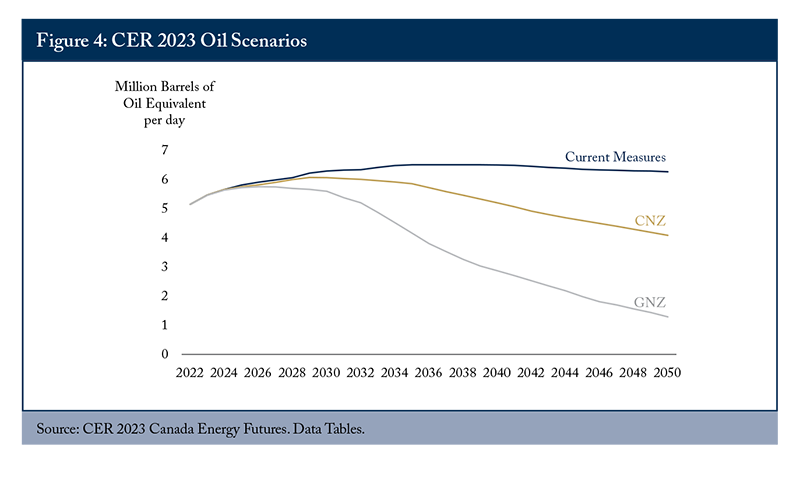
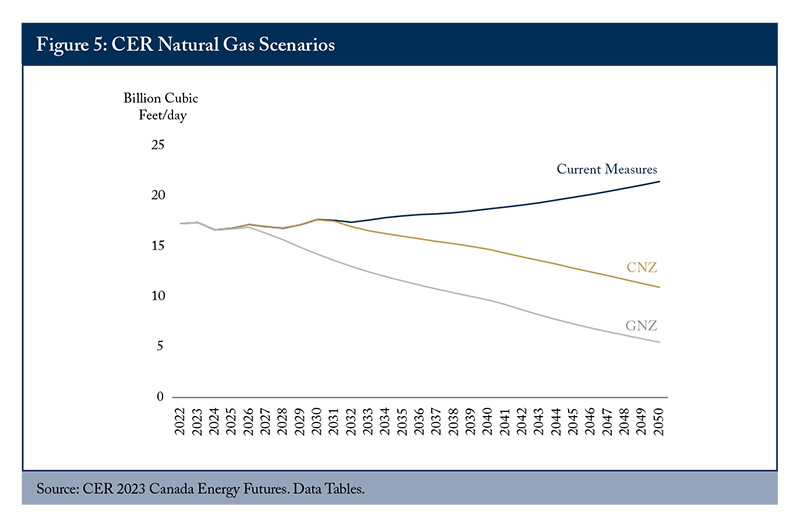
Conversely, in the current measures scenario, the CER reviews “global scenario analysis produced by institutions, academia, industry, private forecasters, and other relevant energy analysis, to develop our own assumptions” (CER 2023:23). These scenario results are consistent with the EIA and OPEC reference cases – depicting oil and gas growth of 22 percent and 24 percent respectively (Table 2).
The CER’s heavy reliance on the IEA’s scenarios for its net zero oil and gas price assumptions is problematic. The IEA’s scenarios predict distinctively lower total energy and oil and gas consumption relative to its peer agencies, and both OPEC and the EIA have modelled scenarios that result in lower or slower growth in emissions while growing or maintaining global oil and gas production.
Indeed, the IEA’s mandate has evolved. While it was initially established with a focus on energy security and affordability, it now has a central focus on “leading the global energy sector’s fight against climate change” (IEA 2023:6). Consequently, overly relying on the IEA for scenario modelling and, subsequently, Canadian policy decisions risks relying on an agency that is increasingly an advocate for an emissions reduction agenda, as opposed to a source of objective energy forecast information. This is problematic because it creates a risk that corresponding policy decisions would not be based on objective information, but rather on the desired outcome of an advocate organization - irrespective of whether the government making the decisions shares the same objective.
This is not to say the other agencies are purely unbiased, indeed OPEC clearly has producer member interests at heart. Rather, a more prudent and balanced approach would be for the CER to incorporate the assumptions of comparable scenarios from other agencies, in addition to the IEA, in the development of its net zero scenarios. This approach mitigates the risk of relying on any one agency and its inherent biases in the development of scenarios. It will likely lead to a more probable result that would be less disruptive to the Canadian economy if relied upon for policy implementation.
4.2 Errors in Data and Content Presentation
Another concern of using the CER CNZ as a regulatory instrument relates to the presentation and production of the results. By way of illustration, the production scenarios in the 2023 Canada Energy Futures report differ depending on whether the dataset draws from the Energy Futures Report charts or the appendix (Figures 6 and 7).
There is a 6.5 Mboe/d cumulative difference between the CNZ scenario for oil production using the appendix data versus the chart data, and there is a -40.7 bcf/d difference for natural gas production using the appendix data versus the chart data.
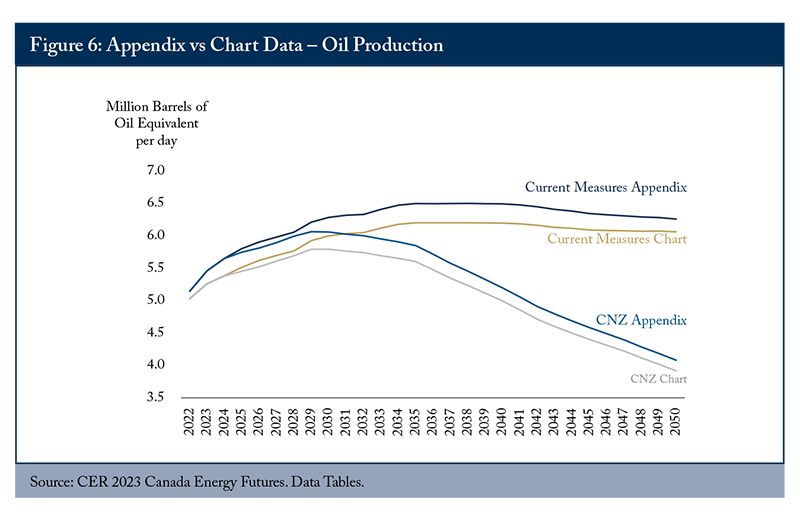
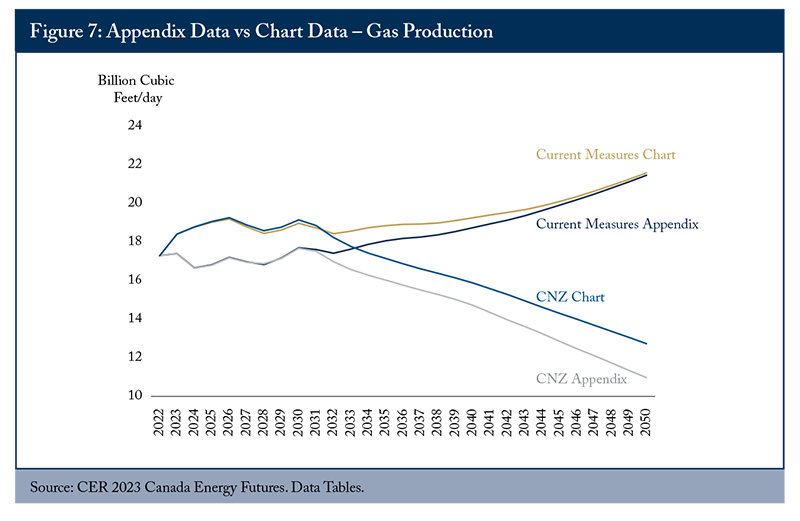
This difference is material if the results are used for government regulatory purposes. While the CER has acknowledged this fact with the addition of an errata on its website, the broader issue is the presence of errors and omissions in scenarios that governments rely on to regulate industry and direct investment decisions. This issue is not unique to the CER, but is raised to illustrate the imprudence of relying on forecasts and scenarios as policy or regulatory instruments, as opposed to context to inform decisions.
4.3 Government Influence in the Development and Use of CER Energy Scenarios
“A governmental agency removed from political and ministerial oversight is theoretically less influenced by policy outcomes when crafting its forecasts; conversely, an agency with less operational independence from government may be more influenced by the desired outcomes of government….Further, the agency may not address or come to certain conclusions on controversial policy matters in the forecast, depending on the government of the day. Such incorporations, even when politically uncomfortable, may in fact be necessary to produce a more accurate portrayal of the future” (Vegh and Thompson 2021).
The CER’s energy information mandate, by the nature of its relationship to the federal government, is susceptible to government influence and direction. In 2021, Federal Natural Resource Minister Wilkinson wrote to the CER requesting that it “undertake scenario analysis consistent with Canada achieving net-zero emissions by 2050 as soon as possible” (CER 2021b). While the CER has previously produced lower emissions scenarios, the 2023 analysis marks the CER’s “first long-term outlook modeling net-zero by 2050” (CER 2023:1).
In December 2023, the federal government released the Regulatory Framework for an Oil and Gas Sector Greenhouse Gas Emissions Cap, which calls for “the legal upper bound in 2030 [to] be set at a level that assumes that covered sources achieve technically achievable emission reductions by 2030 for production levels aligned with the Canada Energy Regulator’s Canada Net-Zero scenario (CNZ)” (Government of Canada 2023).
The fact that the government requested that the CER produce a Canada net zero scenario, and then used that scenario in the same year in a proposed regulatory framework suggests that the relationship between Canada’s federal government and its national energy information agency is not sufficiently arm’s-length.
While the CER, to their credit, has been very transparent in how they responded to and engaged with the government and the public in addressing this request (CER 2023:16-17), greater structural autonomy of the CER’s energy information function from the government of Canada would only help strengthen the independence of the agency and institutionalize its objectivity as provider of energy information. A useful comparator in this regard is the EIA, which “collects, analyzes, and disseminates independent and impartial energy information to promote sound policymaking, efficient markets, and public understanding of energy and its interaction with the economy and the environment” (US EIA 2024).
Recommendations
This paper offers recommendations to strengthen the development and use of energy forecasts and scenarios in federal Canadian policy decision-making.
The CER, in the development of its energy futures reports, should:
1. Adopt an approach that incorporates assumptions from a breadth of comparable global agencies in the development of all its Canada Energy Future scenarios, including its net zero scenarios, which rely overly heavily on the IEA.
2. Continue to consistently produce a reference case energy futures scenario as a comparative forecast benchmark for any additional policy scenarios it develops.
3. In the development of lower emissions scenarios, apply a breadth of assumptions of energy supply and demand across multiple energy sources, including modelling the prospect of higher oil and gas prices and, correspondingly, Canadian export production.
The federal government should:
4. Enhance the independence of CER’s energy information function, structuring it as an arm’s-length objective information sharing agency with a mandate to “promote sound policymaking, efficient markets, and public understanding of energy and its interaction with the economy and the environment,” similar to the US EIA.
5. Rather than directing the CER to create government energy policy scenarios, preserve the independence and integrity of the CER’s energy information sharing function, and have the government create its own publicly available energy policy scenarios.
6. Adopt a policy of only relying on energy scenarios as context to inform energy policy discussions, recognizing their inherent uncertainty and their lack of suitability as binding investment policy and regulatory instruments, and commit to revisiting forecast- and scenario-informed government decisions regularly.
7. For emissions policy decisions and regulatory requirements, conduct detailed, realistic and practically applied analysis of the lowest cost pathways to reduce emissions, while maximizing economic value. The analysis should include the forgone economic benefits of investment loss, costs of industrial restructuring, regulatory processes and delay, affordability and reliability costs to Canadians and Indigenous communities, and the impact on global GHG emissions.
Objectivity in energy forecasting and scenario modelling is critically important to sound energy policy decision-making. Forecasts seek to predict the future, while scenarios are conceptual and highly uncertain models of a particular outcome or policy objective. These tools need to be developed robustly and applied judiciously – ideally used as context to inform policy and regulatory decisions, rather than as policy or regulatory instruments in and of themselves.
Appendix: Comparisons of Private Sector and Government Energy Scenarios
References
Canadian Energy Regulator. 2017. “Market Snapshot: 50 years of Energy Futures.” Available at:
https://www.cer-rec.gc.ca/en/data-analysis/energy-markets/market-snapshots/2017/market-snapshot-50-years-energy-futures.html
__________. 2021a. “Canada’s Energy Future 2021.” Available at: https://www.cer-rec.gc.ca/en/data-analysis/canada-energy-future/2021/canada-energy-futures-2021.pdf
__________. 2021b. Minister of Natural Resources, Letter to Caissie Doyle. Available at: https://www.cer-rec.gc.ca/en/about/news-room/whats-new/2021/canadas-energy-future-report-minister-letter-to-cer-16-december-2021.pdf
__________. 2022. “Governance of the Canada Energy Regulator – Mandate, Roles and Responsibilities.” Available at: https://www.cer-rec.gc.ca/en/about/who-we-are-what-we-do/governance/governance-canada-energy-regulator-mandate-roles-responsibilities/index.html#s2
__________. 2023a. “Canada’s Energy Future 2023.” Available at: https://www.cer-rec.gc.ca/en/data-analysis/canada-energy-future/2023/canada-energy-futures-2023.pdf
__________. 2023b. “Canada’s Energy Future 2023. Energy Supply and Demand Projections to 2050.” Available at: https://open.canada.ca/data/en/dataset/7643c948-d661-4d90-ab91-e9ac732fc737
__________. 2023c. “Access and Explore Energy Future Data.” Available at: https://www.cer-rec.gc.ca/en/data-analysis/canada-energy-future/2023/access-and-explore-energy-future-data.html
__________. 2024. Energy Commodities. Available at: https://www.cer-rec.gc.ca/en/data-analysis/energy-commodities/index.html
Canadian Gas Association. 2023. “Natural Gas Facts.” Available at: https://www.cga.ca/natural-gas-statistics/natural-gas-facts/#:~:text=How percent20much percent20natural percent20gas percent20resource,the percent20use percent20of percent20natural percent20gas percent3F
Goulding, A.J. 2019. Dammed If You Do: How Sunk Costs are Dragging Canadian Electricity Ratepayers Underwater. Commentary 528. Toronto: C.D. Howe Institute. Available at: https://www.cdhowe.org/public-policy-research/dammed-if-you-do-how-sunk-costs-are-dragging-canadian-electricity-ratepayers-underwater
Government of Alberta. 2022. “Oil sands facts and statistics.” Available at: https://www.alberta.ca/oil-sands-facts-and-statistics#:~:text=Reserves percent20and percent20production&text=Alberta percent27s percent20oil percent20sands percent27 percent20proven percent20reserves,day percent20(bpd) percent20in percent202022
Government of Canada. 2022. “2030 Emissions Reduction Plan. Canada’s Next Steps for Clean Air and a Strong Economy.” Available at: https://www.canada.ca/en/services/environment/weather/climatechange/climate-plan/climate-plan-overview/emissions-reduction-2030.html
__________. 2023. “Regulatory Framework for an Oil and Gas Sector Greenhouse Gas Emissions Cap.” December. Available at: https://www.canada.ca/en/services/environment/weather/climatechange/climate-plan/oil-gas-emissions-cap/regulatory-framework.html
Hendriks, Richard, Phillip Raphals, Karen Bakker. 2017. “Reassessing the Need for Site C.” April. Available at: https://watergovernance.ca/files/2017/03/1-SITE-C-ECONOMICS-REPORT-19-04-2017.pdf
International Energy Agency. 2017. ‘World Energy Outlook.” Available at: https://www.iea.org/reports/world-energy-outlook-2017
__________. 2019. “World Energy Outlook.” Available at: https://www.iea.org/reports/world-energy-outlook-2019
__________. 2020. “World Energy Outlook.” Available at: https://www.iea.org/reports/world-energy-outlook-2020
__________. 2021. “World Energy Outlook.” Available at: https://www.iea.org/reports/world-energy-outlook-2021
__________. 2022. “World Energy Outlook.” Available at: https://iea.blob.core.windows.net/assets/830fe099-5530-48f2-a7c1-11f35d510983/WorldEnergyOutlook2022.pdf
__________. 2023. “World Energy Outlook.” Available at: https://iea.blob.core.windows.net/assets/42b23c45-78bc-4482-b0f9-eb826ae2da3d/WorldEnergyOutlook2023.pdf
__________. 2024a. Mission. Available at: https://www.iea.org/about/mission
__________. 2024b. “Energy System of Germany. Electricity Generation by Source. CO2 Emissions by Source.” Available at: https://www.iea.org/countries/germany
International Monetary Fund. 2024. World Economic Outlook Update. Moderating Inflation and Steady Growth Open Path to Soft Landing. January. Available at: https://www.imf.org/en/Publications/WEO/Issues/2024/01/30/world-economic-outlook-update-january-2024#:~:text=Global percent20growth percent20is percent20projected percent20at,and percent20developing percent20economies percent2C percent20as percent20well
McHugh, David. 2023. “Germany went from envy of the world to the worst-performing major developed economy. What happened?” Associated Press. September 19. Available at: https://apnews.com/article/germany-economy-energy-crisis-russia-8a00eebbfab3f20c5c66b1cd85ae84ed
Organization of Petroleum Exporting Countries. 2023a. “World Oil Outlook.” Available at: https://www.opec.org/opec_web/en/publications/340.htm
__________. 2023b. “Annual Statistical Bulletin.” Available at: https://www.opec.org/opec_web/en/publications/202.htm
__________. 2024. About. Available at: https://www.opec.org/opec_web/en/about_us/23.htm
S&P Global. 2024. US Republican lawmakers attack IEA over energy security, peak oil forecast. Available at: https://www.spglobal.com/commodityinsights/en/market-insights/latest-news/oil/032124-us-republican-lawmakers-attack-iea-over-energy-security-peak-oil-forecast
Trading Economics. 2024. “German Electricity Price.” Available at: https://tradingeconomics.com/germany/electricity-price
U.S. Energy Information Administration. 2022. Canada. Available at: https://www.eia.gov/international/analysis/country/CAN
__________. 2023. “International Energy Outlook.” Available at: https://www.eia.gov/outlooks/ieo/narrative/index.php
__________. 2024. Mandate. Available at: https://www.eia.gov/about/
Vegh, George, Ian T.D. Thompson. 2021. “How to Improve Ontario Forecasting.” Available at: https://on360.ca/policy-papers/how-to-improve-ontario-energy-forecasting/#_edn7
- 1 The IEA and EIA assume 0.7 percent average annual population growth and 2.6 percent average annual GDP growth to 2050. OPEC assumes 0.7 percent average annual population growth and 3 percent average annual GDP growth to 2045.
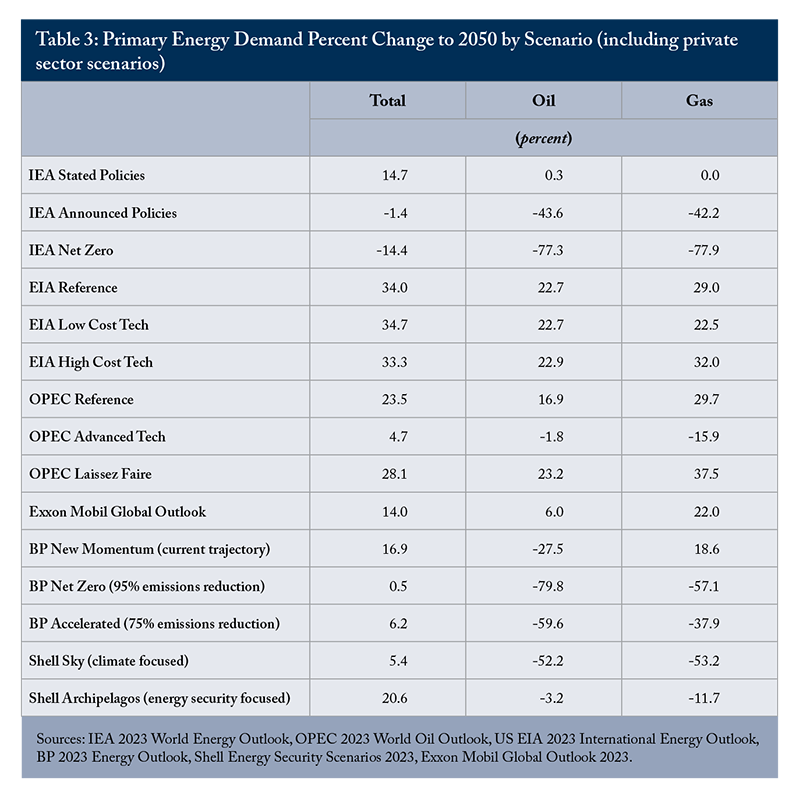
- 2 Table 3 in the Appendix includes comparisons to the scenarios produced by select energy companies (BP, ExxonMobil and Shell). These private-sector scenarios were not included in this discussion for brevity and in recognition that they are not government sanctioned scenarios. Nonetheless, their total energy demand comparisons are generally consistent with the findings herein (with higher demand in reference cases, and lower demand in lower emission scenarios), although there is significant variation in their respective predictions of future oil and gas demand.
- 3 Derived by the author from Statistics Canada Tables 36-10-0402-01, 25-10-0064-01, 18-10-0265-01, CAPP Statistical Handbook (accessed November 2022) and Prism Economics.
- 4 The CER clearly articulates that their work is not a prediction of the future, but rather an exploration of how possible futures may unfold in different scenarios. They go on to say that “[relying] on just one scenario to understand the energy outlook implies too much certainty about what could happen in the future” (CER 2023:4).