Study in Brief
- Canada’s changing demographics matter for public finances. Canada’s baby boom from the late 1940s through the mid-1960s was large. The subsequent decline in the national fertility rate was steep. As a result, some 65 years after the baby boom’s peak, Canada’s population is aging fast.
- Rapid population aging creates challenges for public finances. Departures from the workforce dampen economic growth and, therefore, government revenues. At the same time, an older population means increased spending on income supports and healthcare.
- For Canada, these challenges have an extra dimension. The direct impacts of aging affect the provinces and territories more than the federal government, and some more than others. This Commentary quantifies these pressures and discusses their implications for budgets at both levels of government, in particular the pressure that rising healthcare expenses will put on provincial taxes and other programs.
- Higher federal transfers to the provinces and territories are one potential response to demographically driven budgetary pressures. However, federal transfers blur accountability for taxes and program quality – and in this context also threaten to undermine the fiscal discipline Canadians need from provincial governments. Efforts to get more bang for the buck in program spending, especially in healthcare, and an increase in the share of consumption taxes levied by the provinces are better responses to the fiscal pressures of aging.
The authors wish to thank Alexandre Laurin, Don Drummond, Kevin Milligan, Tom Wilson and anonymous reviewers for comments on previous reports and earlier drafts of this one. Responsibility for any errors and the conclusions is ours.
Fiscal Impacts of Demographic Change
Changes in the population’s age structure affect government budgets in several ways. On the revenue side, our investigation highlights the impact of changes in the working-age population on the total workforce and on the generating of taxable activity. On the spending side, it highlights the implications of changes in age groups that are especially likely to receive transfers or in-kind services.
Our fiscal projections over the next 45 years in our baseline scenario use methods that are straightforward to explain and replicate. We use Statistics Canada’s medium-growth scenario projections for each province and territory’s population,1 based on the following assumptions (Statistics Canada 2024).
-
Total fertility rate: Rises from 1.33 in 2022 to 1.37 children per woman by 2047/2048 and remains constant thereafter.
-
Life expectancy: Rises to 86.8 years for males and 89.9 years for females by 2067/2068, up from 79.1 and 83.6 in 2022, respectively.
-
Interprovincial migration: Transitions linearly from recent rates (2020/2021) to long-term averages since 1991/1992 in 10 years, remaining constant thereafter.
-
Immigration rate: Decreases from 1.2 percent in 2022/2023 to 0.93 percent by 2047/2048 and remains constant thereafter.
-
Non-permanent residents: Rises from 3.9 percent of the resident population in 2022 to 6.7 percent in 2024 before declining to 4.7 percent in 2048 and remaining constant thereafter.2
-
Net emigration rate: Rises from 0.08 percent in 2022/2023 to 0.12 percent of the resident population by 2047/2048 and remains constant thereafter.
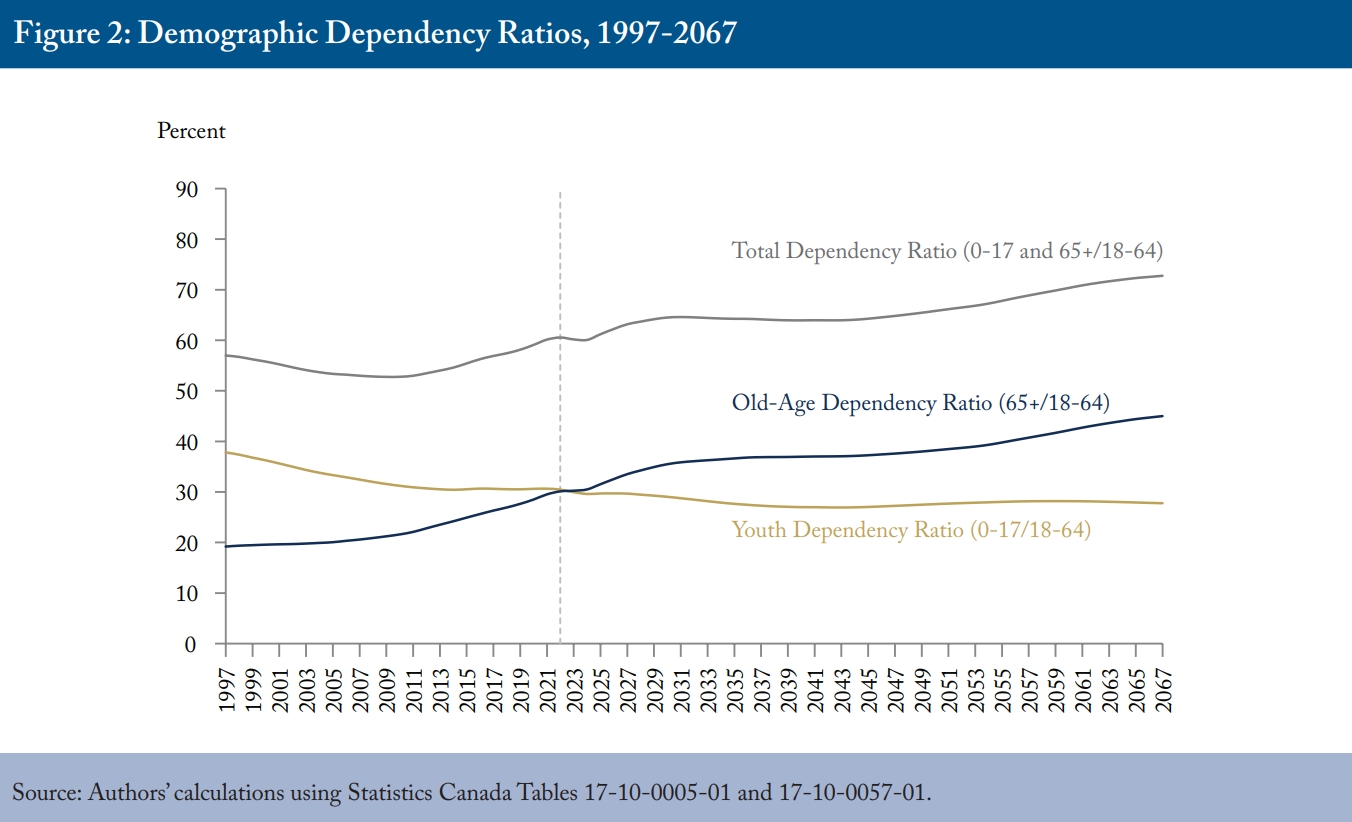
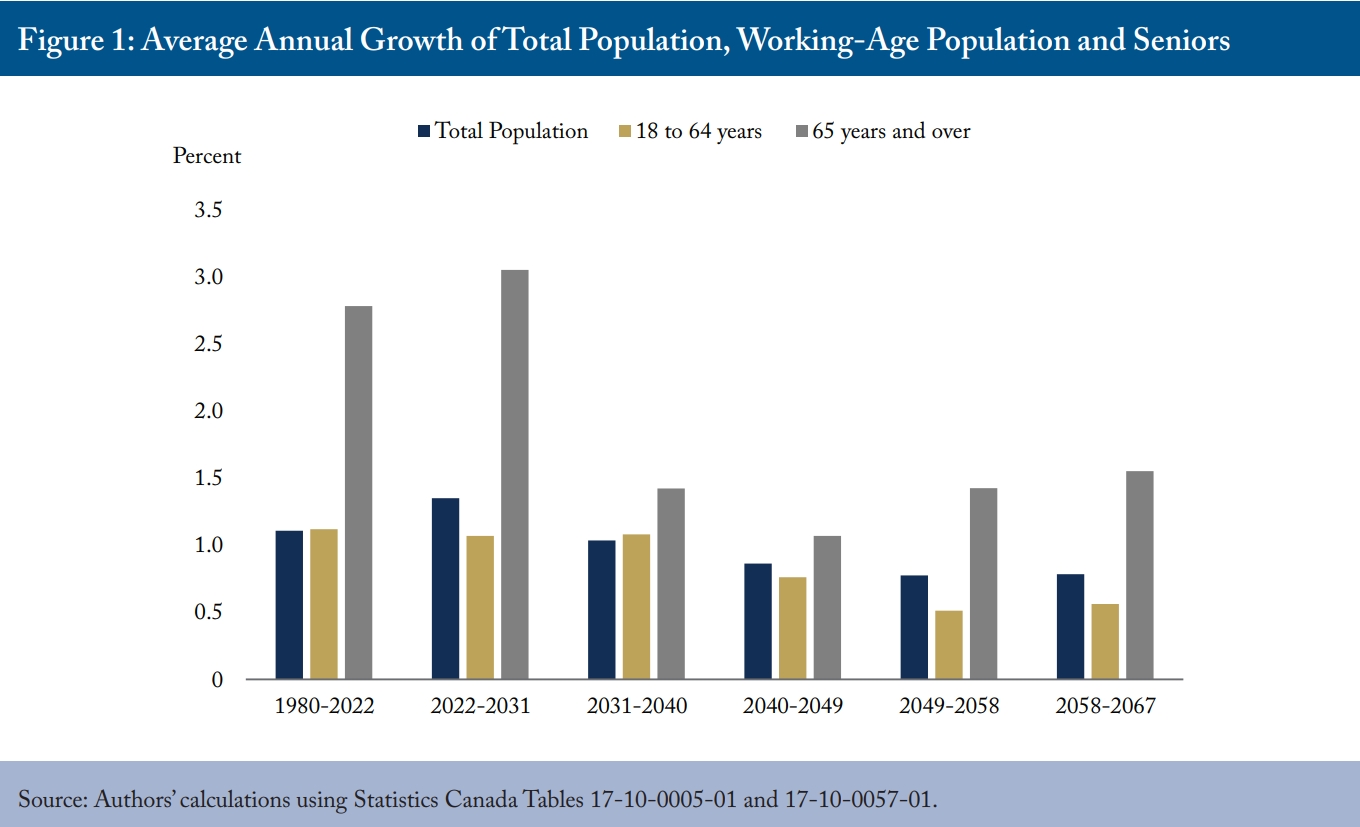
One critical feature of these projections is the number of seniors growing considerably faster than the working-age population throughout the 45-year period, albeit at a slower pace during the 2030s and 2040s (Figure 1). A familiar measure of population aging, the old-age dependency ratio – the ratio of people older than 64 to those ages 18-64 – rises from its recent value of about 30 percent, or fewer than one senior for every three potential workers, to 45 percent, or almost one senior for every two potential workers, by the end of the projection period despite relatively high immigration (Figure 2). For reference, we show the population aged 0-17 years relative to the working age population; that ratio decreases by about three percentage points over the projection period.
Workforce, GDP and Tax Revenue
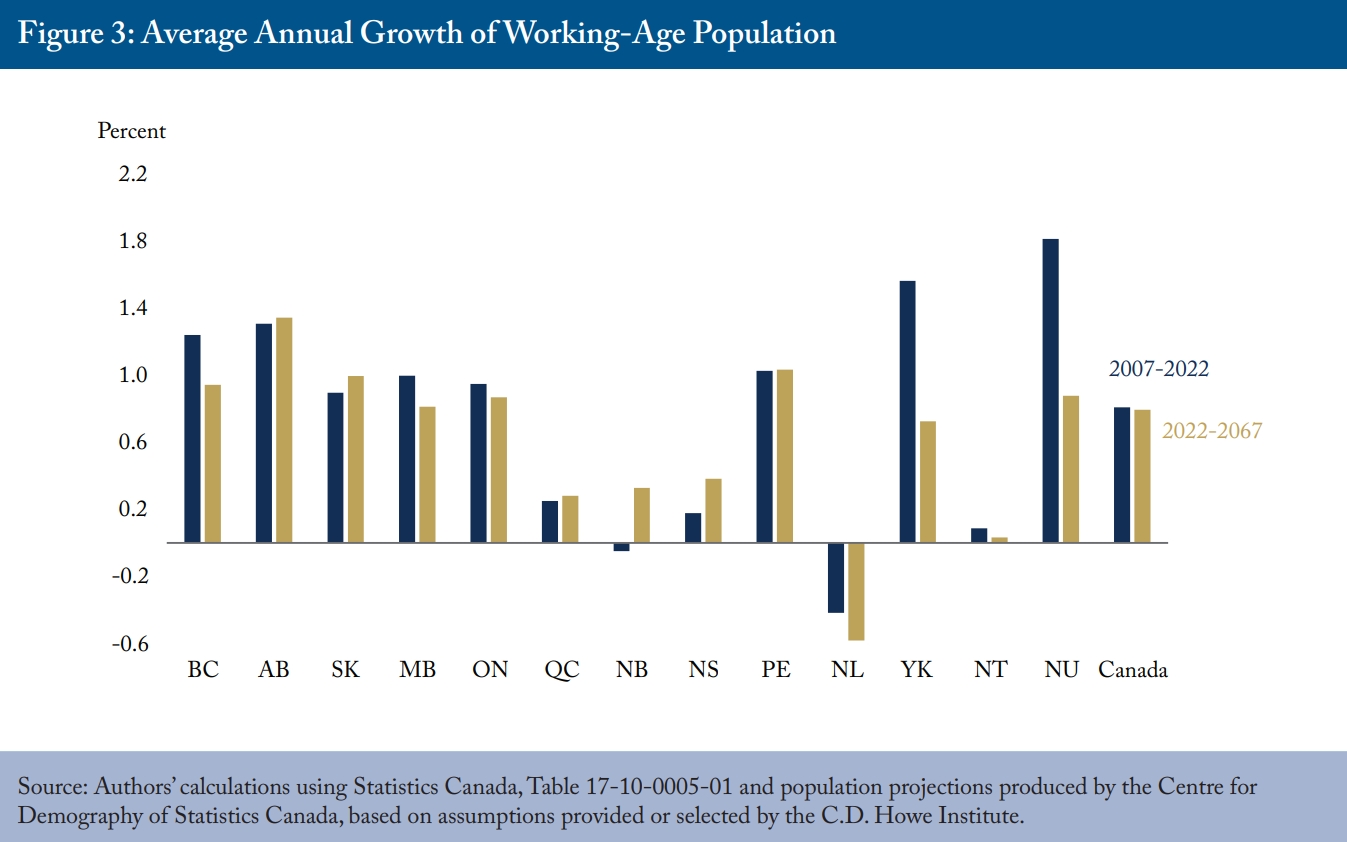
Canada’s workforce is the foundation for economic activity, including the generation of tax revenues. Transitioning to medium immigration rates makes the outlook for future growth rates in the working-age population similar to the recent past, albeit with strong differences across the country (Figure 3). Again, for the sake of projections that are simple to explain and replicate, we assume that real output per working-age person (we define working age as 18-64), which is a high-level measure of labour productivity, grows at the same average annual rate of 0.94 percent recorded from 2002 to 2022.3
These calculations provide real GDP projections for each province and territory, which we convert to nominal dollars by multiplying them by the Bank of Canada’s target inflation rate of 2 percent. (National GDP in each year is the sum of provincial and territorial subtotals.)
We project government revenues as an aggregate “tax take” relative to GDP. We assume the ratio of revenues to GDP remains constant at 2022 levels for each province and territory, as well as for the federal government, throughout the period.4 This assumption is arguably different from those underlying our spending projections, which are based on the assumption that current programs do not change.
The graduated rate structure of personal income taxes means that real growth in personal incomes resulting from rising productivity will move people into higher tax brackets over time. We do not model this effect, however, because higher real incomes also reduce effective tax rates as people rise above thresholds for income-testing of tax benefits. As well, the aging population will reduce the relative size of the personal income tax base, and behavioural changes can undercut revenues from increases in top income-tax rates (Laurin 2018).
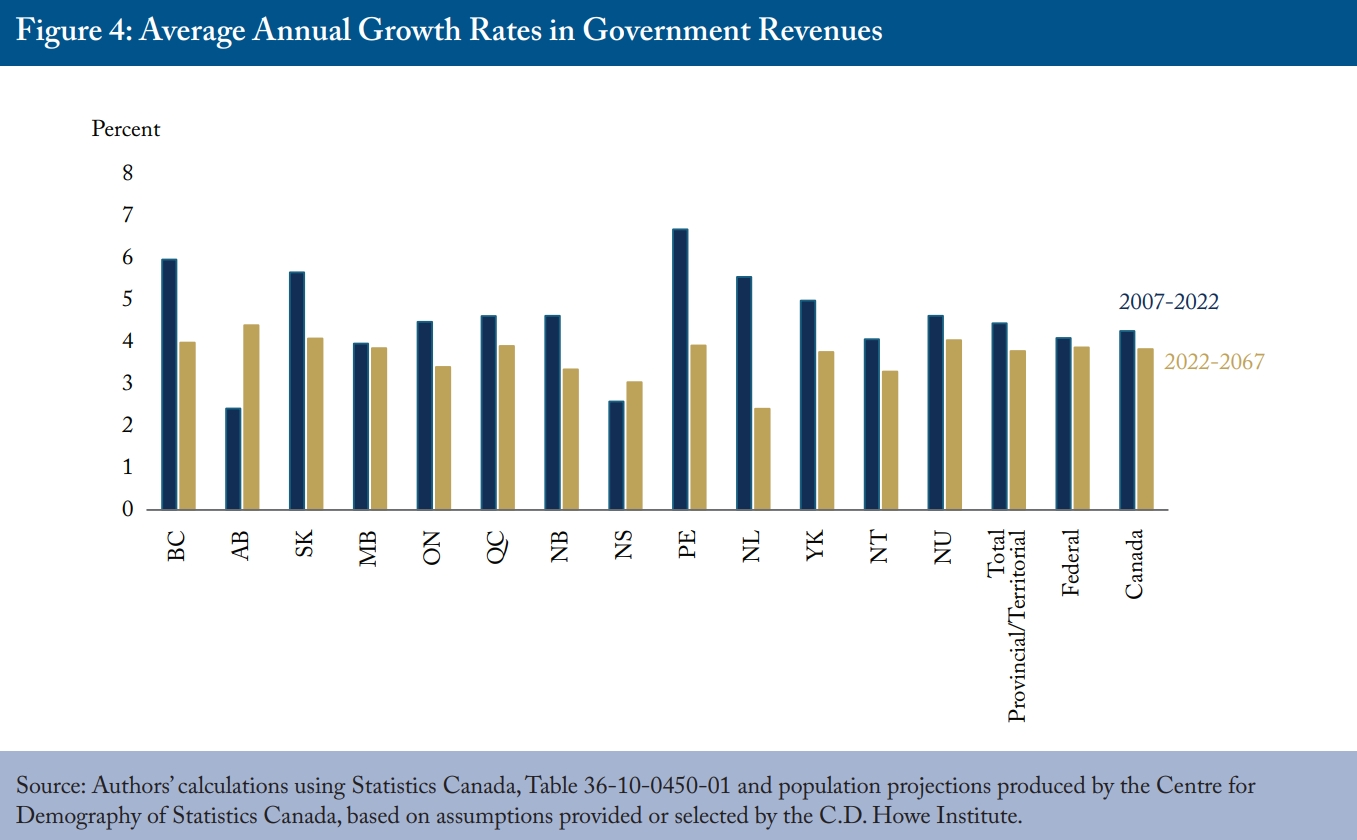
Those qualifications noted, the assumption of a constant tax take also makes our results easy to understand and replicate. Figure 4 compares the resulting projections for tax revenue growth to past results by province and territory, as well as by the national total. The differences in the projected revenues across provinces reflect differences in the growth of their working-age populations.
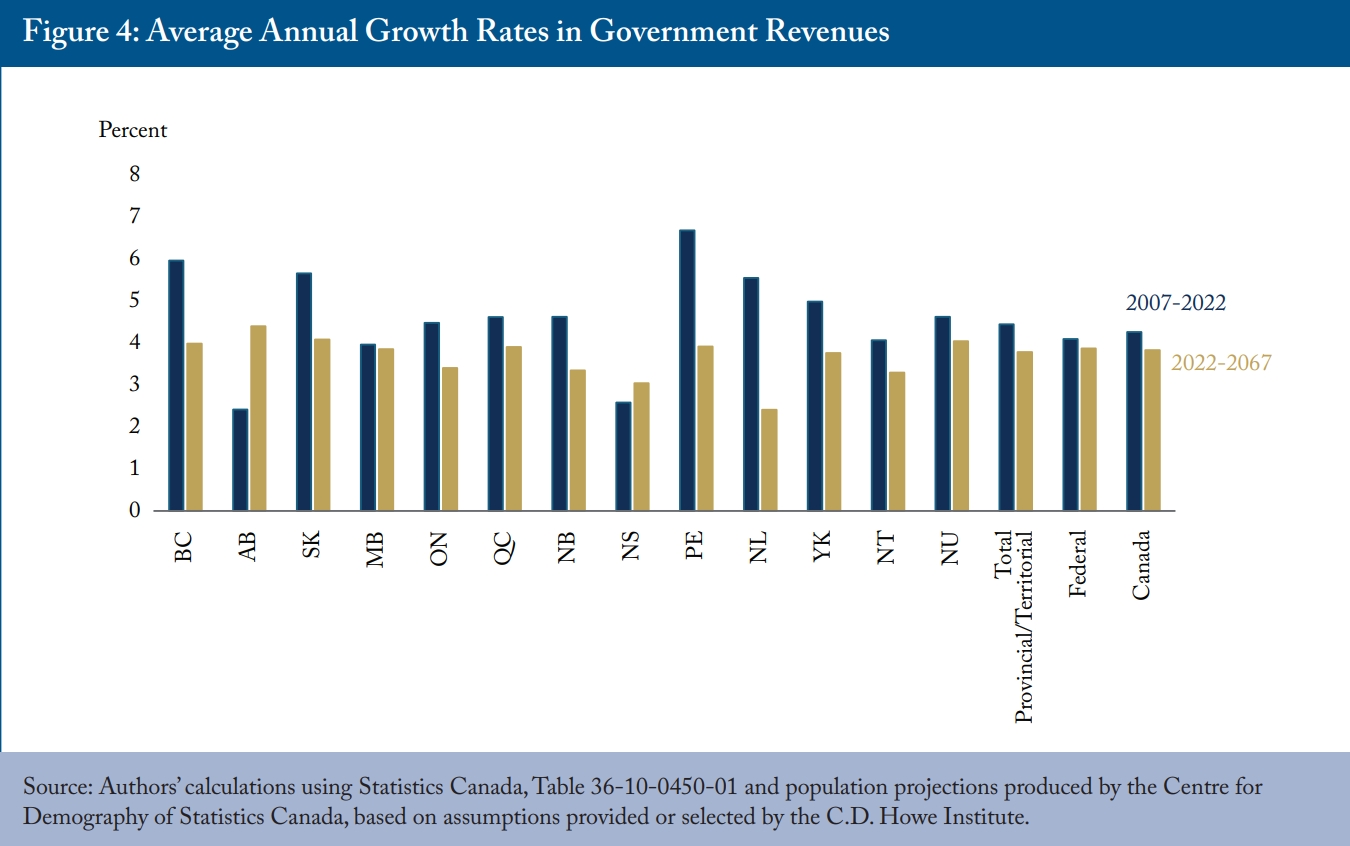
Because discussions of the fiscal impacts of demographic change tend to focus more on the spending side – the cost of public pensions and healthcare in particular – the potential impact of slower workforce growth on government revenues merits emphasis. Annual growth in revenue, absent hikes in tax rates, will be modest, even relative to a recent base period that began with the 2008 global financial crisis and included the revenue-depressing low oil prices of 2014-2016.
In the provinces with the most subdued outlook for workforce growth, such as Newfoundland and Labrador, the deceleration in government revenues will be severe, with growth rates less than one-half what they were in the past. Slower revenue growth is one side of the fiscal squeeze produced by population aging.
Healthcare, Education, Seniors’ and Family Benefits
The other side of the fiscal squeeze is the cost of demographically sensitive public programs. Our projection methods on this side are also straightforward to explain and replicate: mapping today’s spending onto tomorrow’s population. For each of four major categories of programs – publicly funded healthcare, publicly funded education, seniors’ benefits and child/family benefits – we multiply the relevant recipient population by indexes of service intensity representing real services or transfers per person. We then convert that measure of real spending into nominal dollars by multiplying it by a relevant price index.
In the case of healthcare, we divide the population into 40 groups, reflecting government spending by age and sex as calculated by the Canadian Institute of Health Information (CIHI). Our indexes of service intensity – real spending on all publicly funded healthcare services per person of a given age and sex – rise at the same rate as real output per potential worker. This assumption reflects the reality that most healthcare spending is consumption of labour-intensive services and that wages tend to rise with economy-wide productivity.5 We assume that price inflation in healthcare will be 2.5 percent annually, generally reflecting the historical margin of such cost increases over general inflation.6
In the case of education, we divide the population into two age-groups. People aged 4-17 drive provincial and territorial spending on elementary and secondary education, and people aged 18-24 drive spending on post-secondary education. As with healthcare, we multiply these populations by indexes of service intensity that rise with real GDP per potential worker. The population under 17 drives the federal government’s Canada Education Saving Grant, while the population aged 18-24 drives federal grants to postsecondary students. We assume that these transfers maintain their real value per person – that is, the index of real service intensity does not change. All these real measures are multiplied by the economy-wide inflation rate to produce nominal expenditures.
For seniors’ benefits, we use the population aged 65 and up. We derive an index of service intensity per senior from the Office of the Chief Actuary’s recent projections of spending on the Old Age Security (OAS), the Guaranteed Income Supplement, and Allowances.7 Because these benefits decline with the incomes of their recipients and the Chief Actuary’s model assumes rising real incomes, this index declines somewhat in real terms over time.8 We presume that provincial and territorial transfers to seniors follow the same real per-person path that federal ones do. We multiply all these indexes of service intensity by the economy-wide inflation rate to produce nominal expenditures.
For expenditures on family benefits, we use the populations up to age 17 for the Canada Child Benefit and provincial and territorial benefits. We assume unchanging indexes of service intensity. Federal family benefits delivered through the tax system are income-tested, so real income growth erodes their real value. We presume this happens at the same rate as economy-wide productivity growth. We presume the same dynamic for provincial and territorial family benefits. We presume that all these benefits are indexed to inflation, so we multiply them by the economy-wide inflation rate to produce nominal expenditures.
Quantifying the Impacts
To repeat, demographic change affects public finances both through its damping effect on workforce growth and, therefore, on output, incomes and government revenues and, as well, through its impact on public programs. One familiar way of summarizing these impacts is to track the cost of demographically sensitive programs relative to GDP. Another measure expresses these impacts on a scale that facilitates comparison to governments’ balance sheets. We calculate the implicit assets or liabilities that future decreases or increases in the cost of various programs represent for governments.
Demographically Sensitive Programs Relative to GDP
Historical and projected costs of publicly funded healthcare and education, seniors’ benefits and family benefits relative to GDP for Canada as a whole appear in Figure 5. Not surprisingly, the most dramatic projected change is in healthcare, where the tendency of older people to consume more services drives provincial/territorial healthcare budgets from 7.6 percent of GDP last year to 10 percent in 2043 and 12.7 percent in 2067.
In education, slower growth in the number of students relative to the working age population decreases costs relative to GDP from 4.1 percent to 3.7 percent over the 45-year period.
Growth in the relative number of seniors raises seniors’ benefits to 2.6 percent of GDP until the early 2030s. Because seniors’ benefits are indexed to prices only, and we assume productivity growth in our projections, their cost relative to GDP declines slightly for three decades before rising again in the 2060s, returning to 2.6 percent of GDP by the end of the projection period.
Family benefits trend downward throughout the projection period since these benefits are only indexed to prices, and the relevant population does not rise relative to the working-age population.
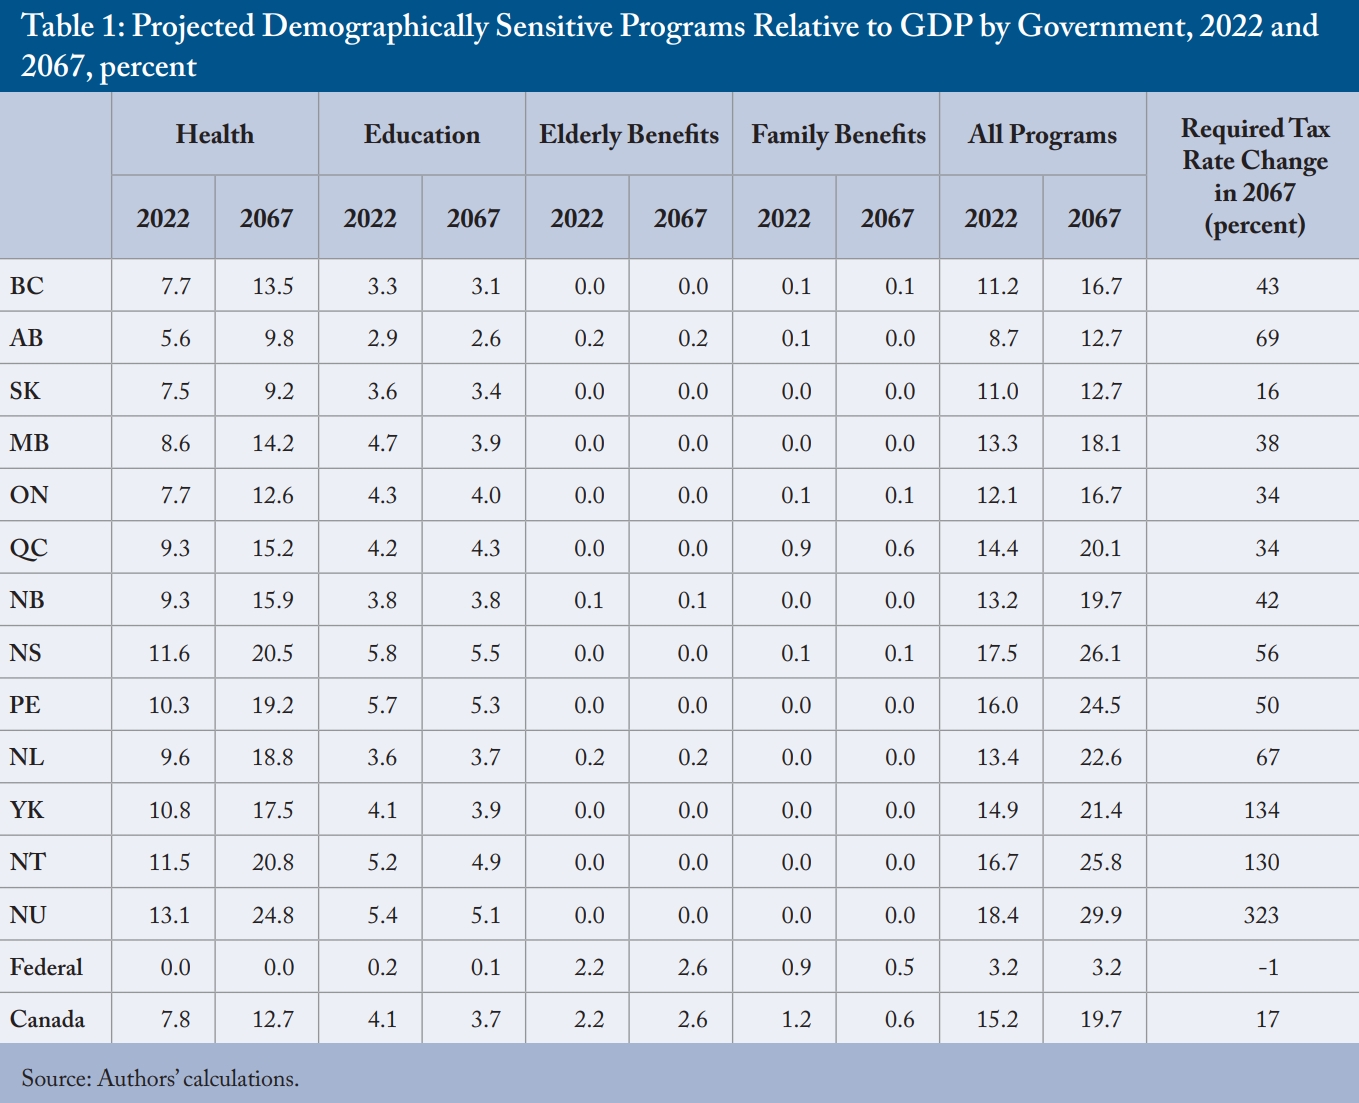
The details of demographically sensitive programs relative to GDP for each government at the beginning and the end of the projection period appear in Table 1. The rising cost of healthcare is the key story everywhere, driving the combined cost of all demographically sensitive programs up relative to GDP. The Atlantic provinces, which have older populations, and the territories, which have healthcare costs that are disproportionately sensitive to aging, are especially exposed.9 The final column shows the change in the aggregate federal/provincial/territorial tax rate – tax revenues relative to national or provincial/territorial GDP – required to meet the annual cost increase of these programs by the end of the period. For demographically exposed jurisdictions with relatively low ratios of own-source revenue to GDP, the increases are huge. For example, for Newfoundland and Labrador to meet these demands from its own revenues would require an increase of two-thirds in provincial taxes on its residents.
The federal government is in a completely different position in respect to demographically sensitive programs.10 Its healthcare spending is far more driven by policy decisions than by demography, so we do not model it in the same way we do for provincial and territorial governments. Its spending on education consists of transfers, which we assume stay constant in real dollars per person of the relevant age – unlike the delivery of education services by the provinces and territories, which escalate with our productivity-driven index of service intensity. Its transfers to seniors and families likewise are constant in real dollars per person. Therefore, family benefits tend to shrink relative to GDP and government revenues while elderly benefits increase marginally. As a result of these differences, demographic changes on their own are quite neutral in their net fiscal impact on the federal government.
Implicit Assets and Liabilities
The comparison between current and potential future tax rates is salient because most discussion of healthcare and other public programs by governments emphasizes maintaining them – perhaps enhancing, but certainly not cutting. Yet explicit commitments to raise taxes to pay for them are rare. These political understandings create an implicit liability for governments – comparable in some ways to obligations to service debt or fund public-employee pensions – because meeting these commitments will require government to raise taxes over time, a fact they rarely communicate to voters.11
Calculating these balance-sheet parallels requires choosing a time period over which to evaluate future gaps between program costs as a share of GDP and the current aggregate tax rate – the tax share of GDP – that supports them. We chose 45 years, a period representing the average life expectancy based on the current average age of all Canadians, as reasonable on the basis of existing government program commitments.12
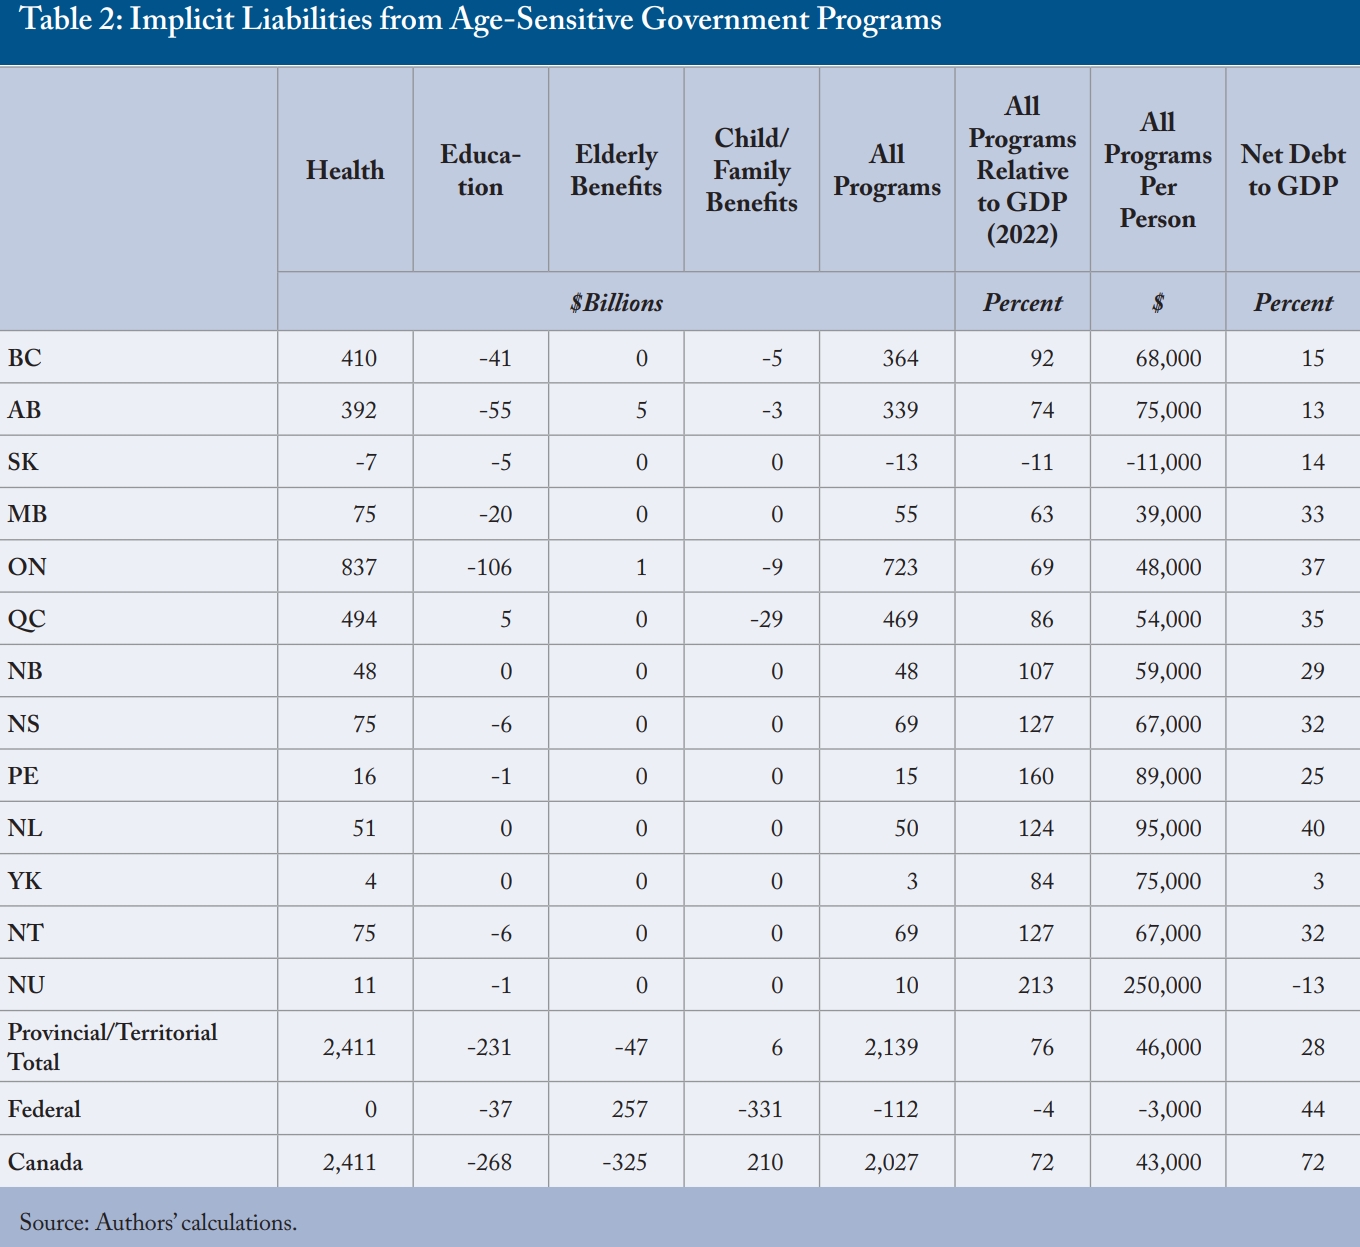
Calculating an implicit asset or liability also requires choosing a discount rate with which to express the future gaps in present-value terms. We chose the Ontario government bond yield, since Ontario is the largest government in Canada that cannot print its own money: 4.6 percent at the time of writing. Discounting the cumulative decrease or increase in the cost of each type of program for each government yields the implicit assets and liabilities shown in Table 2. The table scales each to current GDP – a common practice in evaluating government debt – and also shows the accumulated deficits and net debts to provide some perspective on their size relative to other, more familiar commitments.
In the case of Ontario, for example, the prospective increase in the aggregate tax rate needed to cover all these program outlays – which mainly reflects the rising cost of healthcare – over the next 45 years has a present value of $723 billion. In other words, to cover the additional 45-year cost of these programs, the province would need about $723 billion in assets yielding income at the same rate as its long-term bonds. This figure is about 70 percent of Ontario’s GDP or about $48,000 per Ontarian – not far short of twice the level of Ontario’s net public debt.
This presentation further highlights the federal government’s unique exposure to demographic change, which creates a modest implicit asset for it. Looking across governments as a whole, the net implicit liability of $2.03 trillion is essentially a function of the fact that demographic change will increase provincial and territorial healthcare spending relative to their revenues.13
Policy Pressures and Responses
Because the fiscal squeeze of population aging has two sides – damping revenues and boosting expenses – it makes sense to look at measures that affect each, as well as ways of preparing in the near term, before the squeeze gets worse, for the tougher challenges that lie ahead.14 First, though, we turn to a common – but we think problematic – reaction: that the most fiscally challenged provincial governments can and should turn to the less fiscally challenged federal government for help.
The Dangerous Temptation of a Federal Bailout
A regular theme in discussions of fiscal pressures affecting Canada’s provinces – usually in healthcare and lately for drug treatments, particularly – is the need for federal subsidies. The federal government has shared costs with provincial governments in the past – providing 50 percent of the aggregate cost of provincial spending on many doctor and hospital services, and a similar subsidy for post-secondary education, for example, and underwriting 50 percent of individual provinces’ welfare programs. Ottawa has since transformed those shared-cost transfers into per-person grants, but those have tended to rise when the federal government was feeling fiscally flush so a de facto element of cost-sharing still exists. Myriad other federal-provincial transfers exist in areas as diverse as policing, immigrant services and environmental protection, and the federal government has recently established new transfers related to daycare, dental care and drugs. Why not establish new federal transfers geared to other areas that aging will particularly affect, or to the population of seniors in each recipient jurisdiction?15
The fundamental problem with that approach is that all senior governments in Canada tax essentially the same bases: personal incomes, corporate profits and consumption spending. Much of the money Ottawa already transfers to the provinces simply reflects differences in how the federal and provincial governments tax these bases. Increasing federal transfers further would make the fiscal imbalance – the degree to which Ottawa is a tax-and-transfer machine supplying the provinces with the revenues they could raise themselves to perform their constitutional functions – larger. This imbalance blurs accountability: when citizens of a given province have concerns about their publicly funded healthcare, for example, each level of government can – and often does – blame the other.
Although the federal government can, in principle, establish accountability mechanisms as good or better than those provinces would establish for themselves, practice in that regard has proved disappointing to both with respect to information and enforcement. It would be more consistent with the principles of federalism if citizens in every province held their provincial government to account and if every province were more autonomous in funding and running its programs. Formal or informal transfers of tax room make more sense. Reductions in the rate of the federal Goods and Services Tax offset by increases in rates of provincial sales taxes are particularly attractive because the consumption tax base is relatively robust to aging, and because it will be easier (and less distorting) to sustain differences in HST rates across provinces with different fiscal needs than it will be to sustain differences in rates of tax on personal incomes or corporate profits.
It is not sufficient to argue that a particular hard-pressed province – which as Table 2 revealed would be one of the smaller provinces in Atlantic Canada – should be a special case suitable for a federal bailout. The redistributional impacts of such a bailout would be huge, and the political repercussions would amplify the moral hazard with larger provinces arguing that they can and should get equal treatment. Notwithstanding the fiscal strains involved, the pressure of population aging on revenues and expenses is best handled at the provincial level.
Boosting Productivity and the Tax Base
One area where the federal government can play an unambiguously positive role in addressing the fiscal challenge of population aging is with policies that raise productivity so that slower growth in the workforce does not translate straightforwardly into slower growth in GDP and tax revenues. The assumption that output per potential worker rises at historical rates is central to these projections. If it rose faster, the outlook would be better. Also, if it rose faster and the service intensity in healthcare and education that we presume rises with productivity rose less fast – even if only for a period of time – the outlook would be better yet.
Elaborating the many measures that could raise productivity is beyond the scope of this Commentary. They range from less distorting taxes to increasing competition through regulatory changes, and from liberalization of internal and international trade to better education and skills-matching in the labour market. Measures to encourage Canadians who are able and willing to stay in the workforce longer warranted a mention in an earlier report on fiscal stresses and population aging (Robson and Mahboubi 2018).
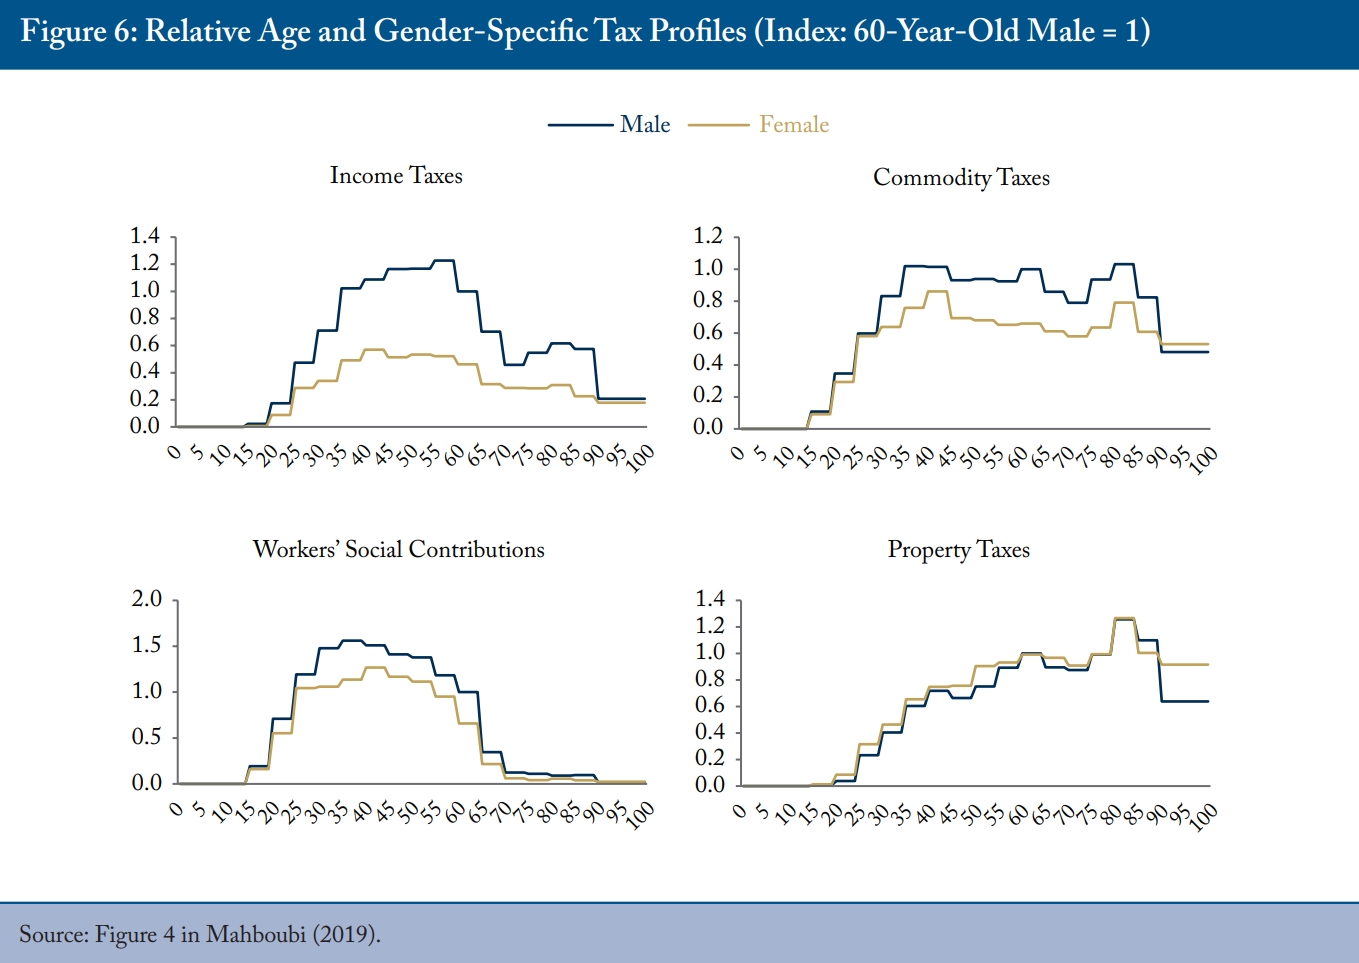
Taxation changes that boost productivity offer a bonus. Taxes on personal incomes and corporate profits tend to discourage work effort and investment. Taxes on consumption, especially the value-added-type GST/HST levied by the federal government and in most provinces, are less distorting. Jurisdictions that shift their tax bases away from income taxes and toward consumption taxes should reap the reward of higher productivity over time. The bonus in the context of population aging is that, as mentioned in the discussion of projections methods at the outset, the base for consumption taxes should be more robust than the base for income taxes when a larger share of the population is no longer in the workforce (Figure 6). While per capita income tax declines sharply after the age of 60, per capita consumption tax remains relatively constant until individuals reach their early 90s.
Three elements of publicly funded healthcare costs are particularly sensitive to the pressures of aging: senior-based drug programs, hospitals and long-term care provisions.16
In part, the sensitivity of drug programs to aging reflects policies to cover more drug costs for people age 65 and up. Although modifications to publicly funded drug coverage typically involve expansions that boost costs in the near term, provinces that offer more comprehensive coverage such as Quebec, tend to be less exposed – partly because their more comprehensive coverage provides more equal benefits to people of different ages. Gearing benefits to income rather than age lessens the longer-term tying of publicly funded drug coverage to aging.
As for hospitals, reviews such as the Ontario Commission on the Reform of Ontario’s Public Service (2012) and the MacKinnon Report on Alberta’s Finances (2019) have advocated changes such as revised scope-of-practice rules to let providers such as pharmacists and nurse practitioners to provide services currently done by more expensive physicians, better follow-up care to reduce complications and readmissions, more non-institutional care for seniors with chronic conditions, and better use of information technology in case management and coordinating patient health records. All these things are worth doing in their own right and could reduce the numbers of seniors receiving services that are expensive and often not conducive to quality of life.
Turning to long-term care, well over half the population will need continuing care support at one point in their lives – a proportion that jumps to almost three-quarters after age 65. But many citizens mistakenly believe that governments are going to cover most of their future long-term care costs. This is because public subsidies for long-term care in institutions or at home are generally opaque and misunderstood.
The ambiguity of current public-private responsibilities for financing long-term care dampens private savings and pressures the public sphere to pick up the slack when people have not prepared for their late-in-life needs and end up in costly acute care for lack of alternatives (Quinn, Isenberg and Downa 2021; Woynch 2024). An expanded public role here would heighten intergenerational inequity. Public subsidies for long-term care must be more consistently targeted to those without the means to pay for it. Doing so means setting, and publicizing, government subsidies clearly so that private options – increased savings and insurance – grow to complement public subsidies (Blomqvist and Busby 2014).
Canada stands out for the extent to which seniors receive healthcare in hospitals and long-term care settings that are both relatively expensive and inconsistent with the desires of the seniors themselves and their families. More publicly and privately provided home and community care, tax credits and other market mechanisms to increase retirement home spaces and services that are better aligned with differing needs as people age can save money and give seniors a better quality of life (Wyonch 2024).
One quite different approach to mitigating the intergenerational impact of rising healthcare costs would be to follow the lead of the late-1990s reforms to the Canada and Quebec Pension Plans, which converted them from pay-as-you-go to plans in which a portion of premiums collected from people today prefunded their future needs. Some drug programs and, potentially, long-term care, as well, are like social security programs in that people can prepare for predictable expenses by building a provident fund during their younger years.
Provinces could selectively convert pay-as-you-go programs so that babyboomers, rather than their declining numbers of children and grandchildren, pay some of the higher costs that loom (Robson 2002, Stabile and Greenblatt 2010). Prefunding does not make sense for all programs with threatened cost increases, but it can spread more fairly over time the needed tax increases for healthcare services that, like pensions, are related to age.17
Closing Comments
The fiscal impact of demographic change – in particular, the costs of providing publicly funded healthcare to an aging population that will financially stress Canadian governments – is sometimes compared to a glacier. The implication is that the changes, being gradual, require no dramatic reforms to healthcare or public policies more generally. As these projections indicate, however, the cumulative impact of even modest annual changes over time is not small – especially when the impact of aging on the revenue side is factored in.
Demographic change will stress the budgets of Canada’s provinces and territories in the decades ahead. The projected growth of healthcare and other demographically sensitive spending represents an implicit liability much larger than provincial debts – which themselves are, as they ought to be, sources of concern. While higher federal transfers will likely be part of our reaction to these pressures, the reality of a common tax base and the need for clear accountability mean that they cannot be our only reaction. Measures to raise economic growth, restrain spending and selective prefunding are better approaches to the fiscal challenge of demographic change.
Appendix
References
Alberta. 2019. Blue Ribbon Panel on Alberta’s Finances: Report and Recommendations.
Blomqvist, Åke, and Colin Busby. 2014. Paying for the Boomers: Long-Term Care and Intergenerational Equity. Commentary 415. Toronto: C.D. Howe Institute. September.
Busby, Colin, and William B.P. Robson. 2011. A Social Insurance Model for Pharmacare: Ontario’s Options for a More Sustainable, Cost-Effective Drug Program. Commentary 326. Toronto: C.D. Howe Institute. April.
Canadian Institute for Health Information (CIHI). 2022. National Health Expenditure Trends. 2022. Ottawa.
Laurin, Alexandre, and William B.P. Robson. 2015. Adaptability, Accountability and Sustainability: Intergovernmental Fiscal Arrangements in Canada. Commentary 431. Toronto: C.D. Howe Institute. July.
Laurin, Alexandre. 2018. “Unhappy Returns: A Preliminary Estimate of Taxpayer Responsiveness to the 2016 Top Tax Rate Hike.” E-Brief. Toronto: C.D. Howe Institute. September.
Mahboubi, Parisa. 2019. Intergenerational Fairness: Will Our Kids Live Better than We Do? Commentary 529. Toronto: C.D. Howe Institute. January.
Office of the Chief Actuary. 2018. Actuarial Report (17th) on the Old Age Security Program, as at 31 December 2018. Ottawa: Office of the Superintendent of Financial Institutions.
Ontario. 2012. Public Services for Ontarians: A Path to Sustainability and Excellence. Commission on the Reform of Ontario’s Public Services. Queen’s Printer for Ontario.
Quinn, Kieran, Sarina Isenberg, and James Downar. 2021. Expensive Endings: Reining In the High Cost of End-of-Life Care in Canada. Commentary 608. Toronto: C.D. Howe Institute. October.
Robson, William B.P. 2001. Will the Baby Boomers Bust the Health Budget? Demographic Change and Health Care Financing Reform. Commentary 148. Toronto: C.D. Howe Institute. February.
________________. 2007. “Time and Money: The Challenge of Demographic Change and Government Finances in Canada.” Backgrounder 109. Toronto: C.D. Howe Institute. December.
Robson, William B.P., and Parisa Mahboubi. 2018. “Inflated Expectations: More Immigrants Can’t Solve Canada’s Aging Problem on Their Own.” E-Brief. Toronto: C.D. Howe Institute. March.
Stabile, Mark, and Jacqueline Greenblatt. 2010. “Providing Pharmacare for an Aging Population: Is Prefunding the Solution?” IRPP Study 2. Montreal: February.
Statistics Canada. 2024. “Population Projections for Canada (2023 to 2073), Provinces and Territories (2023 to 2048): Technical Report on Methodology and Assumptions.” Catalogue no. 91-620-X. ISBN 978-0-660-71821-7. Ottawa: Statistics Canada. June.
Wyonch, Rosalie. 2024. Scenarios for Seniors’ Care: Future Challenges, Current Gaps and Strategies to Address Them. Commentary 656. Toronto: C.D. Howe Institute. April.
- 1 The medium-growth scenario represents the continuation of current trends in the short term and a plausible evolution in the long term (Statistics Canada 2024).
- 2 Statistics Canada assumes that the share of non-permanent residents will reach the federal government’s target of 5 percent by 2027.
- 3 For comparison, we also consider a low-productivity scenario in which real output per working-age person grows at a rate of 0.39 percent – the annual average growth rate of labour productivity (output per hour worked) from 2019 to 2022.
- 4 Tax revenues are taxes on income, production and products.
- 5 In a market setting, this approach would be equivalent to assuming that the volume of services delivered per person in healthcare (and in education, for which we use a similar approach) rises at the same rate as the volume of goods and services enjoyed per person in the total economy. We make no such assumption: publicly funded healthcare is delivered free at the point of consumption, so we have no price with which to judge consumer satisfaction. Our approach does match the standard assumptions in national income and expenditure accounting in which measures of activity in unpriced services such as healthcare and education tend to reflect input costs.
- 6 For comparison, we also consider a scenario in which prices in healthcare rise with prices in the economy generally.
- 7 These projections include the recent increase in OAS benefits for people 75 and older.
- 8 It is worth stressing here that, like all our projections, this one presumes no changes in policy: to the extent that governments increase the real value of their transfers to seniors, these projections understate their exposure to these expenses.
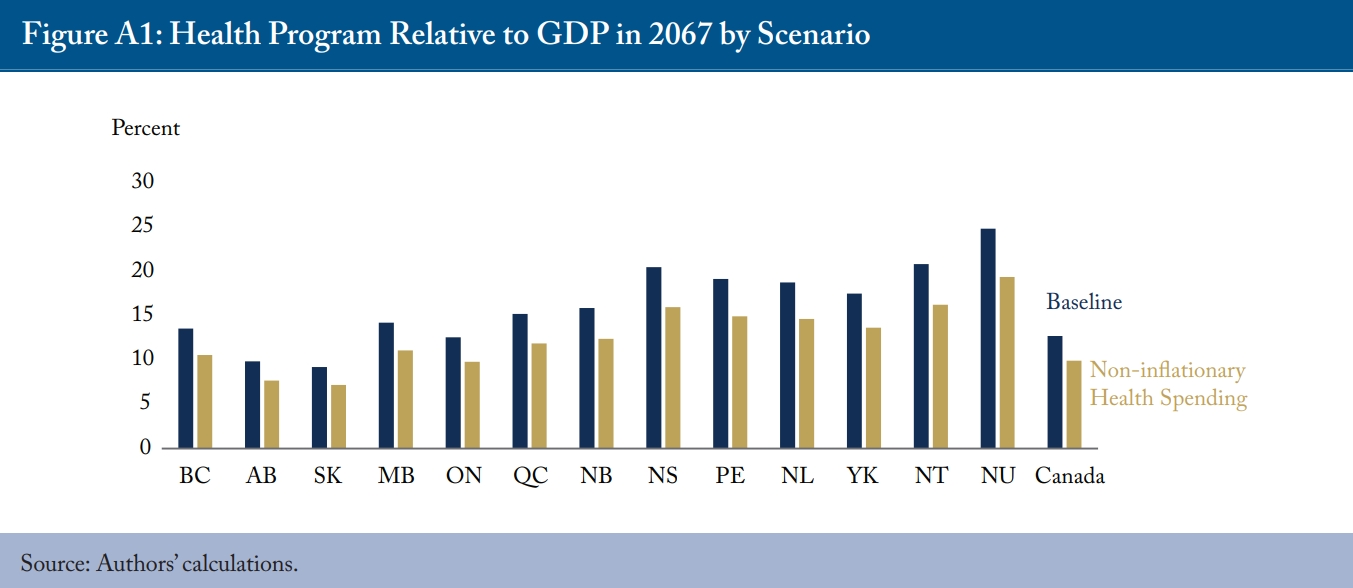
- 9 Restraining the growth of healthcare spending to the economy-wide inflation rate helps reduce healthcare costs by two-to-five percentage points across the country by the end of the projection period, with a greater impact on regions more sensitive to aging (see Appendix, Figure A1).
- 10 We do not attempt to project federal programs for Indigenous people due to the complexity of linking them to the Indigenous population and distributing them across their age groups. We note, however, that spending by the federal department of Indigenous Services Canada was $24 billion in 2023 and spending by the department of Crown-Indigenous Relations and Northern Affairs Canada was $27 billion that year. Together, these departments spent about $25,000 per Indigenous person in 2023, up one-third from the year before. If per-person federal continues to escalate at that rate, relatively rapid growth in the Indigenous population would create a substantial implicit liability for Ottawa.
- 11 The parallel with explicit liabilities is straightforward. Suppose a province decided to fund higher program costs by borrowing rather than by raising its aggregate tax rate. The implicit liability would, over time, become higher public debt.
- 12 The median age of Canadians in 2019 was about 41 years and the life expectancy of 41-year-olds was 42.4 years according to the 2015-2017 life tables (Statistics Canada Tables 17-10-0005-01 and 13-10-0114-01). We round up to 45 years to allow for possible dynamic improvements in life expectancy.
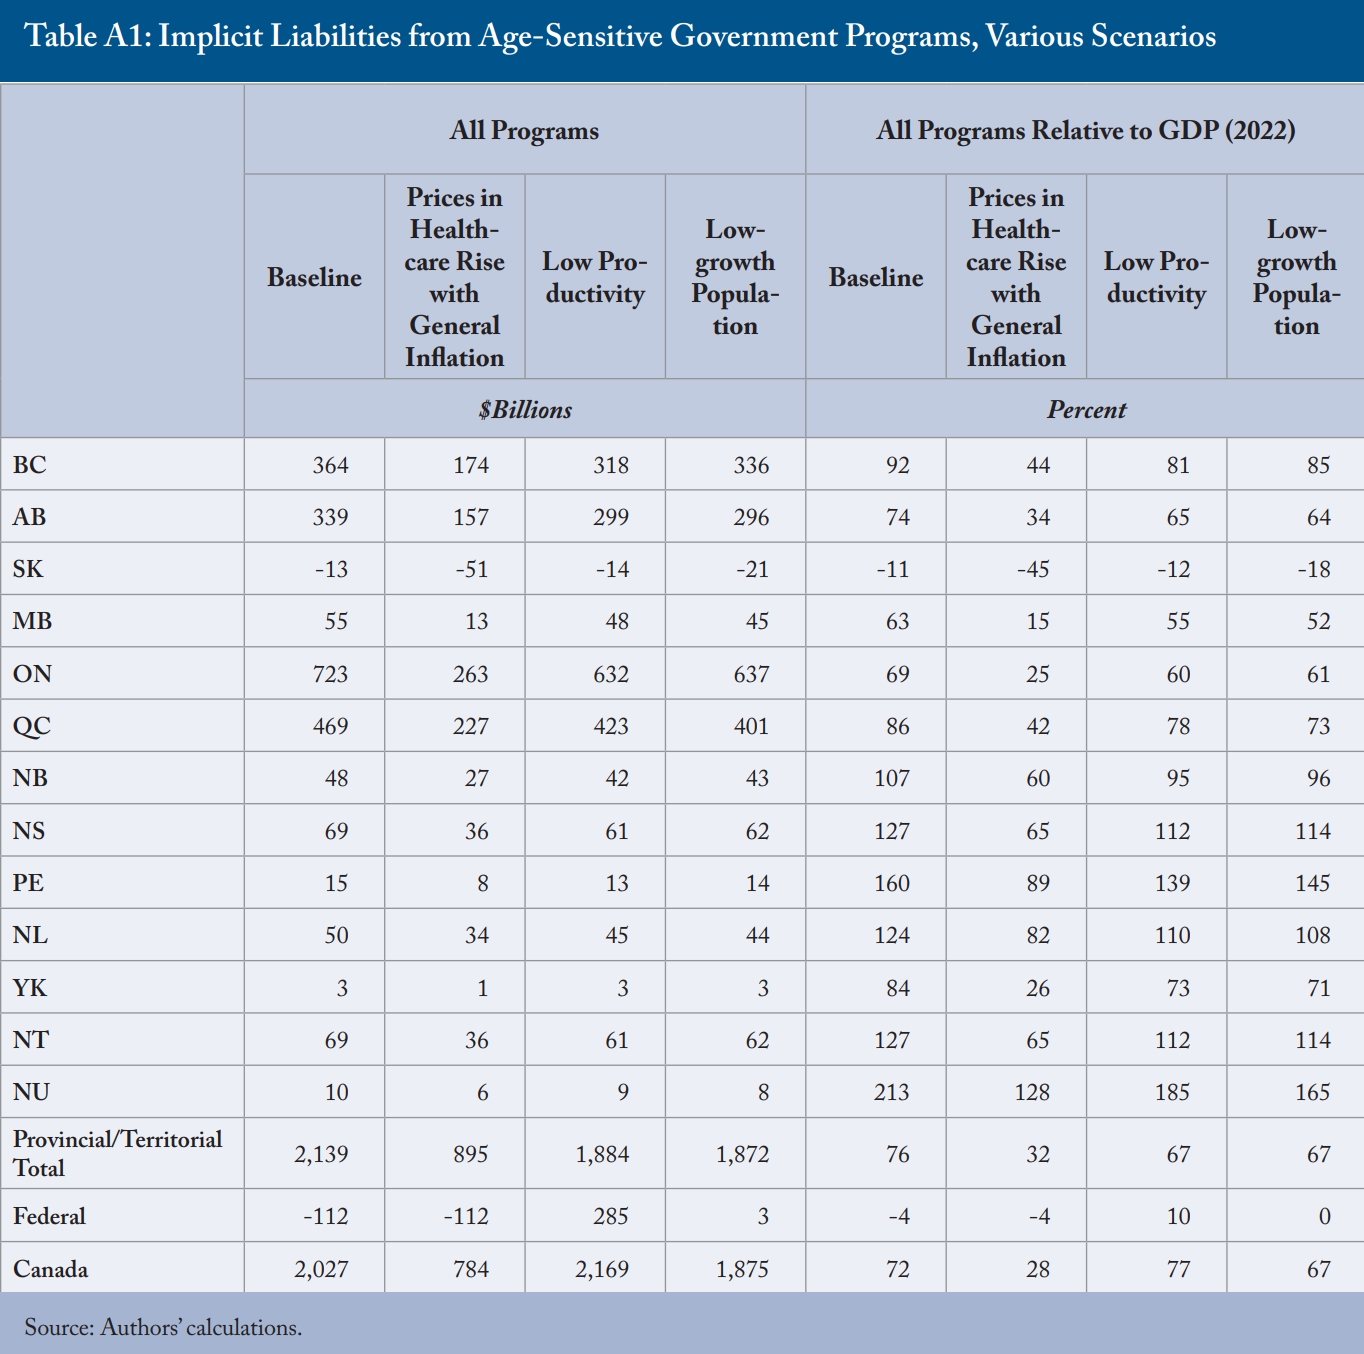
- 13 These figures are sensitive to the scenarios’ assumptions. The results are slightly more favourable when considering a low-growth scenario with immigration rates resembling pre-pandemic levels or a low-productivity scenario compared to the baseline scenario. The favourable results are notable in a scenario in which healthcare prices rise with general inflation for all provinces and territories, highlighting the need to restrain healthcare costs in light of population aging (see Appendix Table A1).
- 14 Population projections indicate that while high immigration can mitigate demographic aging, it does not reverse it since immigrants also age. In a high-growth scenario, the senior population will continue to grow, albeit more slowly, particularly between the mid-2030s and 2040s. However, recent population growth has largely resulted from temporary immigration, and the government’s commitment to reducing the number of temporary residents could accelerate the aging process.
- 15 See Laurin and Robson (2015) on federal-provincial transfers and Robson (2001) on establishing a federal seniors’ healthcare grant.
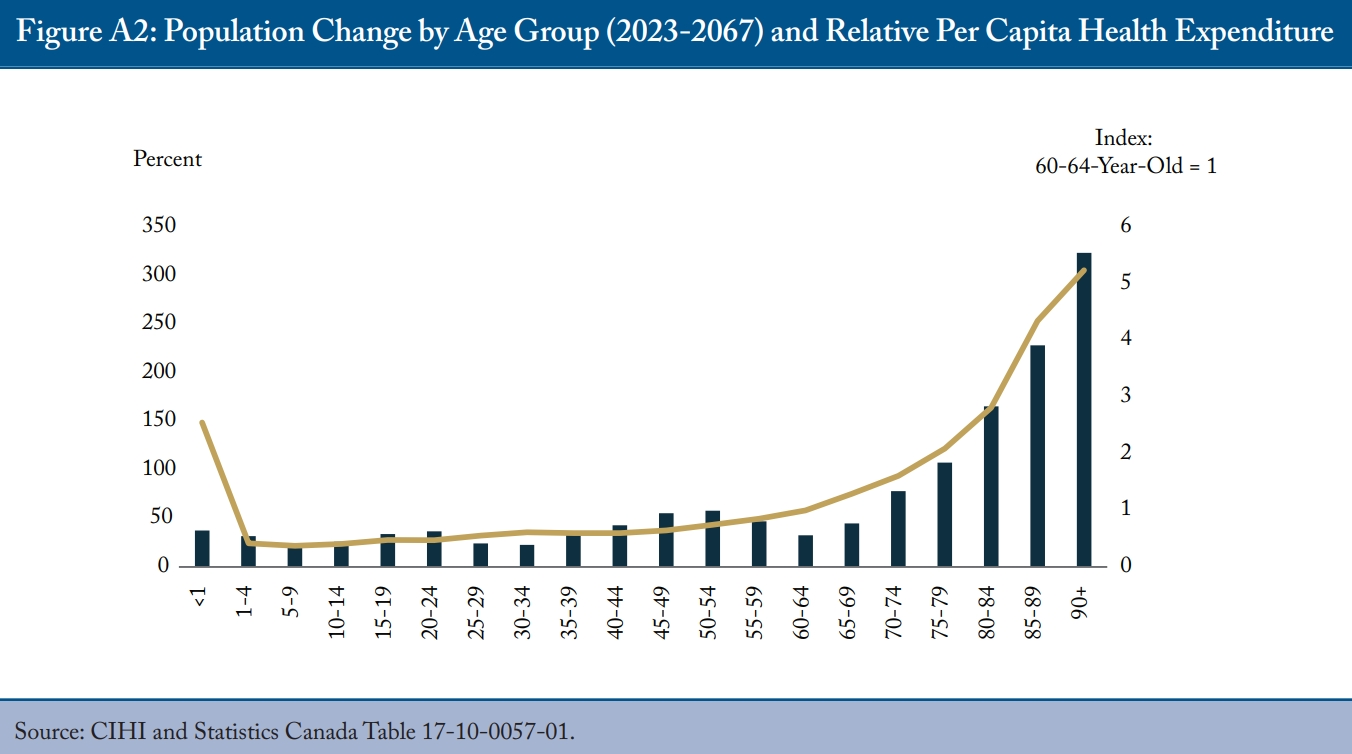
- 16 It is worth mentioning that the pressure on healthcare spending due to aging is increasingly exacerbated by substantial population growth and escalating per capita healthcare spending among older seniors as they age (see Appendix Figure A2).
- 17 Although Quebec’s Generations Fund is, conceptually, a mechanism to redress intergenerational imbalance, it does not link contributions and payouts as a social-security-style fund would do. Busby and Robson (2011) explore some healthcare prefunding possibilities and their mechanics in an Ontario context.