Study in Brief
- With the Bank of Canada engaging in both conventional and unconventional monetary policy, the difference between the Bank of Canada’s policy rate and the neutral rate when the economy is at potential and inflation is on target is no longer sufficient in determining whether – and to what degree – monetary policy is stimulative or restrictive.
- In this paper, we propose a novel approach, distinguishing between short-term and long-term real (inflation-adjusted) neutral rates of interest. In doing so, we create a real neutral rate yield curve for Canada – a first of its kind – to compare against the policy rate and interest rates across different maturities.
- Our real neutral rate yield curve produces four key results: 1) real neutral rates across the yield curve have dropped over the 30 years since the Bank of Canada began targeting inflation; 2) the gap between the long and short end of the curve (its slope) has shrunk as well; 3) the difference between short-end neutral rates and actual rates in the economy over our timeframe is consistent with prevailing narratives, e.g., that monetary policy was loose after the financial crisis as central bankers struggled to hit their inflation targets from below, and that, using our most recent data, monetary policy at the short end is neither tight nor loose – though with interest rates higher than pre-COVID, cyclical factors will cause the neutral rate to fall, leaving room for the Bank of Canada to continue to cut; and 4) the gap between our long neutral and long actual rates has been more cyclical in pattern following the financial crisis, indicative of a central bank making greater use of unconventional monetary policy.
The real neutral rate yield curve will be available and updated every quarter as part of the C.D. Howe Institute’s Toolkit of Economic Indicators.
The authors thank Gherardo Gennaro Caracciolo, William B.P. Robson, Mawakina Bafale, Steve Ambler, Pierre Duguay, Paul Jenkins, David Laidler, John Murray and several anonymous reviewers for helpful comments on an earlier draft. The authors retain responsibility for any errors and the views expressed.
Introduction
The neutral rate of interest, the interest rate that would prevail with an economy operating at potential and inflation at target, is an important concept for central bankers and economic forecasters. The spread between actual interest rates and the neutral rate tells these groups where, absent big disruptions to the economy, interest rates are likely headed over a longer period of time. Beyond the central banking community, it also matters for fiscal sustainability and the determination of appropriate discount rates to use for pensions and other future obligations.
Debates around the “neutral rate” often focus on a single rate (see, for example, Holston et al. 2017, Kiley 2020).1 However, there is more than one neutral rate, and it is important to distinguish between them and their implications. In particular, for policy, we need to understand neutral rates of interest across a typical yield curve of maturities, and compare them with actual rates over similar terms. By doing so, we create a more complete picture of a central bank’s monetary policy stance. This paper does just that, creating the first real neutral rate yield curve for Canada.
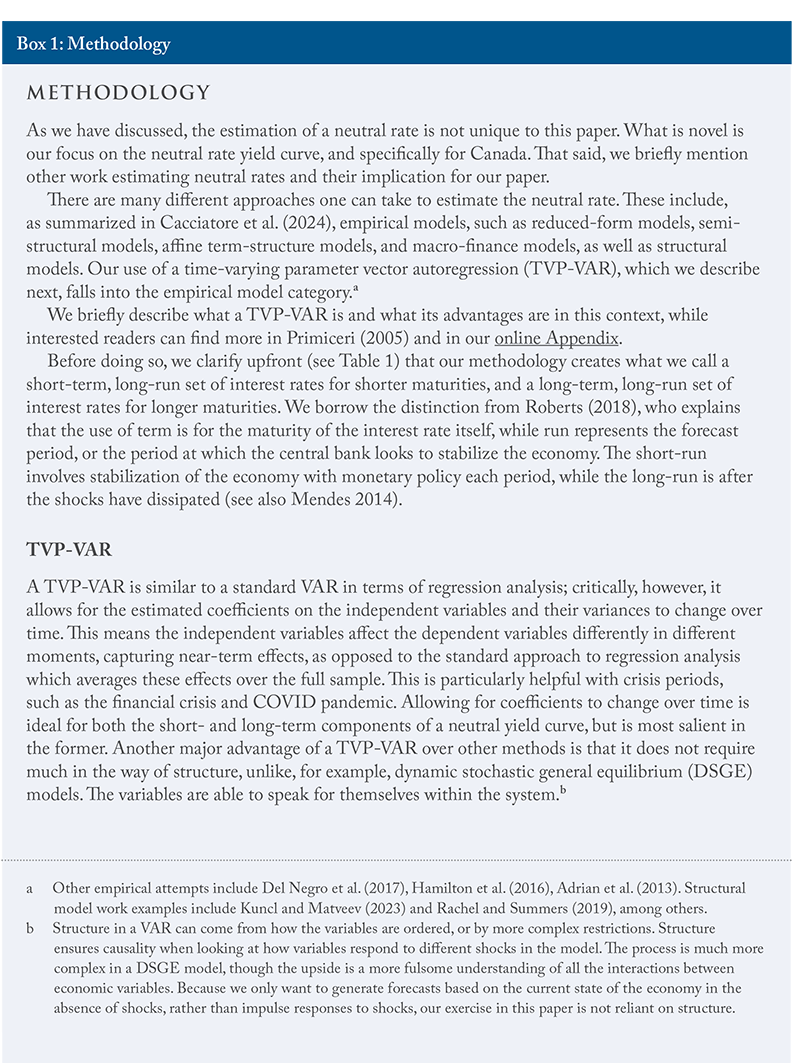
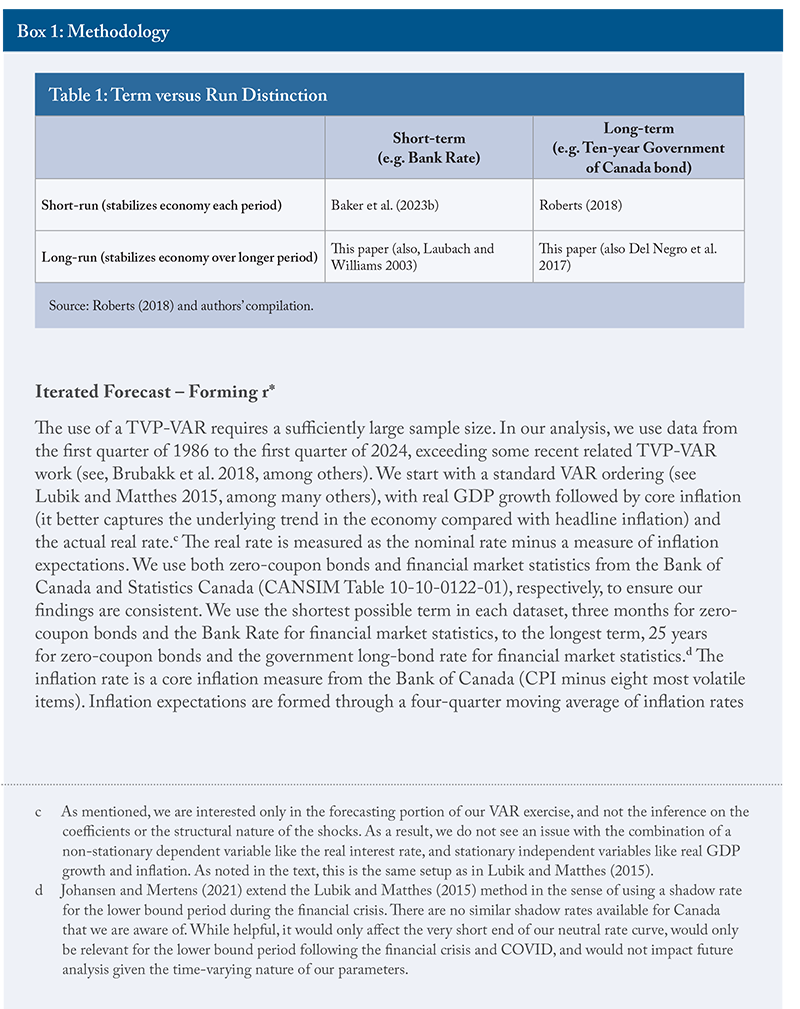
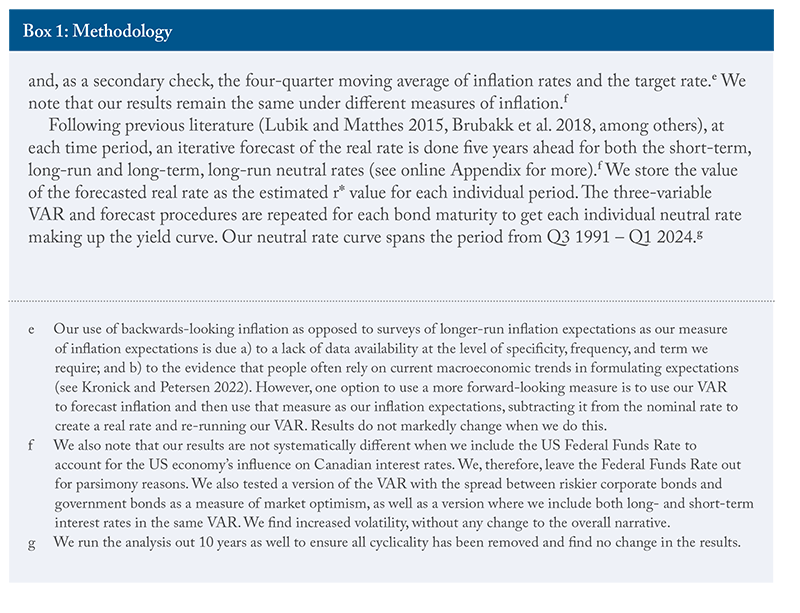
For the purposes of this paper, term represents the maturity of our interest rate, e.g., 3-month Treasury bills or 10-year Government of Canada bonds, while run represents the period over which the economy stabilizes. In the case of our neutral rates, this is the long run.2 We, therefore, look at short-term, long-run neutral rates and long-term, long-run neutral rates to make up the real neutral rate yield curve.
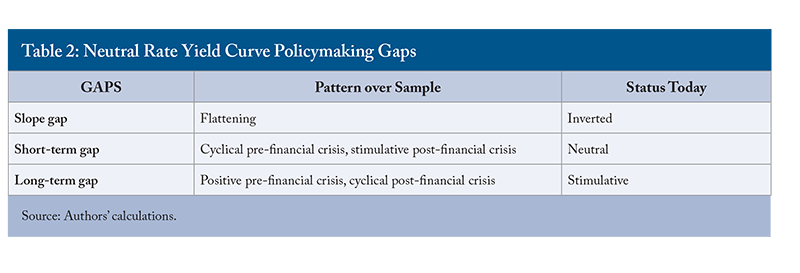
In this paper, we describe three important gaps for policymaking that the creation of a neutral rate yield curve addresses: the short-term gap, long-term gap, and slope gap. We discuss each in turn.
The short-term neutral rate, while still a long-run concept, also captures the state of current economic conditions. The difference between it and a short-term actual rate determines how stimulative or restrictive conventional monetary policy is at a moment in time. This is the short-term gap. As a simple example, if the central bank’s policy rate is 5 percent and the short-term neutral rate is 3 percent (a restrictive environment meant to close a positive output gap, i.e., bring overheated demand back into balance with supply), that gap of 2 percent provides tighter monetary conditions than if the short-term neutral rate was 3.5 percent, where the gap, then, is only 1.5 percent.
Typically, and to some degree, the short-term neutral rate moves up and down with the business cycle. As economic conditions improve there are more investment opportunities, pushing up the investment curve and the neutral rate with it. Additionally, spending typically increases and saving commensurately falls. The reverse is true when economic conditions worsen and the neutral rate falls.
When central banks hike the overnight rate, spending slows and saving increases, the latter of which also drives down the neutral rate. This creates a bigger gap between the neutral rate and the higher policy rate, making for even more restrictive monetary policy.
The long-term neutral rate is relevant to a situation in which the economy is operating at its long-run potential, with inflation at target. To make this determination, we need to understand the structural factors that are likely driving savings and investment decisions over a longer period (see, for example, Beaudry 2023). These include things such as aging, globalization trends, and a country’s productivity, to name but a few. The central bank has little to no control over these trends.
Beginning in many ways with the financial crisis, and expanding markedly during COVID, central bankers have attempted to influence longer-term maturities with quantitative easing – buying up government bonds to drive down rates – and forward guidance – e.g., speeches that suggest where the central bank sees the economy, and therefore rates, going in the future. As a result, the gap today between long actual rates and long neutral rates can also be thought of as an additional measure of how tight or loose monetary policy is.3 This is the long-term gap.
Finally, we have the slope gap – the difference between short and long real neutral rates or, in other words, the slope of the real neutral rate yield curve. The slope of the actual yield curve is typically upward as investors demand higher interest rates to hold debt for a longer period of time. It is also a sign of optimism as investors prefer holding riskier assets, driving down the price of bonds and driving the yields up. When it is inverted, it tends to represent market pessimism, as investors are willing to hold lower-yielding debt.
This optimism/pessimism distinction also applies to the slope of the real neutral yield curve. Specifically, the slope represents the difference between a) the intersection of savings and investment with only structural factors driving these two curves (i.e., the long part of the curve), and b) this same intersection where, now, current cyclical factors operate alongside structural factors in generating the equilibrium (the short part of the curve). A flattening or inverted slope is a sign of potential pessimism in the economy’s future.
It also represents a critical characteristic in understanding monetary policy’s current stance. It is entirely plausible to have a scenario where the central bank’s overnight rate sits below a short-term neutral rate while long-term interest rates sit above their long-term neutral counterparts. This could occur, for example, if we have an upward-sloping actual yield curve and a flatter neutral yield curve. Focusing on only the overnight rate’s relative stance would then make it seem as if the central bank was engaging in loose monetary policy when, in fact, this may be true at the short end of the curve but the opposite is true (it is tight) at the long end of the curve.
The implication is that a complete picture of the central bank’s current monetary policy stance can only be created by evaluating all three of the gaps we introduce here.
In creating the neutral rates across the yield curve – which we do using a time-varying parameter vector autoregression (TVP-VAR)4 – we forecast out over a five-year period, meaning, as discussed, both our short-term and long-term neutral rates are stabilized over the long run.
Our neutral rate yield curve – estimated from Q3 1991 to Q1 2024 – has many of the characteristics one would expect:
- For the most part, the curve slopes upward, with periods of inversion coinciding with past crises, e.g., the 2015 oil price shock.
- Both the short and long ends of the curve trended downward over the last 30 years, consistent with a period of falling interest rates.5
- We see more volatility at the short end of the yield curve rather than the long end, as one would expect with its more cyclical nature.
- We also see the long end falling more than the short end as structural factors – which affect both ends but are the only source of movement at the long end – have dominated the long end, while cyclical factors have at times offset these structural factors in the short end.
From a policymaking perspective, historically speaking, the short end of our neutral yield curve suggests the Bank of Canada’s monetary policy was loose in the lead-up to the financial crisis, as was the case at other central banks – indeed, too loose for some (see Taylor 2011). It was also loose for much of the period from the financial crisis until the COVID pandemic, consistent with a central bank trying to bring inflation up to target. Using our most recent data, monetary policy at the short end appears to be right in line with neutral, though with interest rates still elevated relative to pre-COVID, savings will likely increase, pushing the neutral rate down and giving the Bank scope to continue cutting.
Before the financial crisis and the beginning of unconventional monetary policy, long-term actual rates often exceeded long-term neutral rates. This may have been the result of a falling interest rate environment and markets adjusting to that new normal. After the financial crisis and into the COVID period, as monetary policy got more involved with influencing the longer end of the curve, we see a more cyclical nature to the gap between actual and neutral rates. Again using our most recent data, with actual rates sitting below their neutral rate equivalent, monetary policy appears stimulative at the longer end of the curve.
A Neutral Rate Across the Yield Curve
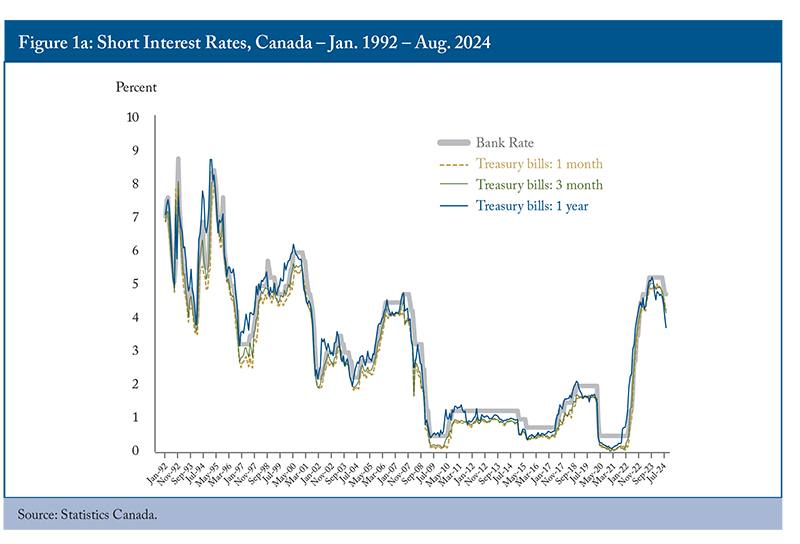
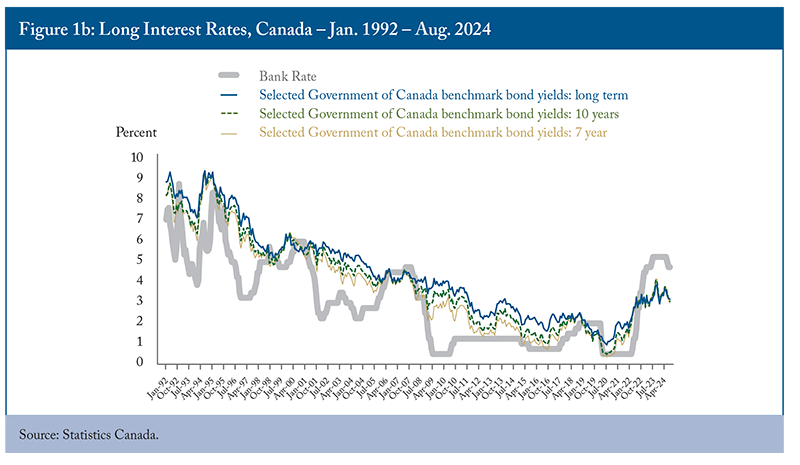
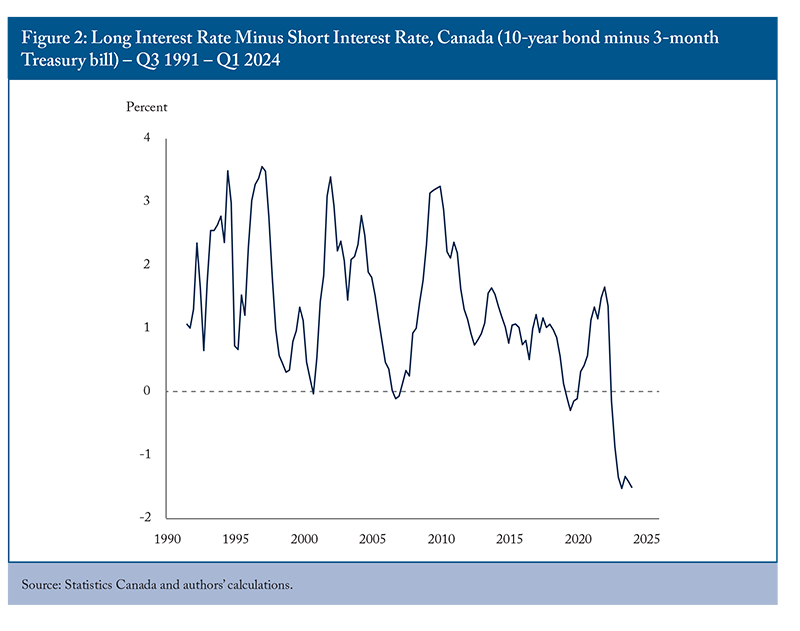
The distinction between short- and long-term rates of interest is important. Figures 1a and 1b show evidence that the direction of interest rates, both at the short and long end, trended downward for much of the 30 years after the Bank of Canada began targeting inflation in 1992. This result reflects falling inflation at the short end and different structural factors at the long end, including an aging population that increased savings in advance of retirement. Despite the similarity in their direction, there are notable differences reflecting the characteristics of different interest rate maturities. In particular, the short end of the curve is more cyclical and stays closer to the Bank Rate, whereas the long end of the curve can keep longer-term considerations at the forefront. Moreover, as we see in Figure 2 which looks at the difference between the long and short ends of the yield curve (using 10-year bonds and 3-month Treasury bills), we can see the long end has fallen more than the short end over this period.
Much of the literature looking at neutral rates has focused on one rate, e.g., Holston et al. 2017, Champagne et al. 2023, among others. The only paper we are aware of that creates a neutral rate yield curve comes from the Bank of Japan and is done for Japan (Imakubo et al. 2023). Creating one for Canada is a novel venture.
There has been other important work on short versus long neutral rates, though it has stopped short of creating a yield curve. Special note should be paid to Baker et al. (2023a and b), as it provides evidence with respect to the COVID period and the situation today.
As described above, as central banks increase the overnight rate, and other interest rates increase, the neutral rate normally falls as people save more and invest less, and this spread makes for an even tighter environment. However, with respect to the current tightening cycle, there is evidence in both Canada and the United States that, if anything, the short-term neutral rate has increased during this time, making the job of the Bank of Canada and Federal Reserve more difficult.
Baker et al. (2023a) show that financial conditions in the United States, in particular corporate spreads, are the primary driver of higher short-term neutral rates. Normally, as central bank policy rates increase, saving in safe assets like government bonds increases, driving up their price and driving down their yield. Also, with economic conditions worsening, the spread investors demand on riskier assets widens. This time around, Baker et al. show that the spreads have been resilient, keeping investment in riskier assets high, leaving the neutral rate elevated.
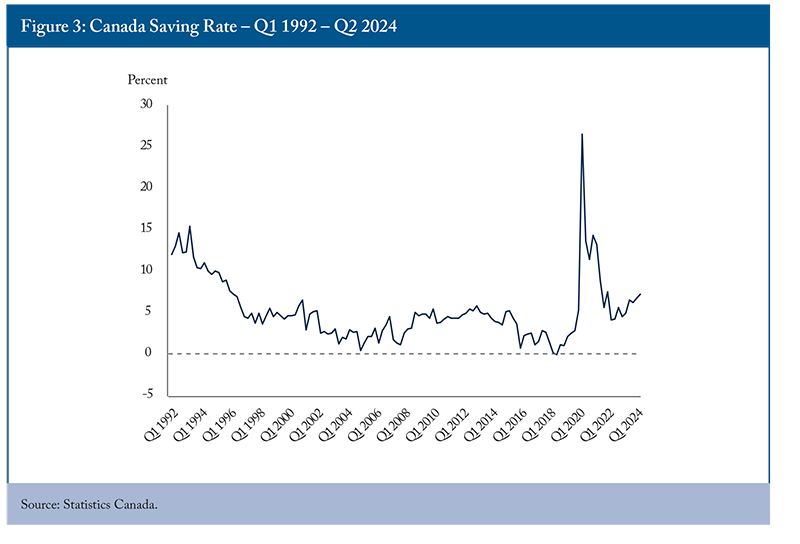
There is no similar analysis for Canada that we are aware of, but saving rates were relatively flat instead of increasing during the first 15 months of the Bank’s tightening cycle – from Q2 2022 to Q2 2023 (Figure 3). One potential explanation is that due to the massive amount of government transfers acquired during the pandemic, consumers did not need to save as much to meet higher interest payments and/or were less enticed by higher interest rates in savings accounts. Savings totaled $528 billion over the four years from 2015-2019, a number exceeded in just two quarters in Q2 and Q3 2020. This left ample room to continue to spend and invest, including in riskier assets, during the tightening cycle.6
A different paper by the same authors, Baker et al. (2023b), models the US long-term neutral rate over time, and concludes that alternative methods produce opposing conclusions on the direction of the current long-term neutral rate relative to where it has been since the beginning of the pandemic. The explanation appears to be that, in certain models, information from the short-term r* (neutral rate) is factored into the long-term r*, whereas this is not the case in others. The effect of this divergence is exacerbated during the COVID period, consistent with our discussion above about the unique properties of this period on the short-term r*.
Again, at the time of publication, no similar analysis has been done for Canada; but we can hypothesize the direction of the long-term neutral rate by looking at the structural trends present over the three decades that preceded the pandemic, and whether those are changing or are set to change.
Neutral rates and, indeed, interest rates globally were falling for much of the period between the beginning of the Great Moderation (known for its relatively smooth economic cycles) in the mid-1980s and the pandemic (we saw this above in Figures 1a and b for Canada). A few different structural factors drove this fall. First, globalization. As more countries liberalized their economies, most notably China, goods became cheaper, driving down inflation and interest rates. Moreover, China was a massive saver, creating a glut of global savings, further driving down rates (see, for example, Bernanke 2005).
Globalization, and the merits of free trade, have been under immense pressure in countries all over the world over the last handful of years. Should this pressure lead to more protectionist policies, we will see a reversal of the disinflation and lower interest rate trends that characterized much of the last 30 years. Additionally, the Chinese economy has been stalling of late, and its labour force shrinking, as the older population retires and draws down its savings (see Goodhart and Pradham 2020, as an example). As a result, the global saving rate could fall, given China’s influence, driving up interest rates.
In Canada, something similar is happening. During the Great Moderation to pandemic era, saving increased as more Canadians prepared for retirement than ever before (the babyboom generation). That large cohort is now retiring in droves, driving up Canada’s old age dependency ratio (the number of those above 65 divided by the working age population; see Kronick and Ambler 2019). These retirees, like the Chinese, are drawing down their savings to fund their retirement lifestyles. As a result longer-term neutral rates in Canada should increase as we look ahead.
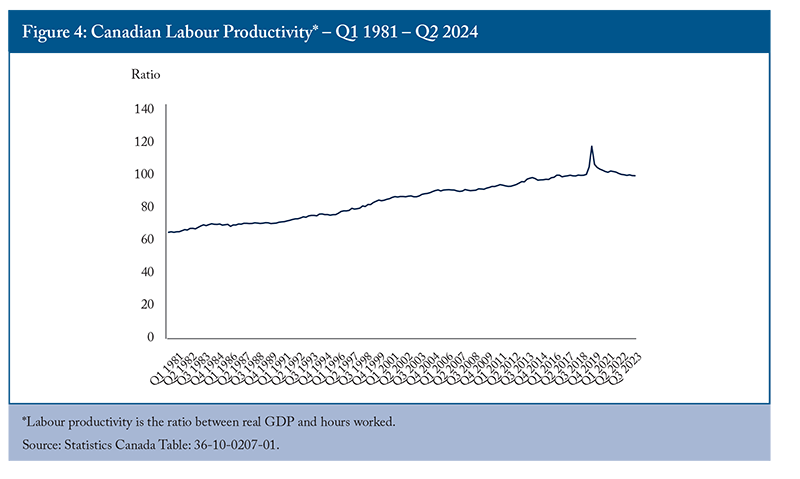
On the investment side, Canada has experienced years of poor productivity, with today’s level the worst it has been since 2018 (see Figure 4). There are a number of explanations. To name a few: i) policies that encourage lending to fund mortgages, which does very little to increase productivity; ii) competition for our talent from the US; and iii) internal trade barriers. Each of these explanations on their own decreases investment opportunities, driving down prevailing interest rates.7
With Canada’s poor productivity record a hot topic (see Eichenbaum, Alexopoulos, and Kronick 2024, Rogers 2024, Coyne 2023 and Plant 2023, among others), one can envision more policies that will look to reverse this trend. If successful, investment opportunities will increase, driving up the long-term neutral rate alongside.
Lastly, we note that, reflecting a small open economy in a world of relatively free capital mobility, Canada’s neutral rates across the yield curve will be influenced not only by domestic factors but by global factors as well.8 These global factors will influence both global neutral rates and Canada’s neutral rates.
The takeaways are, therefore:
- There are differences between what drives interest rates at the short and long end of the yield curve;
- This will be true of both actual interest rates and neutral rates;
- These drivers can change over time; and
- With this in mind, understanding gaps between short and long neutral rates, short actual and short neutral rates, and long actual and long neutral rates is important for central bankers as they consider monetary policy options.
We turn now to our methodology to generate a real neutral rate yield curve for Canada, and what the results tell policymakers – in particular the central bank – about past policy, where things stand today, and what it means as we look ahead.
Results
We acknowledge at the outset that the specific results for any neutral estimate, in particular in real time, depend on the methodology one employs (Cacciatore et al. 2024). The Bank of Canada for its part, when it publishes its ongoing assessments of the neutral rate, looks at a series of models – both empirical and structural – to minimize these variances. In its most recent paper on this topic (Adjalala et al. 2024), its range for the nominal neutral rate, based on five different models, was between 2.25 and 3.25 percent. As this paper is a first attempt at moving beyond a single estimate for the neutral rate, we focus on our one methodology and attach confidence intervals to our estimates.
We are interested in analyzing three gaps. First, the slope gap between the long-term neutral rate and the short-term neutral rate. This will give us an indication of how the slope of the neutral yield curve has changed over time, and how that affects the central bank’s overall monetary policy stance when compared against the actual yield curve. Second, the short-term gap between actual short-term rates, in particular the Bank Rate, and short-term neutral rates. This information tells us how tight or loose conventional monetary policy is at a moment in time. Lastly, the long-term gap between long-term actual rates and long-term neutral rates. At a time when central banks now implement unconventional monetary policy – quantitative easing, forward guidance, more communication in general – the gap also reflects the impact monetary policy has in pushing longer-term rates in the direction it wishes, and can be interpreted as tight or loose monetary policy.
As described in the methodology section, we run our TVP-VAR on two different sets of interest rate data: zero-coupon bond data published by the Bank of Canada, and financial market statistics from the Bank of Canada, accessed from Statistics Canada.
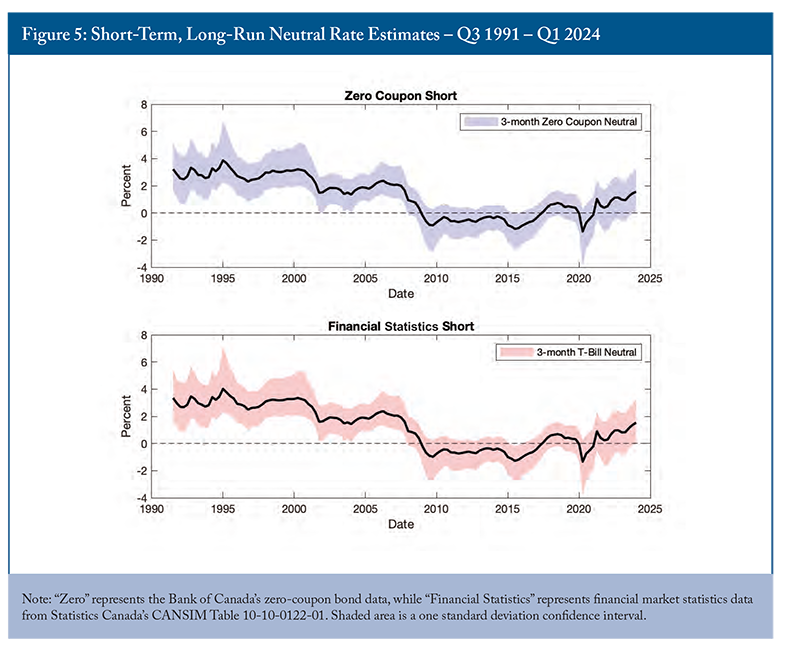
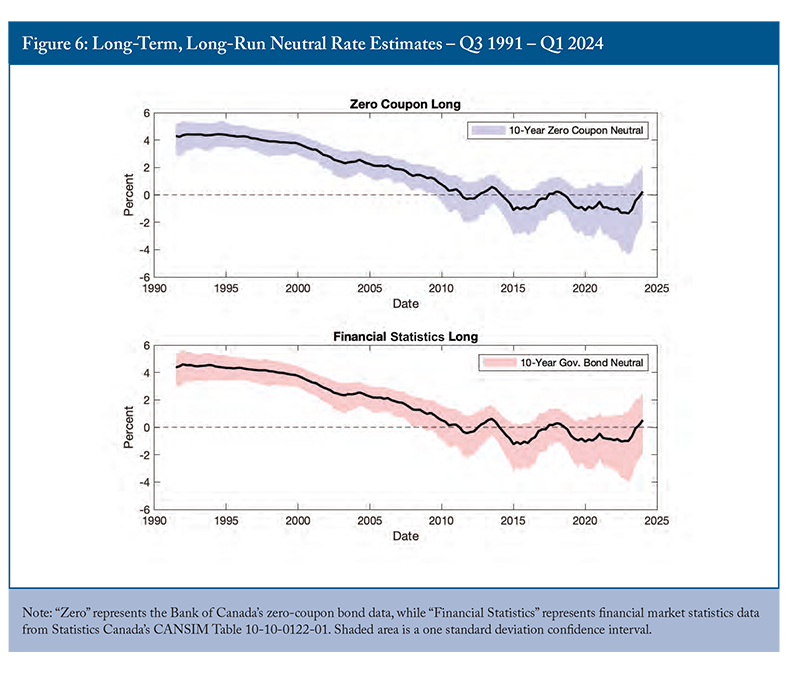
Figures 5 and 6 show our neutral rate estimates over time for a chosen short- and long-term maturity respectively using both sets of data. In Figure 5 we look at the 3-month maturity, while in Figure 6 we look at the 10-year maturity. In both cases, we include the point estimate as well as one standard deviation confidence intervals.
Undeniably, and regardless of underlying interest rate data, real neutral rates across the yield curve have fallen over the 30 years the Bank of Canada has targeted inflation, consistent with what we saw above for actual rates. It is also consistent with the factors we discussed above: workers saving for retirement; decreased investment opportunities as a result of, for example, policies that encourage lending to fund mortgages, which does very little to increase productivity; and globalization. We note that the path of neutral rates was smoother at longer maturities, which we would expect given the slower-moving structural factors that drive neutral rates further out the yield curve.9
In all instances, real neutral rates hit zero following the financial crisis and have hovered around there since. The long-term, long-run neutral rates have stayed in negative territory since 2020 until this most recent quarter, whereas the short-term, long-run neutral rates turned positive much earlier after COVID hit, and are above the long-term rates today. This inversion highlights the importance of considering the entire neutral rate yield curve when, through a comparison to the actual yield curve, determining the stance of monetary policy.
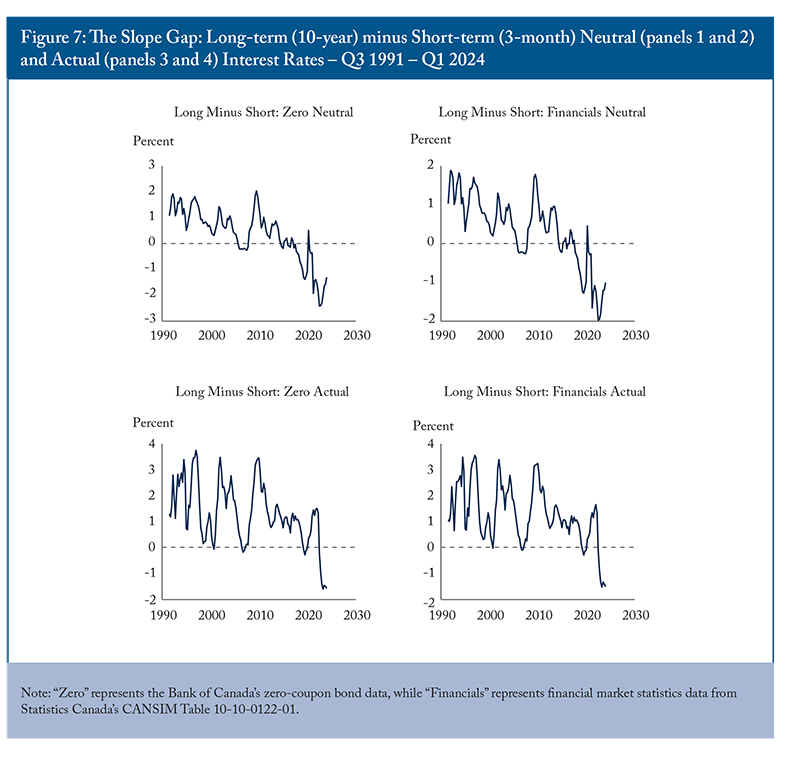
We can see the flattening and inversion of the slope between the short-run and long-run neutral rates over time in Figure 7, panels 1 and 2, which show the results for both the zero-coupon bonds and financial market statistics. We can also compare this slope gap in neutral rate maturities with the same gap in actual maturities (Figure 7, panels 3 and 4, with a similar zero-coupon bond and financial market statistic split).
With both the neutral rate and actual data, we see a clear downward trend in the gap, meaning the spread between long- and short-term maturities is closing over time.
While the short end shrank, the long end of the curve shrank by more. Why might that be the case?
There are likely multiple explanations. One simple one is that as the Bank became an inflation targeter, this reduced inflation variability and, therefore, expectations, which had a greater impact further out the yield curve, reducing the risk premium on longer bonds, and in turn lowering those rates more than shorter-term rates.
Another explanation has to do with different influences on short- versus longer-term rates. There is an effect on the short-term, long-run neutral rate when structural factors change. An overall downward trending set of structural factors will drag down potential output at both the short and long end of the curve. But other factors affect the short-term, long-run neutral rate as well; factors that kept the short end elevated.
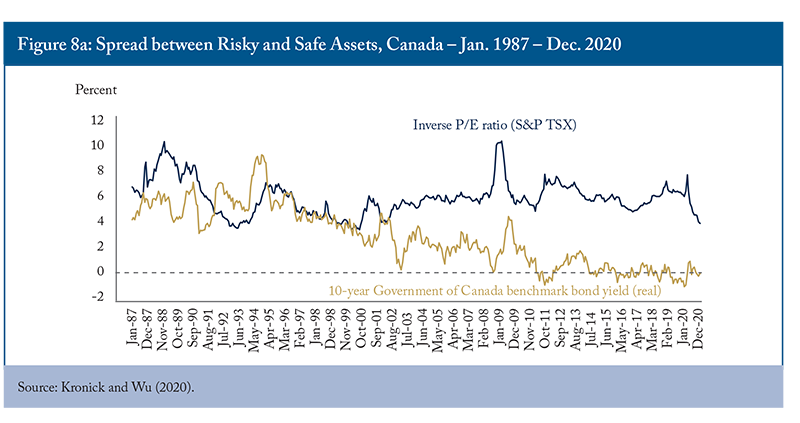
As an example of a particular factor, we earlier discussed work by Baker et al. (2023a), showing that corporate spreads, i.e., between risky and safe assets, have remained resilient (in the sense of not widening) as investors continue to invest in riskier assets during the post-COVID tightening, keeping the short-term neutral rate high. This resilient spread between risky and safe assets, however, has been a phenomenon since the early 2000s in both the United States and Canada (see Caballero, Farhi, and Gourinchas 2017 and Bailliu, Kronick and Wu 2023, the source for Figure 8a below showing Canada’s spread10). The argument pre-COVID was that there was a safe asset shortage whereby, as interest rates got stuck at the lower bound, increased demand for government bonds could not be accommodated through falling interest rates. This created excess demand for this instrument, leading to a consistently higher premium required on risky assets. This was the case even before the financial crisis as real interest rates began to touch zero.
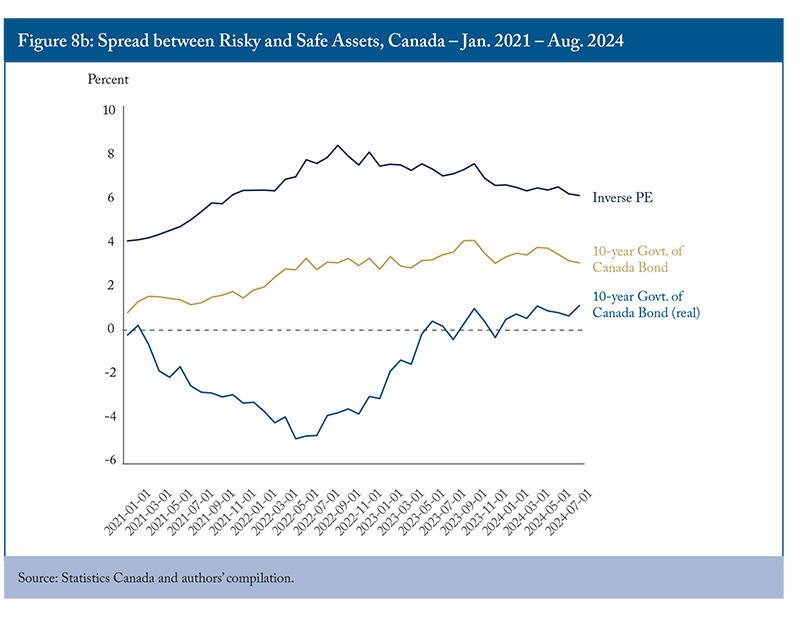
When looking at real bonds, the spread widens after COVID (Figure 8b) in Canada as inflation took off and the Bank starts tightening (this is represented by the difference between the top and bottom lines, which correspond to the blue (top) and gold (bottom) lines in Figure 8a). However, when we look at nominal bonds, the spread remains consistent (the difference between blue (top) and gold (middle) lines in Figure 8b).
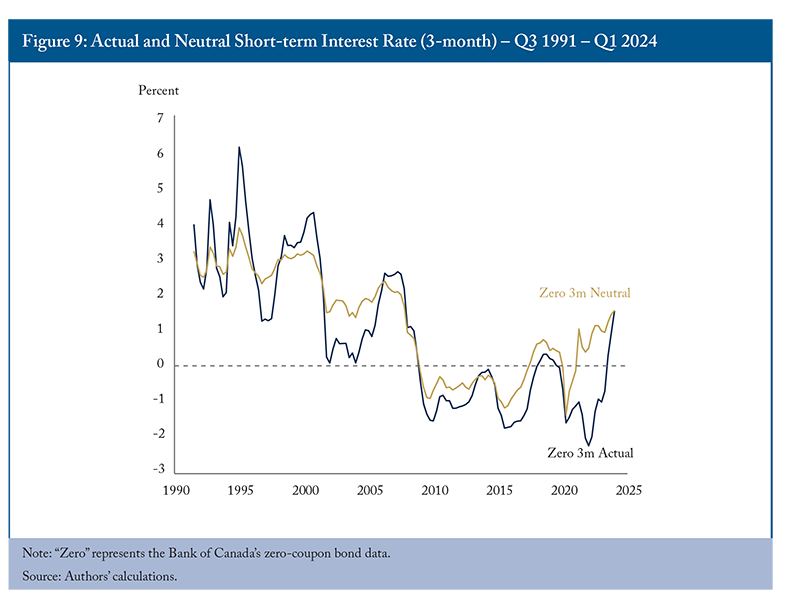
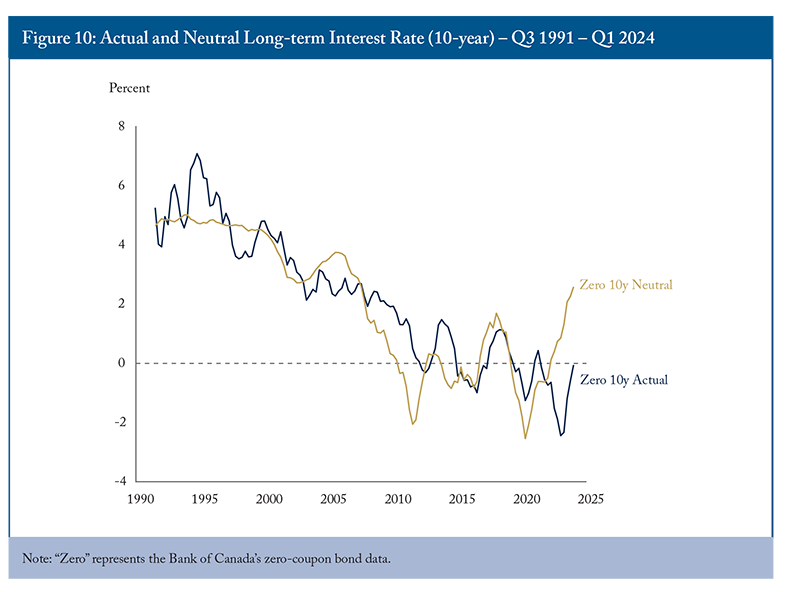
Our final two gaps look at the difference between our short and long neutral rates and their counterpart actual short and long rates. Figures 9 and 10 provide a specific example of actual real short rates compared with neutral real short rates, and actual real long rates compared with neutral real long rates.11 As before, we choose as a specific example the 3-month actual rate compared with the 3-month neutral rate (zero coupon bond), and the 10-year actual rate (zero coupon bond) compared with the 10-year neutral rate. Figure 11 takes the difference between actual and neutral rates at both the short and long end using the same maturities, with panels 1 and 2 showing the results for short rates using zero coupon bonds and financial market statistics respectively, and panels 3 and 4 providing the same breakdown for long rates.
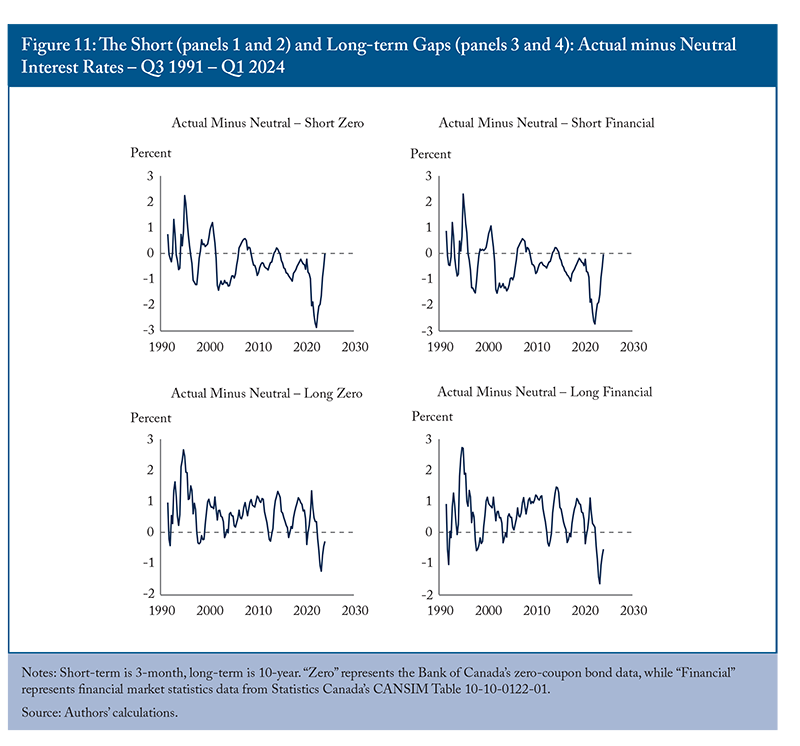
At the short end of the yield curve, the short-term gap pre-financial crisis is fairly volatile, bouncing back and forth around zero, indicating a balance of tight (above zero) and loose (below zero) monetary policy (Figure 11). The cyclicality is consistent with prevailing narratives; for example, the narrative of loose monetary policy in the lead up to the financial crisis. By contrast, for the period between the financial crisis and COVID, monetary policy was, on average, loose. This is what we would expect with a central bank trying to hit the inflation target from below, as was often the case. During the COVID period, monetary policy was quite loose as the economy was shut down, and perhaps stayed loose for too long, as we now know. Of late, as the central bank has tightened, this has reversed to the point where, today, monetary policy appears to be back at neutral. As higher interest rates relative to the past continue to bite, the neutral rate will likely shrink as saving continues to increase – in part because government transfers have been spent, as we discussed above – which will give the Bank space to continue to cut.
At the longer end of the yield curve, before the financial crisis the long-term gap was largely positive, which can be interpreted in different ways. One could argue markets were by and large optimistic in relation to what the structural factors were suggesting about the long-run state of the Canadian economy. Additionally, markets were adjusting to an environment of falling interest rates. After the financial crisis, we see a more cyclical pattern to this gap (seen more clearly in Figure 10) as the Bank of Canada engaged in more unconventional monetary policy, first using forward guidance (and communications more generally) and then, when COVID hit, using quantitative easing. The looseness we saw when COVID hit has not entirely disappeared at the long end of the curve (seen more clearly in Figure 11).
Lastly, we provide specific examples of notable periods where we can see the gap between our neutral rates (using zero coupon bonds) and the actual rates across the yield curve, and determine whether the results are consistent with what one might expect. In 1998 (1998Q2 in Figure 12), there were a series of international crises – the Asian crisis and Long-Term Capital Management crisis – and, while Canada did not experience a recession, there was economic turmoil abroad which affected the domestic economy. Comparing actual rates to our neutral curve, we see that monetary policy was quite loose at the short end with the Bank trying to stimulate an economy facing a global economic slowdown. With actual long rates below neutral long rates in this pre-financial crisis period, markets were perhaps too pessimistic on the economy’s long-run potential.
In the first quarter of 2001, in the midst of the bursting of the dot-com bubble, rates were quite tight relative to neutral, reflecting the Bank’s perhaps too cautious approach to cutting, which picked up steam in the rest of 2001. The gap closes markedly at the longer end of the curve, though, with actual rates comfortably above neutral, there was still a discrepancy between markets and the long-term potential of the Canadian economy – this time in the opposite direction to 1998.
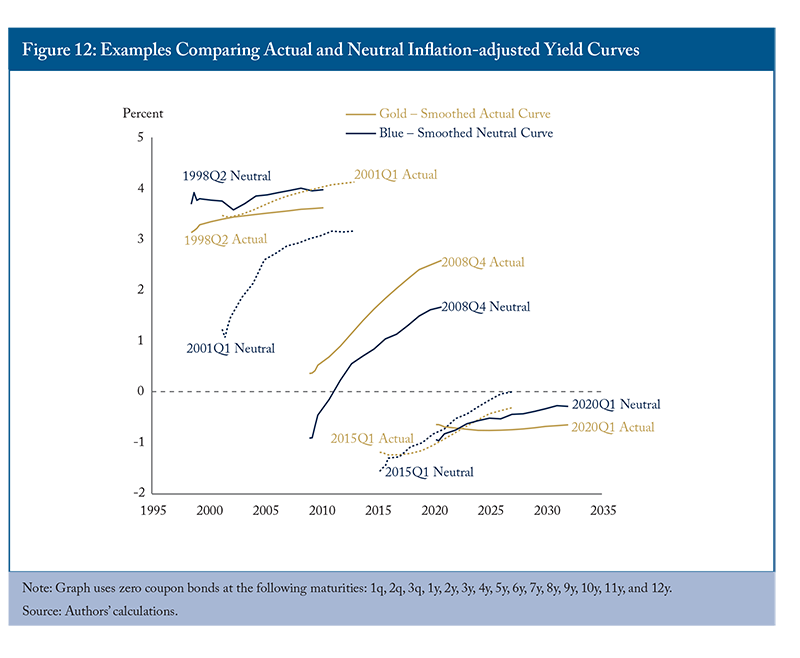
In the financial crisis (2008Q4 in Figure 12), rates were again tight relative to the neutral rate, though the Bank was constrained by the effective lower bound (0.25 percent12). Markets appeared bullish at the prospects of a turnaround over the long term, sitting above the neutral rate despite the Bank’s first foray into forward guidance. The Bank, notably, didn’t engage in quantitative easing during this crisis.
The 2015 oil price collapse is an interesting case. Here, the actual curve was inverted at the short end, crossing through the neutral curve at the two-year maturity term. At the shortest term, monetary policy was tight, explaining why the Bank lowered the overnight rate twice in 2015 (January and July), bringing it closer in line with the neutral rate. To the extent the Bank also wanted to communicate the need for rates to stay low to deal with the oil price shock, they were successful in keeping the rest of the actual yield curve below the neutral curve.
The onset of the COVID pandemic (2020Q1) mirrored the 2015 oil price collapse story: the short end of the curve justifying overnight rate cuts (again constrained by the effective lower bound), an inverted actual curve with a crossover of the two curves at the two-year maturity term, and unconventional monetary policy keeping the longer end of the actual yield curve below the neutral curve.
Policy Discussion and Conclusion
For the Bank of Canada – and for fiscal authorities too – understanding neutral rates allows for an understanding of where interest rates are headed and how stimulative or contractionary current monetary policy is.
Much of the past work in this area has focused on a single neutral rate but, as we argue in this paper, in the same way that the entirety of the actual yield curve matters, so too does the entirety of the neutral yield curve. Short-term, long-run neutral rates tend to vary with both structural factors and current economic conditions, and matter for conventional monetary policy. Long-term, long-run neutral rates are affected more singularly by structural factors, and matter for today’s central banks which use as part of their toolkit unconventional monetary policy to influence interest rates further out the yield curve.
This paper creates the first real neutral rate yield curve for Canada, using an empirical methodology that allows our coefficients to vary over time. Additionally, it is model agnostic. Our estimates allow us to construct three relevant gaps that help refine not only the current stance of monetary policy but also how structural forces are shaping the slope of the neutral yield curve.
The results from the first gap (the slope gap) – between the long end and short end of the neutral yield curve – show that the long portion of the curve has fallen more than the short portion of the curve over the 30 years since the Bank of Canada became an inflation-targeting central bank. In other words, the slope has flattened. We see evidence today that the short end of the curve has turned positive, and did so fairly soon after the COVID crisis hit, while the long end only just saw its first quarter above zero since the pandemic began. These differences in characteristics matter for how we think about monetary policy’s current stance, highlighted by the next two gaps.
The second gap (the short-term gap), between the short end of the real neutral curve and short-term actual real rates, validates existing historical narratives. Monetary policy was indeed on the loose end in advance of the financial crisis, and was loose for much of the period between the financial crisis and COVID pandemic. Moreover, using our most recent data, and consistent with existing conditions, conventional monetary policy looking at the short end of the curve appears back at neutral, and heading towards being too tight. As relatively higher interest rates continue to work their way through the economy, driving up savings, this will push the short-term neutral rate down, providing space for the Bank of Canada to continue cutting the overnight rate.
The final gap (the long-term gap), between long neutral rates and long actual rates, makes clear that monetary policy, as expected, has become more active at the long end of the curve following the financial crisis. As a result, we see a more cyclical pattern than we did before. At our most recent data point, it appears loose (see Table 2 for a summary of the results from the three gaps).
We also looked at specific historical examples exemplifying the problem with assessing a central bank stance based only on the difference between the overnight rate and a singular neutral rate. In 2015, for example, we see somewhat tight monetary policy at the short end, with looser monetary policy at the long end. The Bank did cut the overnight rate twice in 2015, as a result of the oil shock. Without space to cut much further – the overnight rate after the two cuts was 0.5 percent – this could have been interpreted as a problem. However, looking further out the yield curve we see additional looseness, which could allay those concerns.
These results all indicate that it would be prudent for modern central banking to involve the use of the entire yield curve – both actual and neutral – when implementing and evaluating its monetary policy. Not doing so risks interpreting the monetary policy stance as more restrictive or stimulative than it is in reality. We offer the real neutral rate yield curve generated in this paper to provide assistance in this regard.
To cite this document: Kronick, Jeremy, Hashmat Khan, and Matthew Soosalu. 2024. A New Monetary Policy Tool: The Real Neutral Rate Yield Curve for Canada. Commentary 668. Toronto: C.D. Howe Institute.
References
Adjalala, Frida, Felipe Alves, Helene Desgagnes, Wei Dong, Dmitry Matvee and Laure Simon. 2024. “Assessing the US and Canadian neutral rates: 2024 update.” Bank of Canada Staff Analytical Notes. April.
Adrian, Tobias, Richard K. Crump, and Emanuel Moench. 2013. “Pricing the Term Structure with Linear Regressions.” Journal of Financial Economics 110(1): 110ñ138.
Bailliu, Jeannine N., Jeremy Kronick, and Wendy Wu. 2023. “The Global Safe Asset Shortage: Why it Matters for Canada.” Working Paper. Toronto: C.D. Howe Institute. January.
Baker, Katie, Logan Casey, Marco Del Negro, Aidan Gleich, and Ramya Nallamotu. 2023a. “The Evolution of Short-run r* after the Pandemic.” Federal Reserve Bank of New York Liberty Street Economics. August.
Baker, Katie, Logan Casey, Marco Del Negro, Aidan Gleich, and Ramya Nallamotu. 2023b. “The Post- pandemic r*.” Federal Reserve Bank of New York Liberty Street Economics. August.
Bank of Canada. 2024. “Summary of Governing Council deliberations: Fixed announcement date of March 6, 2024.” https://www.bankofcanada.ca/2024/03/summary-governing-council-deliberat….
Beaudry, Paul. 2023. “Economic progress report: Are we entering a new era of higher interest rates?” Remarks to Greater Victoria Chamber of Commerce. June 8.
Bernanke, Ben. 2005. “The Global Saving Glut and the U.S. Current Account Deficit.” Sandridge Lecture, Virginia Association of Economists, Richmond, Virginia. March.
Borio, Claudio. 2024. “In the eye of the beholder.” Remarks at the ECB Forum on Central Banking on “Monetary policy in an era of transformation.” July 3.
Brubakk, Leif, Jon Ellingsen and Ørjan Robstad. 2018. “Estimates of the neutral rate of interest in Norway.” Norges Bank., Technical report, Staff Memo.
Buncic, Daniel. 2020. “Econometric issues with Laubach and Williams’ estimates of the natural rate of interest.” arXiv preprint arXiv:2002.11583.
Caballero, Ricardo J., Emmanuel Farhi, and Pierre-Olivier Gourinchas. 2017. “The Safe Assets Shortage Conundrum.” Journal of Economic Perspectives 31 (3): 29–46. Summer.
Cacciatore, Matteo, Bruno Feunou, and G. Kemal Ozhan. 2024. “The Neutral Interest Rate: Past, Present and Future. A Thematic Review.” Bank of Canada Staff Discussion Paper. April.
Champagne, Julien, Christopher Hajzler, Dmitry Matveev, Harlee Melinchuk, Antoine Poulin-Moore, Galip Kemal Ozhan, Youngmin Park and Temel Taskin. 2023. “Potential output and the neutral rate in Canada: 2023 assessment.” Technical report, Bank of Canada Staff Analytical Note 2023-6. May.
Champagne, Julien, and Rodrigo Sekkel. 2018. “Changes in Monetary Regimes and the Identification of Monetary Policy Shocks: Narrative Evidence from Canada.” Journal of Monetary Economics 99: 72–87.
Christensen, Jens H. E., and Glenn D. Rudebusch. 2019. “A New Normal for Interest Rates? Evidence from Inflation-indexed Debt.” Review of Economics and Statistics 101(5): 933-949.
Coyne, Andrew. 2023. “The shocking collapse in Canadian productivity: in spite of the Liberals’ best efforts, or because of them?” The Globe and Mail. July. https://www.theglobeandmail.com/opinion/article-the-shocking-collapse-i….
Del Negro, Marco, and Giorgio E Primiceri. 2015. “Time Varying Structural Vector Autoregressions and Monetary Policy: A Corrigendum.” The Review of Economic Studies, 82(4): 1342–1345.
Del Negro, Marco, Marc P. Giannoni, Domenico Giannone and Andrea Tambalotti. 2017. “Safety, Liquidity, and the Natural Rate of Interest.” Brookings Papers on Economic Activity, Spring.
Eichenbaum, Martin, Michelle Alexopoulos and Jeremy Kronick. 2024. “Economists must convince the public that productivity isn’t just a number.” The Globe and Mail, August 5.
Goodhart, Charles, and Manoj Pradhan. 2020. The Great Demographic Reversal: Ageing Societies, Waning Inequality, and an Inflation Revival. London: Palgrave Macmillan.
Hamilton, James D., Ethan S. Harris, Jan Hatzius, and Kenneth D. West. 2016. “The Equilibrium Real Funds Rate: Past, Present, and Future.” IMF Economic Review 64(4): 660–707.
Holston, Kathryn, Thomas Laubach, and John C. Williams. 2017. “Measuring the Natural Rate of Interest: International Trends and Determinants.” Journal of International Economics 108 (S1): 59-75. May.
Imakubo, Kei, Haruki Kojima, and Jouchi Nakajima. 2018. “The natural yield curve: its concepts and measurement.” Empirical Economics 55: 551–572.
Johannsen, Benjamin K., and Elmar Mertens. 2021. “A Time‐Series Model of Interest Rates with the Effective Lower Bound.” Journal of Money, Credit and Banking 53(5): 1005–1046
Kiley, Michael. 2020. “The Global Equilibrium Real Interest Rate: Concepts, Estimates, and Challenges.” Annual Review of Financial Economics 12: 305–26.
Kronick, Jeremy, and Steve Ambler. 2019. “Do demographics affect monetary policy transmission in Canada?” International Journal of Finance and Economics 24: 787–811, April.
Kronick, Jeremy, and Luba Petersen. 2022. Crossed Wires: Does Fiscal and Monetary Policy Coordination Matter? Commentary 633. Toronto: C.D. Howe Institute. December.
Kuncl, Martin, and Dmitry Matveev. 2023. “The Canadian Neutral Rate of Interest through the Lens of an Overlapping-Generations Model.” Bank of Canada Discussion Paper No 2023-5.
Laidler, David. 2011. “Natural Hazards: Some Pitfalls on the Path to a Neutral Interest Rate.” Backgrounder 140. Toronto: C.D. Howe Institute. July.
Laubach, Thomas, and John C. Williams. 2003. “Measuring the Natural Rate of Interest.” Review of Economics and Statistics 85(4): 1063–1070. November.
Lewis, Kurt F., and Francisco Vazquez-Grande. 2019. “Measuring the natural rate of interest: A note on transitory shocks.” Journal of Applied Econometrics 34(3): 425–436.
Lubik, Thomas A., and Christian Matthes. 2015. “Calculating the Natural Rate of Interest: A Comparison of Two Alternative Approaches.” Federal Reserve Bank of Richmond Economic Brief. October.
Mendes, Rhys R. 2014. “The Neutral Rate of Interest in Canada.” Bank of Canada Staff Discussion Paper No. 2014-5.
Morley, James, Trung Duc Tran, and Benjamin Wong. 2023. “A simple correction for misspecification in trend-cycle decompositions with an application to estimating r.” Journal of Business & Economic Statistics 42(2): 1–31.
Plant, Charles. 2023. The Missing Ingredient: Solving Canada’s Shortcomings in Growing Large Firms and Increasing Productivity. Commentary 645. Toronto: C.D. Howe Institute. August.
Primiceri, Giorgio E. 2005. “Time Varying Structural Vector Autoregressions and Monetary Policy.” The Review of Economic Studies 72(3): 821–852.
Rachel, Lukasz, and Lawrence H. Summers. 2019. “On Secular Stagnation in the Industrialized World.” Brookings Papers on Economic Activity 50: 1-76.
Roberts, John. 2018. “An Estimate of the Long-Term Neutral Rate of Interest.” FEDS Notes. Board of Governors of the Federal Reserve System. September.
Robson, William B.P., and Mawakina Bafale. 2023. Working Harder for Less: More People but Less Capital Is No Recipe for Prosperity. Commentary 647. Toronto: C.D. Howe Institute. November.
Rogers, Carolyn. 2024. “The urgent need to improve Canadian productivity.” Speech by Senior Deputy Governor Carolyn Rogers. Bank of Canada. March 26.
Taylor, John B. 2011. “Macroeconomic Lessons from the Great Deviation.” NBER Macroeconomics Annual 25: 387–395.
Witmer, Jonathan, and Yang, Jing. 2016. “Estimating Canada’s Effective Lower Bound.” Bank of Canada Review Spring: 3–14.
Woodford, Michael. 2003. Interest and Prices. Princeton University Press.
- 1 Debate goes even further as to whether models – be they structural or not – are able to estimate a neutral rate for a complex economy like Canada’s. See Laidler (2011) for a review. Borio (2024) recently gave a speech where he asks: “Is it useful, as is commonly done, to divine where real (inflation-adjusted) interest rates will go based on views about the evolution of the natural rate of interest, or r-star? This presentation argues that it is not, and that for much the same reasons r-star is not a helpful compass for monetary policy.” We disagree, but sympathize in that one should not be wedded too closely to the specific numbers. The key, we argue, is to look at the entirety of the neutral curve relative to the actual curve and, directionally, what this difference tells us about how stimulative or restrictive current monetary policy is.
- 2 In the parlance of Roberts (2018). Long-run stabilization, which occurs over a long period of time, differs from short-run stabilization, as in Woodford (2003), where the central bank would look to stabilize the economy with monetary policy each period.
- 3 Before the financial crisis in 2008-09, the difference between long-term interest rates and long-term neutral rates would have been a marker of how optimistic or pessimistic markets saw prospects over a longer period. A more optimistic market would typically invest less in safe government bonds, driving up rates, and invest more in equities and other riskier assets. We note that concerns over fiscal sustainability may also drive up rates.
- 4 We use a time-varying parameter vector autoregression (TVP-VAR) to generate our neutral yield curve. The TVP-VAR allows our coefficients to change over time – capturing near-term effects – and does not force us to take a stand on the structure of the economy like in more theoretical models.
- 5 We note that the methodology we employ has the benefit of being easily updatable in the future and can adjust to changing economic conditions, e.g., potentially higher underlying interest rates going forward, given (as the name suggests) the fact that the parameters can change over time.
- 6 We have finally begun to see the typical increase in the saving rate we would expect during a tightening cycle. The saving rate increased to 6.5 and 6.2 percent in the final two quarters of 2023 and 6.7 and 7.2 percent in the first two quarters of 2024.
- 7 See Robson and Bafale (2023) for more on Canada’s investment crisis. Note that the spike in labour productivity during COVID was mechanical more than structural, as it was more related to the lockdowns and the loss of employment in less-productive jobs than any improvements in production efficiencies.
- 8 In the model of Kuncl and Matveev (2023), Canada’s neutral rate is a combination of a global neutral rate and a country premium determined by domestic factors that influence Canada’s net foreign asset position relative to its output.
- 9 We note that our neutral rate estimates, while more volatile, compare favourably with the results Cacciatore et al. (2024) present when using the model developed by Kuncl and Matveev 2023. Our results today are also consistent with the Bank’s current estimate of the nominal range, 2.25 to 3.25 percent (see Adjalala et al. 2024). Our results are also similar to those of Christensen and Rudebush (2019) in their estimates for the US since the turn of the century, though they find a slightly positive rate for the first few years post-GFC, whereas we find a slightly negative rate.
- 10 10-year Government of Canada bond in Figure 8a made real using actual inflation.
- 11 We note that Figure 9 indicates that the short-term neutral rate has leading properties towards the short-term actual rate. Indeed, when we test using cross-correlations this is true. However, when we run Granger causality tests in both directions, we find that the two series Granger-cause each other – i.e., the causality runs in both directions. Therefore, neither series provides a predictive advantage over the other. Results available upon request.
- 12 We note that the Bank’s own research – Witmer and Yang (2016) – has put the effective lower bound at -50 basis points. In practice, however, 0.25 percent has remained the limit of where the Bank is willing to go.


