Introduction
The C.D. Howe Institute’s toolkit for tracking the economy is a customized series of data sets from past Institute publications. These tools can be helpful for policymakers and other parties interested in analyzing monetary policy and financial stability decisions.
These unique variables, which can all be found in past Institute work, include:
- The Leading Economic Activity Index: using various leading economic indicators, this index anticipates periods of economic stress for Canada and is based on freely available, downloadable data;
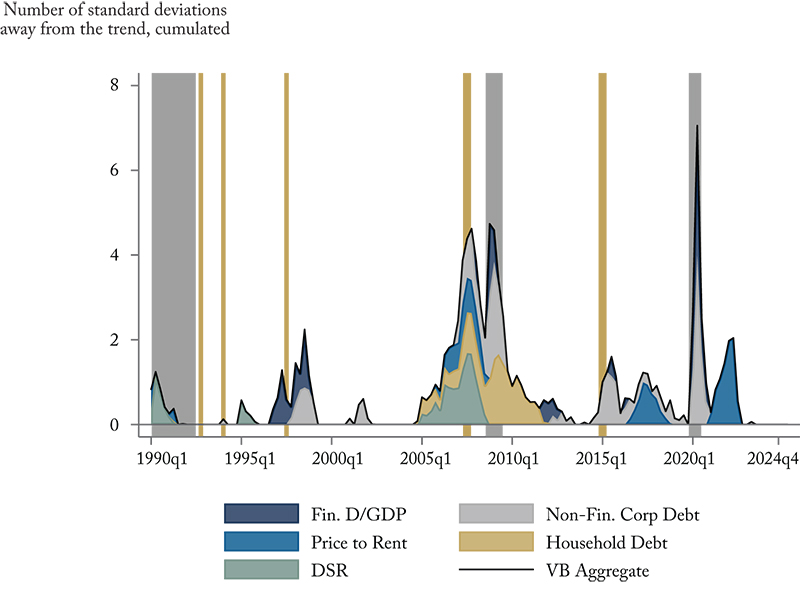
- The Vulnerability Barometer: tracks vulnerabilities across the banking, corporate, household, and housing sectors – a higher score means increased vulnerability;
- The Diffusion Index: conveys in a single number the extent to which the ups and downs of an economy are widespread by industry in any given period – where 50 can be thought of as an economy with the same number of industries expanding and contracting;
- The Money Overhang Index: tracks the gap between broad money trend growth (M2++) and trend inflation, and where a higher gap, if driven by shocks to money growth, means inflation will have to play catch up (with the opposite true as well);
- The Monetary Policy Tightness/Looseness Indicator: estimates a range of where the overnight rate might have been expected to sit based on different versions of the Taylor rule; and
- Supply/Demand Contributions to Inflation: measures product-level price changes and empirically identifies whether they have been mainly supply driven (that is, by energy prices, wages or other input costs) or demand driven (by consumer expenditures, fiscal policy and so on), aggregating them across each category (supply, demand, ambiguous).
- Neutral Rate Versus Actual Rate Yield Curve: the differences between neutral rates across the yield curve and their actual rate equivalents (all in real terms) give a more complete picture of how stimulative or restrictive monetary policy is at a moment in time.
Note: Grey bars represent recessions and gold bars periods of notable financial stress in the Canadian economy.
Figure 2: Vulnerability Barometer – 1990Q1 – 2025Q2