The Study in Brief
- The 2021 Canadian Net-Zero Emissions Accountability Act requires Canada to achieve “net zero” greenhouse gas emissions (GHGs) by 2050. An important component of the goal is that the power sector realize “net zero” by 2050.
- The Canada Energy Regulator (CER) has developed a net-zero projection for the power sector, emphasizing renewables (hydro, wind, solar). Wind and solar comprise 60 percent of projected increase in generation between 2019 and 2050.
- While wind and solar provide low-GHG power, these technologies require “storage” of power not needed in the middle of the day. Whatever the form, storage requirements increase the system cost of wind and solar.
- Several power utilities (notably California) have faced system instabilities due to inadequate capacity of readily “dispatchable” sources (hydro, fossil-fuel, and nuclear) able to meet demand when the sun is not shining and/or the wind is not blowing.
- The CER envisions refurbishing some existing reactors, but no expansion of Canadian nuclear capacity. By contrast, the UN’s International Panel on Climate Change and the International Energy Agency conclude that more nuclear power is necessary for elimination of GHGs in the power sector.
- In order to meet net-zero targets, many countries (e.g., China, Russia, and France) are investing heavily in small modular reactors (SMRs), which may realize shorter construction time, as well as simpler and safer designs than conventional reactors. Canada is well placed to promote SMRs, given our history of nuclear development and domestic sources of uranium.
The authors thank Charles DeLand, Benjamin Dachis, Alexandre Laurin, Chris Benedetti, Dave Collyer, Laurie Pushor, Gary Rose and anonymous reviewers for comments on an earlier draft. The authors retain responsibility for any errors and the views expressed.
Introduction
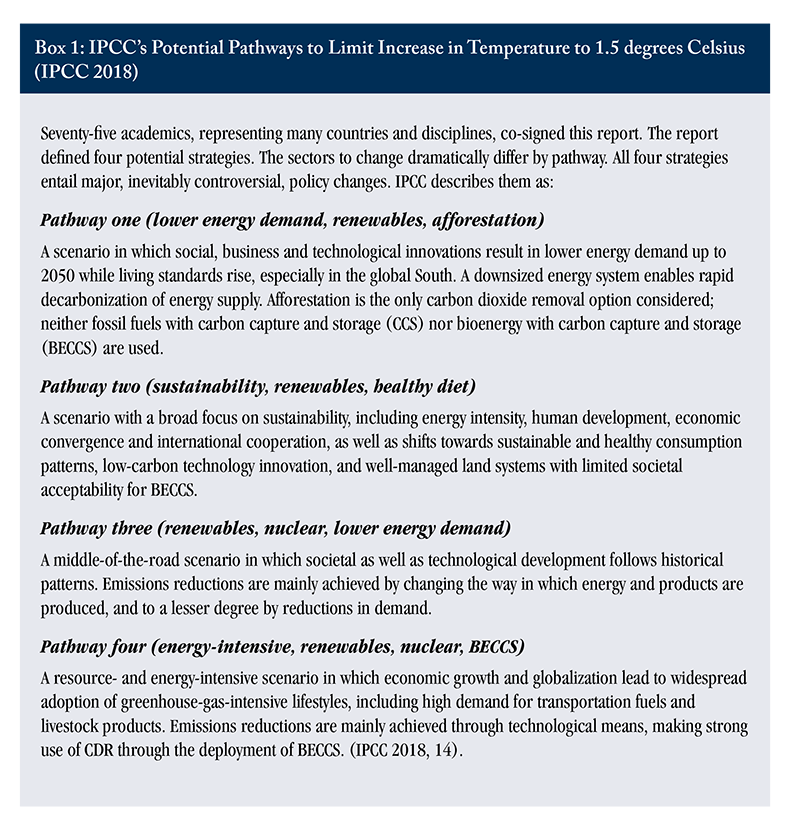
In a 2018 report targeting policymakers, the UN’s International Panel on Climate Change (IPCC) discussed four strategies to contain the world temperature increase to 1.5 degrees Celsius, relative to pre-industrial levels (see Box 1). All four require an increase in nuclear power. Relative to world nuclear power capacity in 2010, the minimum estimated requirement by 2050 is a doubling of nuclear power capacity (pathway two); the maximum requirement (pathway three) is a five-fold increase.
The International Energy Agency (IEA) comes to a similar conclusion in its annual World Energy Outlook (October 2022):
In the [net zero emissions by 2050] scenario, electricity becomes the new linchpin of the global energy system, providing more than half of total final consumption and two-thirds of useful energy by 2050. Total electricity generation grows by 3.3% per year to 2050, which is faster than the global rate of economic growth across the period. Annual capacity additions of all renewables [wind, solar, hydro] quadruple from 290 GW in 2021 to around 1 200 GW in 2030. With renewables reaching over 60% of total generation in 2030, no new unabated coal fired plants are needed. Annual nuclear capacity additions to 2050 are nearly four times their recent historical average. (IEA 2022b, 121.)
Canada has committed itself by law to realize “net zero” power in terms of greenhouse gas (GHG) emissions by 2050.
Canada is uniquely positioned as a country with a track record of relying on nuclear. Though unknown by most Canadians, Canada has been successfully operating nuclear reactors for over 70 years. Currently, we operate 19 nuclear reactors located in Ontario and New Brunswick. We are the second-largest producer of uranium globally, attributable to mining operations in Saskatchewan, and it is estimated that we could support in Canada 70-80 percent of a nuclear supply chain, from fuel production to parts manufacturing (OPG 2021).
Since the Canada Energy Regulator (CER) is a federal government agency, we examine its 2050 net-zero projection, a projection that relies heavily on expansion of renewable power sources (wind, solar, and hydro), envisions no increase in nuclear capacity, and assumes only a modest increase in total electrical consumption from 2019 to 2050. For reasons we discuss below, the very heavy reliance on wind and solar raises potential problems concerning the instability of power utilities. The Achilles heel of wind and solar is provision of adequate storage, at reasonable cost, of power not needed in the middle of the day, but needed when the sun is not shining and/or the wind is not blowing.
The Canada Energy Regulator
The CER informally defines its role as follows: “We work to keep energy moving safely across the country. We review energy development projects and share energy information, all while enforcing some of the strictest safety and environmental standards in the world” (CER 2022). There exist other projections enabling Canada to achieve net zero greenhouse emissions by 2050 in the electrical power generation sector.
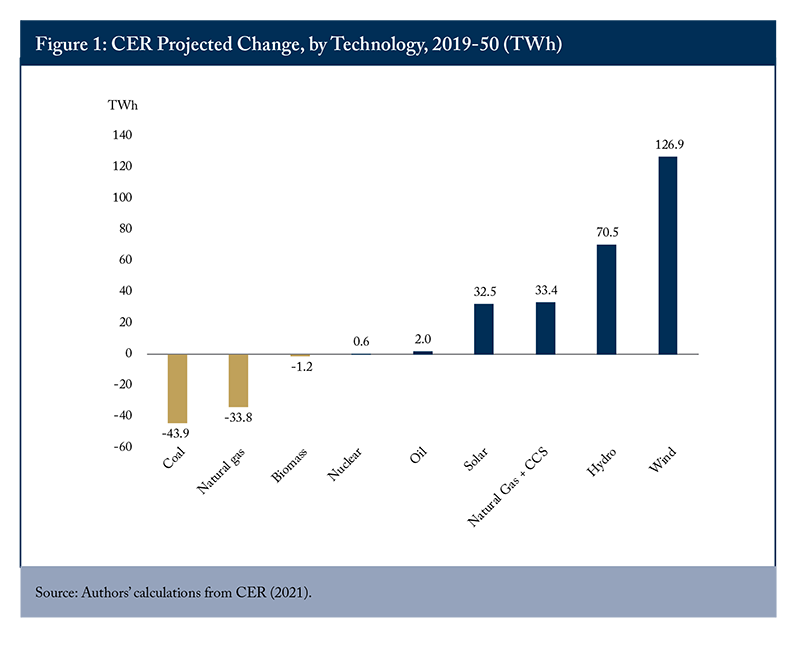
Relative to 2019 (pre-COVID), the CER projects by 2050 a net increase in electricity generation of 186 terawatt hours (TWh)
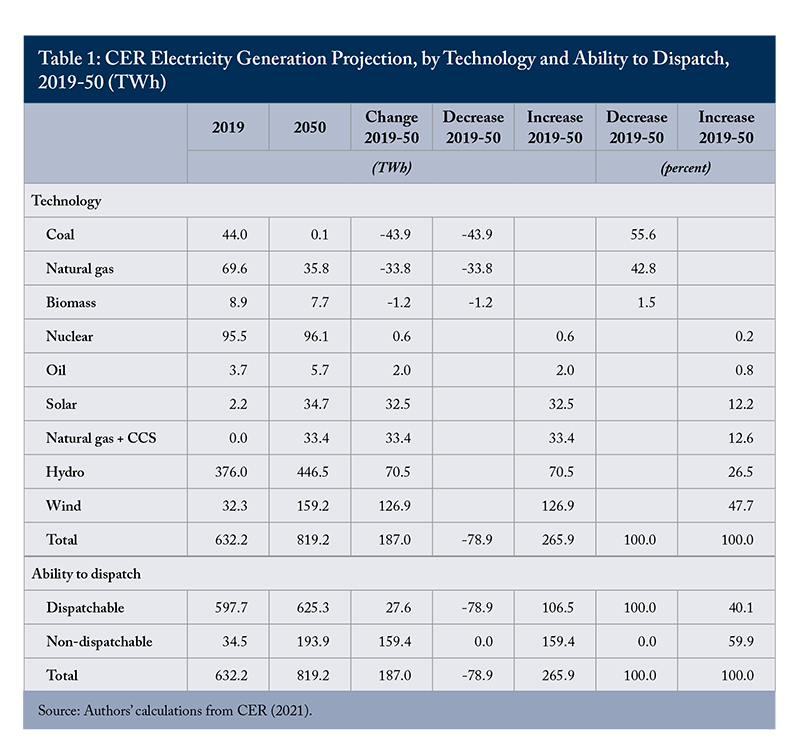
The CER projection eliminates 79 TWh of power currently generated by fossil fuels. After elimination of most fossil fuel power generation, realizing the projected 2050 generation requires an increase by 2050 from low-GHG emission technologies of 266 TWh (187 TWh net increase + 79 TWh fossil fuel replacement). The CER assumes wind and solar increase their annual production by 159 TWh, 60 percent of the 266 TWh increase.
Cost Estimates
Estimating unit costs of alternate technologies is obviously relevant, but the estimates are inevitably surrounded with large confidence intervals. In the case of SMRs, our cost estimates per megawatt hour (MWh) come from the white paper published by the Canadian Small Modular Reactor Roadmap Steering Committee (2018), a coalition of four provincial governments (New Brunswick, Ontario, Saskatchewan, Alberta) and their respective utilities, plus several other agencies (see Table 2). The cost estimates of other technologies (including both cost of generation and cost of storage) are from a joint IEA/OECD (2020) publication. For nuclear and renewables (hydro, wind, solar), the cost range of generating a MWh of electricity is similar. The highest unit cost estimate of generating a low-GHG MWh of electricity is coal supplemented with CCS.
There is an important distinction to introduce: dispatchable versus non-dispatchable power sources. Dispatchable sources, such as hydro, fossil-fuel, and nuclear, enable a utility to adjust the power supplied to the utility’s grid to meet demand; in the case of non-dispatchable sources the utility cannot do so. To incorporate non-dispatchable sources, such as wind and solar, requires some form of storage of power generated.
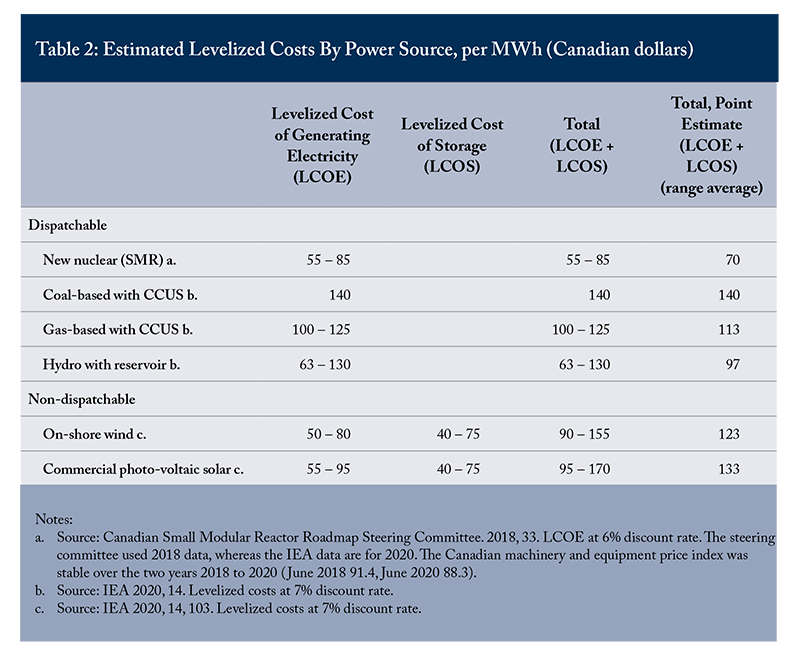
The most widely used metric to compare costs of generating electricity from different technologies is levelized cost of electricity (LCOE), a measure of average cost per unit of electricity over the lifetime of a typical power plant, subject to its capacity and capacity factor. The total cost of non-dispatchable sources is the LCOE plus the levelized cost of storage (LCOS), calculated in a manner similar to LCOE.
Wind and solar are valuable sources of low-GHG emission electricity, but they are non-dispatchable. The power they generate is typically supplied instantaneously to the grid when available. In order to match supply to demand, the utility adjusts dispatchable sources. For example, BC’s hydro-dependent system can, in general, readily adjust hydro generation. However, if the utility relies heavily on non-dispatchable wind and solar power, it will probably generate hydro output below optimum during the day.
The overwhelming majority of hydro generation costs is fixed capital costs of the dam and reservoir. Using dispatchable hydro below optimum system capacity increases hydro LCOE. The utility may be able to offset some of the decrease in hydro output by sales to a utility outside BC. However, the need to store non-dispatchable power will typically create a higher system-wide LCOE. In effect, the increase in system-wide LCOE is the LCOS attributable to the non-dispatchable power.
France generates 70 percent of its power by nuclear, which has enabled it to generate the lowest GHG emissions per MWh among all large industrial countries. Given the prevalence of nuclear, France cannot limit the use of nuclear to baseload power; it has evolved techniques to enable variation in nuclear power output. Admittedly, adjusting nuclear power output is subject to many more constraints than hydro or fossil-fuel power generation (see Appendix 1 for more detail).
At present, mechanical storage of potential energy is the overwhelmingly most important form of storage. There are other potential means to store non-dispatchable power (IEA 2020, chapter 6):
- hydro reservoirs: An important example is reservoirs of a hydro-based utility, as in BC. Provincial hydro capacity is designed above the estimated optimum capacity based on water flow. Installing excess capacity enables hydro plants to store renewable power in the middle of the day by reducing water flow through turbines. At times of peak dispatchable source demand (typically in the morning and evening) the utility can allow water flow above the deemed equilibrium level.
One benefit in BC Hydro’s cost-benefit analysis of the Site C dam is the increase in storage for expected expansion of renewables over the next three decades. - pumped water: If the utility lacks hydro reservoirs, it may be able to use wind/solar power to pump river water into a lake at a higher altitude and, when needed, supply the power to the grid by run-of-the-river turbines.
- chemical storage: An example is to transform a non-dispatchable electricity source into hydrogen, which can, later, be transformed into electricity. Canada has entered into an agreement with Germany to export “green” hydrogen generated by means of hydro power (NRCAN 2022). While this example is not intended as storage for non-dispatchable power, hydrogen is a potential means of storing non-dispatchable power.
- electro-chemical: e.g., batteries.
- electric storage: Super-capacitors.
- thermal storage: Molten salt thermal storage.
At present, storage of non-dispatchable sources is usually costly. Utilities providing electricity to a large number of consumers (such as residents in a province) require adequate dispatchable power that can be adjusted according to variation in system demand, over a 24-hour period or seasonal variations. In Canada, as opposed to France, large nuclear reactors are restricted to baseload power; output is not intended to vary. Including nuclear, the basic sources of dispatchable power (hydro, fossil fuels [coal, gas, oil], and nuclear), currently comprise 95 percent of Canadian power generated (see Table 1). The CER projects wind and solar to be 60 percent of incremental low-GHG emission power in 2050 relative to 2019. This increases the non-dispatchable share of power generation from 5 percent in 2019 to 24 percent in 2050.
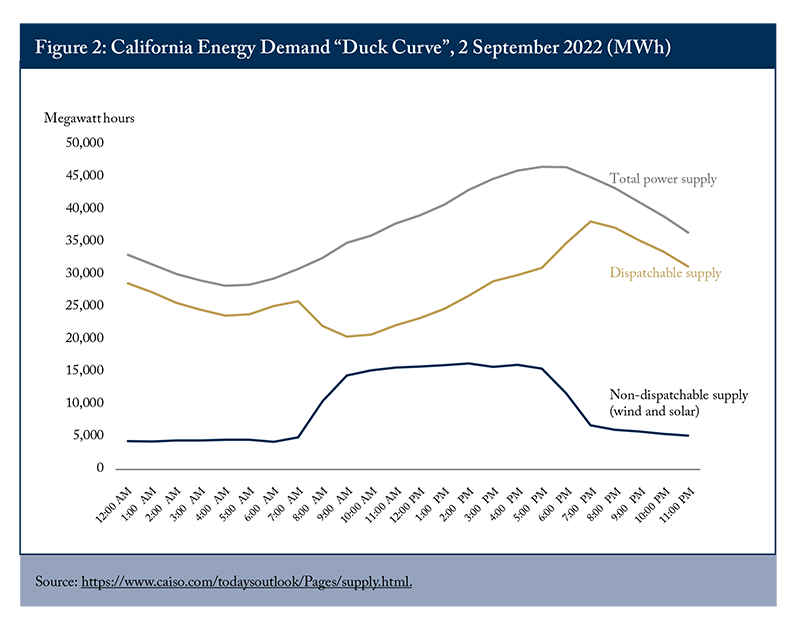
Over the last decade, power utilities highly dependent on wind and solar have faced problems of lost system flexibility, informally labeled the “duck curve” problem. Figure 2 illustrates electricity demand over 24 hours on a recent day in California, and the distribution of supply between dispatchable and non-dispatchable sources. The hourly dispatchable demand corresponds (more-or-less) to the back of a duck, viewed in profile. The duck’s head is peak dispatchable demand in the evening, a time of maximum power demand and low available renewable power.
The duck problem has afflicted power systems, notably in California and Germany, two jurisdictions with substantial renewable capacity (Economist 2021, 2022a, 2022b; Wintour 2022). The German case is illustrative of what can happen with insufficient dispatchable power. In the 2010s, Germany decided to shut down its nuclear plants and heavily subsidize renewable power sources. To provide adequate dispatchable power, Germany has been obliged to re-open coal-based plants and, until summer 2022, had committed itself to large imports of Russian gas.
Small Reactor Designs
The International Atomic Energy Association (IAEA) defines small nuclear reactors as having capacity under 300 MW (IAEA 2021). There are several expected benefits of small reactors over larger conventional nuclear plants (with capacity over 1,000 MW):
- economies of standardized construction: SMRs may generate economies in standardized construction of multiple reactors of a particular design.
The BWRX-300 reactor, which Ontario Power Generation (OPG) intends to deploy next to its Darlington nuclear station, is simpler than larger reactors. There are fewer components, less concrete, steel, etc. per MW of generation capacity. Key components, like the reactor pressure vessel and turbine systems, can be procured from more suppliers than is the case for large reactors. These economies may more than offset scale economies of large reactors (Hussein 2020; Locatelli, Bingham, & Mancini 2014). SMRs are simpler in design than large reactors, which may reduce regulation and reduce regulatory delays. - safety of new designs: Whether large or small capacity, new (Generations III+ and IV) reactor designs are safer than early generation designs. In the event of a meltdown, modern designs incorporate passive features that shut down the reactor even if operators do nothing – safety-by-physics rather than safety-by-engineering (IAEA 2018; Hussein 2022).
- potential for generating heat: Some SMR designs provide high-temperature steam, which can be used, for example, in oil sands extraction or desalination of water.
- location near consumer location: SMRS can be located near the intended customer load. This may reduce need for large investments in long-distance high-voltage power transmission.
- displacing diesel generators in remote communities: Micro-SMRs (< 25 MW) may be cost-efficient as means to eliminate diesel generators in remote communities.
Many SMR designs keep the size sufficiently small to allow the reactor to be transported on a truck bed, in shipping crates, and on railway cars. The IAEA (2018) definition of modularity includes both the reactor and components that regularly need replacing. The buyer receives a fully assembled product that fits into the designated site or comes in several pieces to be assembled on-site. SMRs can be used in tandem. Small towns might use one unit, while metropolitan areas use four or five. The ability to add more SMRs at a later date enables a nuclear power plant to build capacity incrementally. This enables a smaller initial upfront capital investment (Hussein 2020).
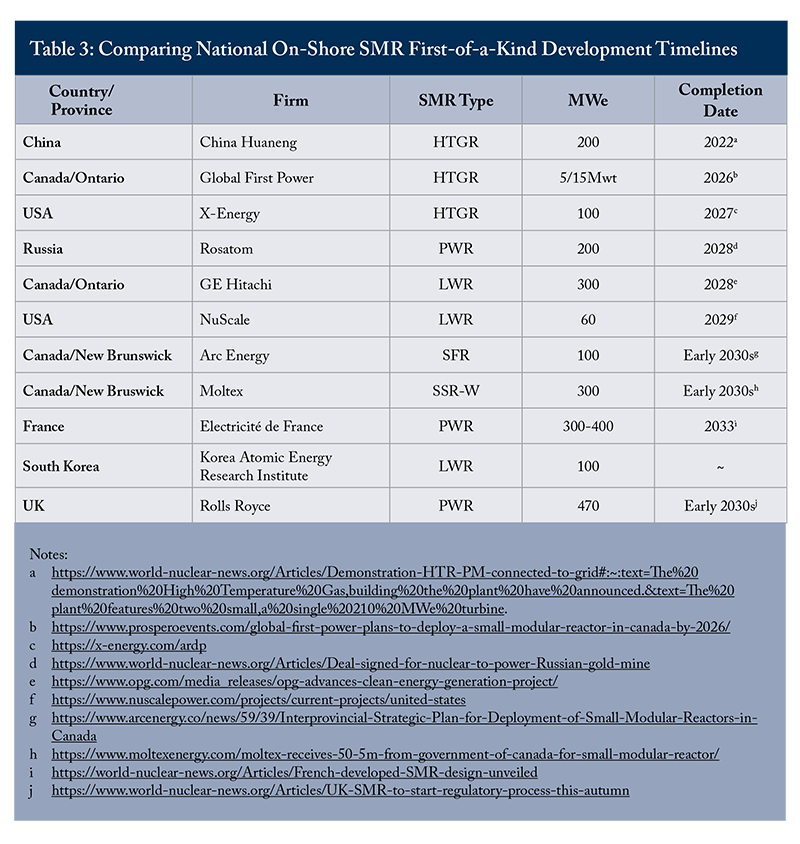
Table 3 is indicative of significant international interest in SMRs. The country making the largest commitment to SMRs is China. It has one SMR online and a second scheduled to come online in 2022. It is expected to build approximately 200 SMRs over the next decade, at a cost over C$500 billion (Bloomberg 2021).
Problems Posed by Nuclear Power
Nuclear poses four inherent problems, including complexity of design, potential accidents, and storage of spent fuel and other waste products. The fourth is public scepticism, based on Chernobyl and Fukushima, and the threat of channeling nuclear power technology toward nuclear arms.
Historically, many large nuclear power plants have overrun initial cost estimates and have experienced delays in completion. A partial explanation is over-regulation; another is the complexity of large nuclear plants relative to most other power generation technologies. The expectation among advocates of SMRs is that their smaller size will reduce complexity of design, and construction of many SMRs will enable experimentation in optimal reactor design. Relative to large reactors, Ontario Power Generation (OPG) expects its SMR to require less steel, concrete, and other components per MW of capacity. Admittedly, there is little to no practical experience yet to warrant claims of simpler designs and fewer regulatory delays.
Nuclear accidents involving mortality, morbidity, and environmental impacts have occurred, but all power generation technologies have some degree of negative impact on society and the environment. We emphasize the results of studies employing, as a measure, the deaths attributable to various technologies, normalized per TWh of electricity generated. Deaths may arise from extraction of fuel (e.g., coal mining and transportation), construction and maintenance of power plants (e.g., SMRs, wind mills, hydro dams), nuclear contamination from meltdown. Since 1950, two major meltdowns of nuclear power plants have taken place: Chernobyl in Ukraine in 1986, and Fukushima in Japan in 2011. Ritchie (2017, 2020) has estimated deaths attributed to radiation emanating from Chernobyl as 433. From Fukushima only one death has been attributed to radiation, though about 19,000 were killed by the 2011 earthquake and tsunami (WNA 2021). Overall, the deaths per TWh of wind, solar, and nuclear are less than 0.1 death per TWh. Deaths due to fossil fuel power generation are two orders of magnitude higher: 25 per TWh for coal-based power, 18 for oil, 3 for gas.
The Canadian Nuclear Safety Commission (CNSC) shares the international professional consensus that deep rock formations are the preferred deposit for long-run storage. Writing in the Encyclopedia of Physical Science and Technology, Saeid and Patchet (2003) emphasize the need for “broad public acceptance”:
While the technical and scientific communities may agree that deep geologic disposal is safe and ethical, the public seems much more skeptical. The main hurdle now is gaining public and political confidence in the safety of a deep geological disposal program and of the sites selected by that program.
The waste management community needs to communicate to the general public in simple yet precise terms how it obtains scientific and technical consensus that safe disposal can be achieved. If this communication is to be effective, it requires the involvement of the public in all aspects of the program. There must be recognition within the technical and scientific community that implementing any form of nuclear waste disposal is determined not only by technical or regulatory processes but also by broad public acceptance. (Saeb et al. 2003.)
While the authors emphasize public confidence, they don’t discuss details. The prerequisites in realizing more deep disposal sites will probably be a government white paper, parliamentary committee hearings, and consistent support by senior politicians.
Recent public surveys of Canadian public attitude to nuclear power are ambiguous. Upon election of Doug Ford as Premier in 2018, the Ontario government refused to extend renewable power access to the grid, on grounds it was potentially destabilizing the provincial power system. In January 2020, Friends of the Earth, an environmental organization opposed to expansion of nuclear power, published a national survey on small nuclear reactors (n=2094). The survey began with the following statement to participants: “Ontario has recently paid $237 million to shut down 758 renewable energy projects, while Saskatchewan is refusing to allow any more homeowners to install solar panels. Recently, Ontario, Saskatchewan and the New Brunswick Premiers announced support for a $27 billion plan to produce hundreds of uranium fueled Small Modular Nuclear Reactors.” The survey continued with the following question: “Do you think these governments are on the right path or wrong path with respect to energy production and dealing with climate change?” The share responding “wrong path” was 62 percent, “right path” 31 percent, “unsure” 7 percent. The lowest “right path” responses were in BC and Quebec (below 30 percent), two provinces with no history of nuclear power generation and large-scale hydroelectric generation. The highest “right path” responses were in Ontario and the Prairie provinces (above 35 percent).
In a second survey, Common Ground, an institute associated with the University of Alberta, conducted a two-stage survey (sample size 1,659) in Saskatchewan, in 2020 and 2021. The survey invited respondents to respond to the following statement: “Saskatchewan should use small modular reactors to replace coal energy generation on the provincial electrical grid.” The survey allowed five responses with the following results: strongly disagree (7.5 percent), somewhat disagree (7.5 percent), neutral (32.2 percent), somewhat agree (32.9 percent), and strongly agree (19.9 percent).
According to the first survey, the majority oppose nuclear expansion via SMRs; in the second, the majority (at least in Saskatchewan) support investment in SMRs. Arguably, the first survey employed a biased introduction. It implied that Ontario’s refusal of further renewable energy connections to the grid and agreement to large-scale investment in SMRs was driven by ideological bias, as opposed to concerns over system instability.
Saskatchewan should not be interpreted as representative of national opinion.
Don’t Put All our Eggs in the Wind and Solar Basket
Honouring the Paris Accord agreement (limiting temperature rise to 1.5C degrees) requires ambitious international co-operation – which to date has been absent. All feasible strategies (see Box 1) require high-income countries to invest heavily in several technologies – acknowledging the many uncertainties in each. Wind and solar pose problems in the form of potentially high cost of storage and public resistance to many on-shore wind mills and large solar farms. After a century of expanding hydro capacity, increased hydro power in Canada requires building dams in less productive sites. Nuclear poses problems in terms of accidents, spent fuel storage, and adverse public opinion.
The CER projection implies that, by 2050, a quarter of power generation derives from wind and solar. At that level of non-dispatchable power, the “duck” problem may well be serious. A potential scenario for nuclear expansion via SMRs is to maintain, in 2050, the dispatchable share of power generation in 2019. After shutting down most fossil fuel power and realizing CER’s projected increase in hydro power, construction of 47 300 MW SMR plants would reduce reliance on wind and solar, and maintain non-dispatchable power at 5 percent of the CER projected portfolio of power sources.
Realizing a “net zero” power sector by 2050 requires a massive reconfiguration, one that Canadians have only begun to undertake. In October 2022, Ottawa made a modest down payment in diversifying its green energy financial support: Canada Investment Bank is investing $970 million in Canada’s first SMR (CIB 2022). In addition, the Fall Economic Statement (Canada 2022, 30) introduced a refundable tax credit of up to 30 percent for investments in clean technologies, including SMRs. These are welcome actions from Ottawa, however nuclear energy is still excluded from some major federal clean energy funding programs such as the Green Bond Framework. Much more funding will be needed to ensure we don’t put all our eggs in the wind and solar basket.
Appendix 1: Terms Frequently Used in Discussion of Power Utility Policy
A dispatchable source of electricity refers to an electrical generating source that can adjust its power output supplied to the electrical grid on demand. In Canada, we have three dispatchable sources: hydro, fossil-powered plants (coal, gas, oil), and nuclear. Most renewable sources, such as wind and solar, are non-dispatchable. They can only generate electricity when their energy source (wind or sunlight) is available. They can be considered as dispatchable if they enjoy adequate storage of the power generated.
Dispatchable sources must be able to ramp up to maximum capacity or shut down relatively quickly, depending on the demand for electricity. Different types of power plant have different speed of output adjustment:
- Hydroelectric turbines are able to adjust output very quickly, in under a minute.
- Natural gas turbines can generally be ramped up or down in a few minutes.
- Nuclear power plants are primarily intended to deliver stable baseload power at the capacity designed. However, in France, 70 percent of power derives from nuclear, which requires the ability to adjust output (for example, adjustment to time-of-day use).
Why is dispatchable power important?
- Load matching: Typically, peak demand is in early morning and evening. Much less electricity is needed at night than during the day. Dispatchable capacity must be sufficient to accommodate peak demand.
- Cover lead-in times: A lead-in time is time a power plant takes to achieve desired output.
- Cover intermittent power sources: Non-dispatchable sources provide valuable electricity, but they do not provide guaranteed electricity, unless the power sector can provide adequate storage.
A power plant is designed with a generating capacity, designated by the electricity generated in one hour under optimum conditions. The International Atomic Energy Association defines small nuclear reactors as those with capacity under 300 MW (i.e., able to generate a maximum of 300 MWh in an hour).
The capacity factor refers to the expected power generated over, say, a year relative to the plant generating power throughout the year at the designed capacity. Wind and solar have a capacity factor of about 30 percent, nuclear plants about 90 percent.
Baseload power / peaking power
Baseload power is the minimum capacity needed for the electrical grid over a given time period, such as a 24-hour day. Baseload power plants are intended to operate at their optimum capacity. In other words, they have a high capacity factor. The three important baseload power sources in Canada (hydro, fossil fuel, and nuclear) are also dispatchable, with variable dispatch potential. Demand fluctuates throughout a typical day, so baseload power is not enough. The grid requires peaking power for spikes in power demand. The utility may supply peaking power from a high-cost plant not usually used; the utility may purchase peaking power from another utility.
Levelized cost of electricity (LCOE) and levelized cost of storage (LCOS)
The most frequently used metric to compare the cost of electricity arising from alternate technologies is levelized cost. Typically, LCOE is measured as dollars per megawatt hour (MWh) of electricity generated by a particular power plant. The intuition behind levelized costing is to define a constant price per MWh of power generated by a particular power plant over its estimated life span such that the present value of revenue generated equals the present value of projected lifetime costs incurred by a plant (capital + operating costs).
As in any discounting exercise, the calculated LCOE varies with the discount rate. The present values of initial capital costs do not much vary with the discount rate. On the other hand, varying the discount rate has a sizeable impact on present value of revenue generated over many decades. Hence, the higher the discount rate, the higher the LCOE. The levelized cost of storage (LCOS) for a utility depends on the available storage options. The LCOS is an average calculated in a manner similar to LCOE.
Carbon capture and storage (CCS)
Continued reliance on fossil-based dispatchable power is consistent with elimination of GHG emissions in the power system – but only if carbon is extracted from the exhaust gases of the power plant and buried. Extraction is feasible but, currently, it is expensive.
Megawatt hour (MWh), terawatt hour (TWh), kilowatt hour (KWh)
Watt is a unit of power; watt x time is a unit of energy. An incandescent 100-watt bulb lit for an hour consumes 100 watt hours. If lit for ten hours, the bulb consumes 1,000 watt hours, or one kilowatt hour, of electricity. One megawatt hour of electricity is one million watts in an hour; one terawatt hour is one trillion watts in an hour.
Renewable power sources. Sources of power that are not exhausted by use. They include bioenergy, geothermal, hydropower, solar photovoltaics, concentrating solar power, wind and marine (tide and wave) energy.
Appendix 2: Glossary of Nuclear Reactor Designs
LWR – Light Water Reactor. This is the most common reactor type, used around the globe. It uses normal water, as opposed to heavy water, as both its coolant and neutron moderator. Reactor fuel is used as a solid form of fissile elements. SMR designs typically take this old reactor concept and simplify it through removal of unnecessary components. These reactors tend to be simpler and cheaper to build than other types of reactors.
PWR – Pressurized Water Reactor. This is the most common type of light water reactor. In a PWR, the primary coolant is water, which is pumped under high pressure to the reactor core where it is heated by the fission of atoms. The heated, high-pressure water then flows to a steam generator, where it generates steam to turn a turbine.
SFR – Sodium-Cooled Fast Reactor. This advanced (Gen 4) reactor uses liquid metal (sodium) as a coolant instead of water, which is used in most reactors operating today. Using liquid metal allows for the coolant to operate at higher temperatures and lower pressure than current reactors. This improves the efficiency and safety of the system. The SFR uses a fast neutron spectrum, meaning that neutrons can cause fission without having to be slowed down first as in current reactors. Fast reactors have significantly reduced waste streams in comparison to our current reactors.
SSR-W – Stable Salt Reactor – Wasteburner. This advanced (Gen 4) type is a hybrid between light water reactor fuel types and traditional molten salt reactor approaches. In the SSR-W, the liquid molten salt fuel mixture is contained within fuel assemblies that are very similar to current light water reactor technology and are submerged in a pool of pure liquid salt coolant. This is also a fast reactor that could use recycled existing Canadian nuclear waste as fuel.
References
Bloomberg. 2021. China is Home to World’s First Small Modular Nuclear Reactor. Accessed at https://www.bloomberg.com/news/articles/2021-12-21/new-reactor-spotlights-china-s-push-to-lead-way-in-nuclear-power#:~:text=At%20200%20megawatts%2C%20the%20small,experts%20most%20excited%20about%20SMRs.
Canada. 2022. Fall Economic Statement.
Canada Energy Regulator (CER). 2021. “Canada’s Energy Futures 2021 Fact Sheet: Electricity – Total Generation by Energy Source – Evolving Policies Scenario.” Accessed 20220625 at https://www.cer-rec.gc.ca/en/data-analysis/canada-energy-future/2021electricity/2021electricity.pdf
_______. 2022. “Canada Energy Regulator – About.” Accessed 20220814 at https://www.cer-rec.gc.ca/en/about/
Canada Investment Bank (CIB). 2022. “CIB commits $970 million towards Canada’s first small nuclear reactor.” Accessed at https://cib-bic.ca/en/medias/articles/cib-commits-970-million-towards-canadas-first-small-modular-reactor/
Canadian Small Modular Reactor Roadmap Steering Committee. 2018. A Call to Action: A Canadian Roadmap for Small Modular Reactors. Accessed at https://smrroadmap.ca/
The Economist. 2021. “Can Europe go green without nuclear power? Germany is shutting its nuclear plants and wants others to follow its example. Few are listening (20210816).” Accessed at https://www.economist.com/graphic-detail/2021/08/15/can-europe-go-green-without-nuclear-power
_______. 2022a. “Why Germans remain so jittery about nuclear power (20220108).” Accessed at https://www.economist.com/europe/2022/01/08/why-germans-remain-so-jittery-about-nuclear-power
_______. 2022b. “Europe reconsiders its energy future (20220602).” Accessed at https://www.economist.com/business/2022/03/05/europe-reconsiders-its-energy-future
Environment and Climate Change Canada (ECCC). 2021. A Healthy Environment and a Healthy Economy.
Holland, S., E. Mansur, A. Yates. 2022. “Decarbonization and Electrification in the Long Run.” NBER Working Paper Series, no.30082. Accessed at http://www.nber.org/papers/w30082.
Hussein, E. 2020. Emerging small modular nuclear power reactors: A critical review. Physics Open.
_______. 2022. “Design features of small reactors for distributed energy production.” 41st annual conference of the Canadian Nuclear Society and 46th Annual CNS/CNA. Manuscript available from author.
International Atomic Energy Association (IAEA). 2021. “What are Small Nuclear Reactors?” Accessed at https://www.iaea.org/newscenter/news/what-are-small-modular-reactors-smrs
International Energy Agency (IEA). 2022a. “Nuclear Power and Secure Energy Transitions: From Today’s Challenges to Tomorrow’s Clean Energy Systems”. Accessed at https://www.iea.org/reports/nuclear-power-and-secure-energy-transitions
_______. 2022b. World Energy Outlook, 2022 (October). Accessed 20221027 at https://www.iea.org/reports/world-energy-outlook-2022
_______ & OECD Nuclear Energy Agency (IEA/OECD). 2020. Joint Report. Projected Costs of Generating Electricity, 2020 Edition. Accessed at https://www.iea.org/reports/projected-costs-of-generating-electricity-2020
International Panel on Climate Change (IPCC). 2018: Summary for Policymakers. In Global Warming of 1.5°C. (IPCC Special Report on the impacts of global warming of 1.5°C above pre-industrial levels and related global greenhouse gas emission pathways, in the context of strengthening the global response to the threat of climate change, sustainable development, and efforts to eradicate poverty.) Accessed at: https://www.ipcc.ch/sr15/chapter/spm/
Natural Resources Canada (NRCAN). 2022. “Joint declaration of intent between the Government of Canada and the Government of the Federal Republic of Germany on establishing a Canada-Germany Hydrogen Alliance.” Accessed at https://www.nrcan.gc.ca/climate-change-adapting-impacts-and-reducing-emissions/canadas-green-future/the-hydrogen-strategy/joint-declaration-intent-between-the-government-canada-and-the-government-the-federal/24607
Ontario Power Generation (OPG). 2021. “OPG advances clean energy generation project.” News release. Accessed 20220415 at https://www.opg.com/media_releases/opg-advances-clean-energy-generation-project/
Ritchie, H. 2017. “What was the death toll from Chernobyl and Fukushima?” Our World in Data. Accessed at https://ourworldindata.org/what-was-the-death-toll-from-chernobyl-and-fukushima
_______. 2020. What are the safest and cleanest sources of energy? Our World in Data. Accessed at https://ourworldindata.org/safest-sources-of-energy
Saeid, S., and S. Patchet. 2003. Radioactive Waste Disposal in Encyclopedia of Physical Science and Technology (third edition). Accessed at https://www.sciencedirect.com/topics/engineering/deep-geological-disposal
University of Calgary. 2022. Energy Education.
Wald, M. 2022. “Next for nuclear: Energy arbitrage.” Nuclear Newswire. Accessed 20220828 at https://www.ans.org/news/article-4171/next-for-nuclear-energy-arbitrage/
Wintour, P. 2022. “We were all wrong: How Germany got hooked on Russian energy.” Guardian (20220602) Accessed at https://www.theguardian.com/world/2022/jun/02/germany-dependence-russian-energy-gas-oil-nord-stream
World Nuclear Association (WNA). 2021. Fukushima Daiichi Accident. Accessed 20220212 at https://world-nuclear.org/information-library/safety-and-security/safety-of-plants/fukushima-daiichi-accident.aspx
_______. 2022. Nuclear Power in France. October. Accessed at: https://world-nuclear.org/information-library/country-profiles/countries-a-f/france.aspx
This E-Brief is a publication of the C.D. Howe Institute.
John Richards is an emeritus professor, Simon Fraser University and fellow-in-residence, C.D. Howe Institute.
Christopher Mabry, Master’s of Public Policy, Simon Fraser University, is a policy analyst with the Government of Canada.
This E-Brief is available at www.cdhowe.org.
Permission is granted to reprint this text if the content is not altered and proper attribution is provided.
The views expressed here are those of authors. The C.D. Howe Institute does not take corporate positions on policy matters.


