





by Gherardo Caracciolo
- This third edition of the scorecard on Canadian financial regulation finds that regulators continue to place overwhelming emphasis on stability, resilience, and consumer protection, while giving comparatively little attention to efficiency, competition, and innovation. The analysis also finds that formal, transparent cost-benefit analysis remains largely absent from regulatory decision-making.
- The report develops a simple macro-financial framework showing that stability-oriented regulation operates through two opposing channels: tighter regulation can reduce the amplification of shocks, but the compliance costs it imposes also absorb resources and erode financial institutions’ capacity to withstand those shocks. When compliance costs become sufficiently large, additional regulation may deliver diminishing, or even negative, stability benefits.
- Canadian evidence shows that stronger macroprudential tightening is consistently associated with weaker subsequent economic growth, while providing no measurable reduction in the probability of recession. The findings suggest that integrating rigorous cost-benefit analysis into financial regulation is important for designing regulation that achieves its stability objectives without imposing unnecessary economic costs.
The author extends gratitude to Alex Ciappara, Jeremy Kronick, Dave Longworth, Peter MacKenzie, Victoria Mainprize, William Robson, Mark Zelmer, and several anonymous referees for valuable comments and suggestions. The author retains responsibility for any errors and the views expressed.
Introduction
Canadian financial regulation exhibits a persistent imbalance: stability, resilience, and consumer protection dominate stated objectives, while efficiency, competition, and innovation receive marginal attention. In an environment like Canada’s, characterized by weak productivity growth, poor business investment, and sluggish economic expansion,1See: Robson and Bafale (2024) and Eichenbaum, Alexopoulos, and Kronick (2024), among others. a regulatory framework that underweights efficiency and innovation risks further constraining economic dynamism and long-run growth,2This link is well documented in the literature. See, for example, Gu (2025). particularly as regulatory burdens rise.
To quantify this imbalance, my first paper, The Good, the Bad, and the Unnecessary (Bourque and Caracciolo 2024), developed a simple scorecard to track the stated objectives of major federal and provincial regulators’ regulations. The findings were striking: most regulatory initiatives (approximately 89 percent) primarily targeted market abuse, stability, transparency, and, ultimately, improved consumer protection. By contrast, only a much smaller fraction (16 percent) explicitly aimed to enhance efficiency or promote growth and innovation.3Regulations can target more than one objective; hence the percentages do not add up to 100.
By updating the scorecard annually, one goal of this work has been to assess how regulators’ efforts and priorities have evolved. The second edition of the scorecard (Caracciolo 2025) showed a substantially unchanged regulatory landscape. These results raised the question of whether the observed imbalance was temporary, delivered by recent economic and financial uncertainty that threatened the system, or structural and destined to last. To investigate this question, the second Commentary compared the mandates of Canadian regulators with those of international counterparts that adopt a more balanced regulatory framework. This analysis showed that Canadian regulators seem to adopt a lexicographic loss function,4A loss function that prioritizes some policy objectives over others, rather than trading them off continuously. in which stability, resilience of the system, and consumer protection take precedence over efficiency and dynamism.
This regulatory imbalance is systematic because it does not sufficiently internalize the costs that regulations impose on regulated financial institutions: regulatory documents almost never refer to or report proper cost-benefit analysis. Yet thorough cost-benefit analysis is essential to a healthy and efficient regulatory framework. Accordingly, that paper addressed this gap by quantifying compliance costs and tracking their evolution. To achieve this, it drew on a new survey measuring compliance costs at the firm level. The results showed that regulatory activity reallocates scarce labour away from production and intermediation toward administration and reporting; that this process had grown in significance year over year; and that regulatory costs had an asymmetric effect, falling much more heavily on small firms that are critical to competition and innovation.
This third edition advances the analysis in two ways. First, as per tradition, it updates and extends the scorecard. This exercise reveals a largely unchanged regulatory landscape, with most of the new documents continuing to focus on stability and consumer protection. This result is unsurprising, given the ordering of priorities embedded in regulators’ mandates.5This is shown in the previous scorecards: Bourque and Caracciolo (2024) and Caracciolo (2025). Second, this Commentary investigates the unintended consequences of this imbalance in regulatory priorities. It begins by challenging the conventional view that financial regulation necessarily involves a trade-off between growth and stability. In much of the literature and regulatory practice, these objectives are treated as competing: tighter regulation reduces risk, but at the cost of lower economic dynamism.
This view, however, rests on a crucial omission. It treats regulation as a constraint while largely ignoring the resources required to implement it. Yet these costs are not innocuous. By absorbing labour and eroding intermediaries’ net worth, they directly affect the resilience of the system. Because this overhead is largely fixed, it falls disproportionately on smaller institutions, raising concerns about competition that have become a growing focus of Canadian policy.
To formalize this mechanism, this paper develops a simple structural model that embeds this additional “cost channel” into a standard macro-financial framework. When firms spend resources on compliance, they retain less capital, leaving them more exposed to shocks. The model shows how this interaction between weaker capital buffers and larger shocks creates a genuine, but often overlooked, trade-off and identifies the conditions under which stability-oriented policies may, paradoxically, even increase the likelihood of financial distress rather than reduce it.
The paper then applies this framework to the Canadian case. The empirical analysis shows that stability-oriented measures do not always deliver the expected gains in output stability or lower recession risk while imposing a clear and significant cost to growth. These findings point to a potential miscalibration of current regulatory priorities.
Updated Scorecard
As in the previous papers, this paper begins by updating the regulatory scorecard.6The updated scorecard can be found in online Appendix A. It applies the same textual and topic analysis framework used in the previous studies (Bourque and Caracciolo 2024; Caracciolo 2025), applying it to newly issued and updated regulatory documents from the past year. Using natural language processing (NLP) techniques (see Bourque and Caracciolo [2024] for a more complete description), the analysis extracts and classifies key terms, sentences, and logical arguments to assess how these documents address market failures (such as market abuse, asymmetric information, systemic and liquidity risk), policy objectives (for example, stability, transparency, efficiency, growth), and cost-benefit considerations.7Regarding CSA documents: references to cost-benefit analysis can be found in some national instruments and consultations. However, these references are not sufficiently substantive, nor connected enough to the broader regulatory narrative contained in the Companion Policies. This approach allows for a thorough evaluation of the regulatory process and regulators’ priorities.
The new set of documents8This paper’s focus remains on key regulatory materials across the banking, insurance, pensions, and securities sectors, including Financial Services Regulatory Authority of Ontario (FSRA) Guidelines, Autorité des marchés financiers (AMF) Guidelines, Office of the Superintendent of Financial Institutions’ (OSFI) Guideline Impact Analysis (and related documents), and Canadian Securities Administrators’ (CSA) Companion Policies. See Bourque and Caracciolo (2024) for a thorough discussion regarding the choice of documents. confirms that the overall picture remains largely unchanged, with a continued predominance of stability-oriented objectives.
Starting with the Financial Services Regulatory Authority of Ontario (FSRA), the newly issued guidelines remain strongly focused on consumer protection, transparency, and system stability. Most documents continue to address familiar market failures – such as asymmetric information, market abuse, and operational risks – while framing policy objectives in terms of confidence, protection, and resilience. That said, compared with previous editions, there are some signs of progress. One example is the Automobile Insurance Rating and Underwriting Guidance (AU0142INT), which moves away from a highly prescriptive framework toward a more principles-based and outcomes-focused approach. The document recognizes that rigid regulation can generate inefficiencies, most notably regulatory lag in pricing and delays in innovation, and seeks to address these issues by allowing greater flexibility in underwriting and pricing practices. The document emphasizes efficiency, improved risk-based pricing, and reduced frictions while maintaining safeguards against discrimination and bias. In doing so, it implicitly moves beyond the classic stability-versus-dynamism trade-off by pursuing both objectives simultaneously. While still not formalized, this represents a notable step toward a more balanced regulatory perspective. This orientation is also reflected in FSRA’s mandate, which formally includes fostering competitive and innovative sectors.9Two points from FSRA are worth noting in this respect. Its statutory objects include fostering strong, sustainable, competitive, and innovative financial services sectors (FSRA Act, s. 3(2)(c)). The Operational Risk and Resilience Guidance for credit unions is one example where modernization aimed at enabling participation in federal initiatives was an explicit objective, even if not expressed through a formal cost-benefit analysis.
Turning to the Canadian Securities Administrators (CSA), the overall picture remains largely stable.10As in the previous papers (see Bourque and Caracciolo [2024] for the original discussion), this report focuses on CSA’s Companion Policies. These are CSA’s designated vehicle for articulating the reasoning behind a rule: the document where regulators explain why an instrument exists, what failure it addresses, and how it fits within their broader priorities. Other mechanisms, such as blanket orders, can change what is permitted (for instance, the pilot allowing smaller venture issuers to file semi-annual rather than quarterly financial statements) without being accompanied by the kind of explanatory narrative the textual analysis is designed to measure. The scorecard is therefore a measure of how regulators explain and prioritize their rules, not a complete inventory of every change to the regulatory perimeter; the two are related, but distinct objects, and the focus is on the former because it is what speaks to regulatory priorities and reasoning. Most initiatives continue to prioritize market integrity, transparency, and investor protection. Much like FSRA, some recent developments seek to reduce regulatory burden. In particular, the Proposed Multilateral Instrument 45-111 Self-Certified Investor Prospectus Exemption, together with its companion policy and consequential amendments to National Instruments 45-106 and 45-102, explicitly aims to facilitate capital formation and improve harmonization across jurisdictions. This represents a concrete effort to reduce frictions and enhance efficiency within the regulatory framework.
For the Office of the Superintendent of Financial Institutions (OSFI), recent developments are more encouraging from a regulatory design perspective. The ongoing policy review process, which has led to the revision and removal of outdated guidelines,11Through this process, OSFI identified and rescinded 20 guidelines and advisories that were outdated (and by December 2025, 32 documents in total were removed from the regulatory library). reflects a clear effort to streamline the regulatory framework and reduce unnecessary complexity and regulatory burden. The objective of eliminating redundant or obsolete requirements is both commendable and consistent with the need to contain compliance costs. However, while these efforts address the stock of regulation, they do not fundamentally alter the underlying orientation of the framework, which continues to prioritize stability, resilience, and confidence, while this year’s guidelines remain oriented toward resilience and disclosure rather than efficiency.12Consistent with this, the eight OSFI items in online Appendix A this year are largely disclosure, capital, and operational-resilience guidelines rather than measures aimed at efficiency or growth. One development that does cut in the direction of competitiveness is the pause of the Basel III output (standardized-approach) floor, which OSFI announced to avoid placing Canadian institutions at an international disadvantage. That said, OSFI has recently acknowledged the importance of improving the efficiency and proportionality of the regulatory framework. In several speeches and public appearances throughout 2025 and 2026, Superintendent Peter Routledge emphasized the need to avoid the “stability of the graveyard” and increase efficiency in the financial system. The scorecard will document whether these good intentions translate into concrete regulatory initiatives.
Evidence from the Autorité des marchés financiers (AMF) points in a similar direction. Recent guidelines continue to emphasize solvency, stability, and risk management – often in connection with contagion, liquidity risk, and systemic concerns – while also highlighting transparency and consumer protection. Although some documents include references to efficiency, dynamism, or innovation, these remain secondary to core prudential objectives and do not materially change the overall balance of priorities.
This updated scorecard reinforces the two central conclusions of the previous editions. First, the distribution of stated objectives remains heavily skewed toward stability, consumer protection, and transparency, with comparatively limited attention to efficiency, competition, and innovation. Specifically, 92 percent of the regulations continue to target market abuse, stability, transparency, and, ultimately, improved consumer protection, compared with only 17 percent aimed at enhancing efficiency and promoting growth and innovation.
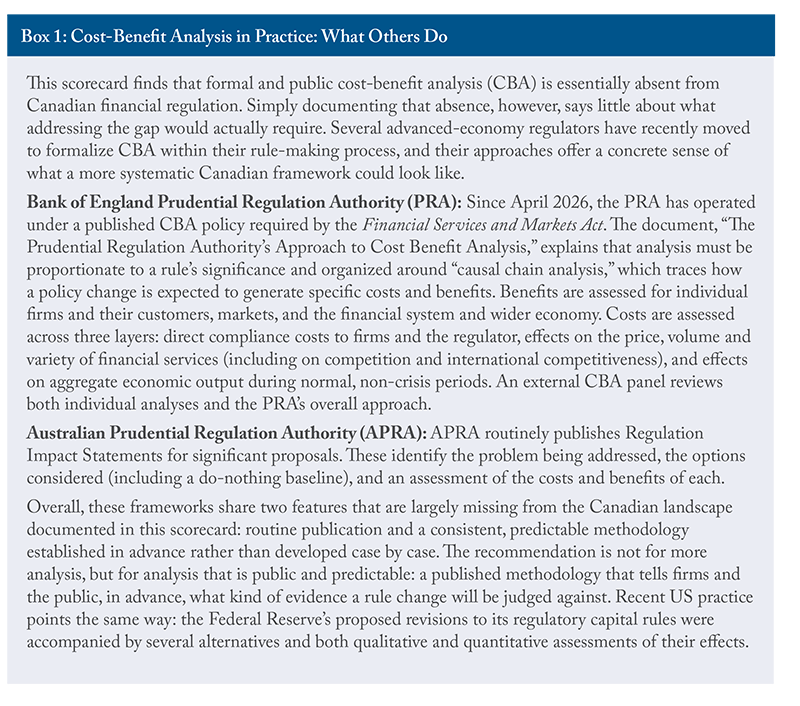
Second, and importantly, the near-total absence of formal, transparent, and operational cost-benefit analysis remains a pervasive feature across all regulators. This latter point is particularly important. Even in cases where regulatory changes raise explicit concerns about compliance costs – for example, the Amendment to National Instrument 43-10113This is a dominant theme in the comments received by the regulator regarding this amendment. – and among regulators required14For example, OSC and FSRA. to perform a cost-benefit analysis, it is difficult to determine what, if any, quantitative assessment actually took place. Cost-benefit analysis, where it is expected, should be public and conducted against a consistent, predictable standard. At present, neither condition is met. As a result, while the costs of regulation are increasingly recognized in principle, they are not systematically incorporated into the policy framework.
Theoretical Framework
As discussed, the imbalance documented in the scorecard is not accidental but reflects the mandates of the Canadian regulators, which place primary weight on stability, resilience, and consumer protection. Interpreted through an economic lens, this corresponds to an implicit objective function in which stability-related outcomes receive greater weight. The key question for policymakers is whether such a stability-first orientation is socially optimal and through what channels it affects macroeconomic outcomes.
Financial regulatory frameworks rest on two distinct pillars: prudential and market conduct regulation. Prudential regulation constrains risk-taking directly. The logic is simple and intuitive: in the absence of sufficient capital and leverage constraints, financial systems tend to expand aggressively (credit grows, risk-taking increases, and balance sheets become stretched). In good times, this expansion supports investment, job creation, and innovation. However, it also makes the system more fragile: when a negative shock hits (for example, a decline in asset prices, a deterioration in credit quality, a tightening of financial conditions), losses are amplified, balance sheets weaken, and credit contracts abruptly, turning what might otherwise be a moderate disturbance into a broader downturn.
Market conduct regulation addresses a different vulnerability, rooted in the informational and bargaining-power asymmetries between financial institutions and their clients. In good times, this asymmetry may not be apparent. But a conduct failure (such as mis-selling, an undisclosed conflict of interest, or a breakdown in market integrity) can trigger a loss of confidence that reduces market participation and liquidity, independently of any deterioration in institutions’ balance sheets. Both pillars can therefore allow what would otherwise be a contained problem to develop into broader instability, albeit through different mechanisms: prudential regulation guards primarily against a balance-sheet channel, whereas market conduct regulation addresses a confidence channel.
Prudential regulation, through tools such as capital and liquidity requirements, leverage limits, and countercyclical buffers, is designed to dampen the described amplification mechanism. By constraining risk-taking and strengthening balance sheets, these measures aim to reduce the sensitivity of the financial system to adverse shocks and limit the likelihood of systemic distress. In this classic view, policy is characterized by a clear trade-off: greater regulatory stringency tends to restrain credit expansion and risk-taking, which may weigh on growth in normal times. At the same time, it is expected to reduce the frequency and severity of crises by limiting the propagation of negative shocks. The implicit assumption is that the stability gains outweigh the costs in terms of forgone growth. This logic underpins much of the post-crisis regulatory architecture, as well as a large empirical literature examining the relationship between regulatory stringency and systemic risk. Market conduct regulation is subject to an analogous, though less formalized, logic: stricter disclosure, suitability, and conduct requirements are assumed to protect the confidence and integrity on which market participation depends, albeit at the cost of higher compliance costs for regulated entities.
Yet this framework, across both pillars, typically omits a crucial cost margin: even where it acknowledges that tighter constraints weigh on activity in the short run, it does not model the direct resource and administrative costs of compliance, or their effect on intermediaries’ own balance sheets. This omission has important consequences. By abstracting from the resource costs of compliance, the standard framework evaluates stability-oriented policies solely through their effect on the amplification of shocks or the erosion of confidence, without accounting for the fact that meeting these regulatory requirements is itself costly and that those costs fall on the very institutions the regulations are intended to make more resilient. As a result, it may understate the true cost of regulation and provide an incomplete account of its impact on both growth and resilience.
Moreover, the empirical evidence on whether stricter policies actually reduce systemic risk is mixed: some studies find that tighter regulation improves stability (Ampudia et al. 2021; Bluwstein and Patozi 2024), while others find the opposite effect (Chen 2021). This disconnect between theory and evidence therefore calls for a reassessment of the channels through which regulation affects the economy, including the compliance-cost channel formalized below.
The Compliance-Cost Channel
Survey-based evidence from last year’s scorecard shows that the standard trade-off described above is incomplete (Caracciolo 2025). In practice, regulation is not a simple parameter choice, but a complex set of rules, reporting requirements, and supervisory expectations that must be continuously interpreted, implemented, and monitored. These activities rely on a scarce resource: the time and expertise of financial sector employees.
Stability-oriented measures, in particular, tend to generate substantial compliance overhead. New guidelines, disclosure frameworks, and risk management requirements require firms to mobilize resources across multiple dimensions: dedicated compliance and risk personnel, operational and IT support to implement and maintain systems, and continuous engagement with reporting, auditing, and supervisory processes.
Importantly, these efforts are not confined to specialized compliance units. The survey shows that regulatory tasks are widely distributed across organizations, with employees in core business functions devoting a non-trivial share of their time to compliance-related activities.15In 2024, on average, 73 percent of employees in financially regulated firms had at least some compliance-related duties, and close to 8 percent spent the majority of their time (75-100 percent) on such tasks (Caracciolo 2025). This burden is especially pronounced for smaller institutions, which are less able to spread fixed costs and therefore face disproportionately higher compliance intensity.
The key implication is that these costs are not neutral. Compliance activities are ultimately financed out of the same pool of resources that supports intermediation, investment, and loss absorption.16The strength of this effect depends on how much of the compliance burden institutions can pass on. In concentrated markets such as Canadian deposit-taking and life insurance, firms may recover part of these costs through pricing rather than absorbing them fully out of net worth, which would attenuate the balance-sheet channel for larger institutions. Smaller institutions, with less pricing power and a proportionally heavier burden, are correspondingly less able to do so. Time and capital devoted to regulatory obligations are therefore diverted away from productive activities and balance-sheet strengthening. In this sense, regulation operates not only by constraining risk-taking from above, but also by eroding the underlying resource base from below. By reducing the effective net worth available to absorb shocks, compliance costs can leave institutions closer to their critical solvency threshold, even as formal constraints on leverage are tightened.
A Simple Model of the Stability-Growth Trade-Off
To formalize these ideas, the paper develops a simple macro-financial framework in which economic activity depends on the availability of productive capital, and capital formation is intermediated by the financial system. Aggregate output is given by a linear production function
Yt= Akt where A > 0 is total factor productivity and kt is the aggregate capital stock, entirely funded by a representative financial intermediary:
Kt = Nt+ Dt, with Nt denoting the net worth (equity), and Dt debt.
The key variable in the model is intermediaries’ net worth: the more capital they hold, the more they can expand balance sheets, support credit, and sustain output. Conversely, when net worth is depleted, credit contracts and economic activity slows.
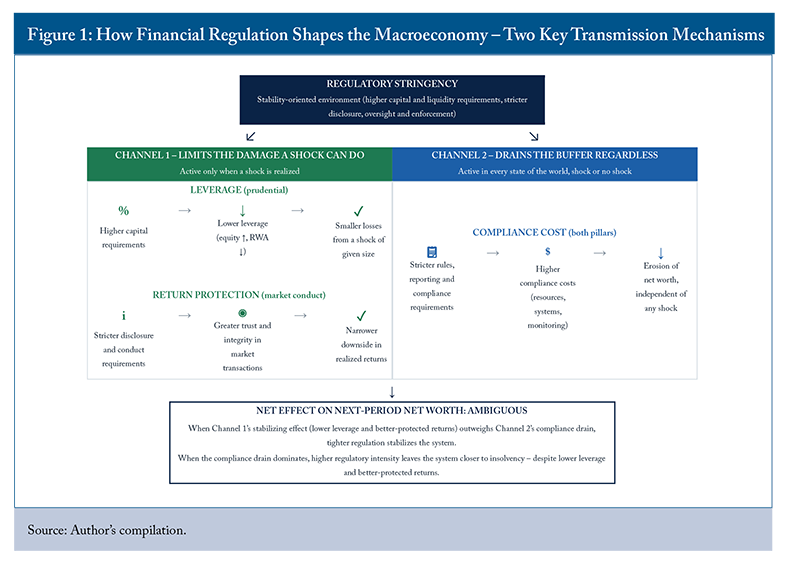
Within this environment, stability-oriented regulation affects the economy through different channels. The first limits the damage that a shock can cause: prudential regulation, through leverage constraints, and market conduct regulation, through its influence on the shocks intermediaries actually face, both operate through this channel, although via distinct mechanisms discussed in the next subsection.
The second channel, common to both pillars but more subtle and often overlooked, works in the opposite direction: regulation itself is costly to comply with, and those costs directly erode net worth, regardless of whether a shock occurs. Their interaction lies at the core of the trade-off highlighted in this paper. The model’s intuition is summarized in Figure 1.
Leverage and Market Conduct Channels
This section formalizes the first channel through its two margins in turn, starting with leverage. Agency frictions limit how much the intermediary can borrow relative to its equity, giving rise to a borrowing constraint Dt ≤ λtNt, where λt is the leverage ratio. In normal times, the intermediary
is constrained and operates at this upper bound,
so the capital stock satisfies Kt = (1 + λt)Nt and output is directly proportional to net worth:
Yₜ = A(1 + λₜ)Nₜ. Between periods, the intermediary earns a stochastic gross return Rt+1 on its assets and pays a constant gross rate R_D on its liabilities. Net worth then evolves as:
Nt+1 = Nt [Rt+1 + λₜ(Rt+1 − RD)]
This expression makes the role of leverage transparent: when returns are high, leverage amplifies gains; when returns are low, it amplifies losses. Financial distress (i.e., the event Nt+1 = 0) occurs whenever the realized return falls below a critical threshold R*(λₜ) = RD λₜ/(1 + λₜ), which is strictly increasing in leverage. Higher leverage therefore raises the return level below which the intermediary is wiped out. In this sense, leverage acts as a shock amplification parameter. Prudential regulation operates directly on this margin: by constraining risk-taking and limiting leverage, it reduces the sensitivity of balance sheets to adverse shocks and lowers the probability that losses translate into widespread financial distress. Taken in isolation, this channel delivers the standard result: stronger regulation enhances stability, albeit at the cost of restraining credit expansion and output in normal times.
The leverage channel above takes the distribution of returns, Rt+1, as given. Leverage determines how a shock of a given size translates into gains or losses, but it says nothing about where the shock itself comes from. This is where the second margin operates: market conduct regulation, alongside (rather than through) the leverage mechanism. Think of Rt+1 not as a fixed law of nature, but as partly reflecting the health of the market in which intermediaries operate: how much participants trust the prices they see, how willing they are to keep trading and lending to one another, and how easily assets can be sold without moving prices against them.
A conduct failure (such as mis-selling, an undisclosed conflict of interest, or a breakdown in disclosure) can damage exactly that trust. When it does, liquidity dries up, funding gets more expensive, and the range of possible outcomes for Rt+1 shifts for the worse, quite apart from anything happening to any single institution’s leverage. In other words, conduct problems do not make institutions more exposed to a shock of a given size (that is the leverage channel). They make bad shocks more likely, or worse, in the first place, by weakening the market conditions that Rt+1 is drawn from. Market conduct regulation therefore works on this second margin: by protecting the trust and integrity on which liquid, well-functioning markets depend, it narrows the downside of the return distribution itself, rather than cushioning institutions against a given draw from it.17This channel is formally modelled in online Appendix B.
Overall, these two margins deliver the standard result familiar from the literature: stronger regulation enhances stability, albeit at the cost of restraining credit expansion and output in normal times.
Compliance Costs and Balance-Sheet Buffers
The second channel captures the resource cost of implementing and maintaining regulatory frameworks. Unlike the channel above, which operates on the size and likelihood of the damage a shock can do (whether through leverage or the returns intermediaries earn), this mechanism operates through a cumulative drain on intermediaries’ resources, independent of any shock. Regulatory compliance requires institutions to allocate labour, capital, and managerial attention to a wide range of non-productive activities: reporting, monitoring, internal controls, audits, and ongoing interactions with supervisors. These costs are recurrent and must be financed out of the institution’s own resources.
In the model, this is captured by a compliance cost function C(st) (strictly increasing in the intensity of stability-oriented regulation st) that enters directly into the net worth law of motion:
Nt+1 = Nt [Rt+1(st) + λₜ(st)(Rt+1 (st) − RD)] – C(st)
Importantly, C(st) is subtracted from net worth regardless of the realization of Rt+1(st): compliance costs are paid in good states and bad states alike. As a result, the system enters each period with a smaller buffer available to absorb potential losses. The distress threshold now becomes:
θ(st, Ct) = [RD λₜ(st) + C(sₜ)/Nₜ]/(1 + λₜ(st)), which is increasing in both leverage and compliance costs.
Note that the return-protection channel does not enter this threshold directly: rather than shifting the threshold itself, tighter regulation shifts the distribution of Rt+1 (st) around it, narrowing the odds of a realization bad enough to breach it. All three channels are therefore jointly at work: leverage and compliance costs determine how exposed the system is at a given threshold, while regulatory intensity’s effect on returns determines how likely it is that a shock will breach that threshold. Compliance costs act as a gradual deterioration of resilience on the first margin, bringing institutions closer to the threshold, even as regulation simultaneously narrows the odds of a bad draw on the second.
Revisiting the Stability-Growth Trade-Off
In this context, these channels imply that the effects of stability-oriented regulation are ambiguous. To see this precisely, consider how next-period net worth responds to a marginal tightening of regulatory intensity. With linear functional forms λ(st) = λ – αst, γ(st) = γ – δst, and C(st) = C + βst, the derivative is:


The first term reflects the leverage channel: in bad times (Rt+1 (st) < RD), it turns positive because lower leverage dampens losses, representing the classic stabilizing effect. The second term reflects the return-protection channel: whenever a market-confidence shock is realized (ξt+1 > 0), narrowing its transmission into returns also protects net worth. Both terms operate on the same margin: how exposed net worth is to a shock, even though they act through different parts of the balance sheet. The third term, –β, is always negative: it captures the compliance drain, which operates in every state of the world, whether or not a shock occurs at all, and regardless of how the first two terms net out.
The overall effect of tighter regulation therefore depends on which forces dominate. When the first two terms together outweigh β, the stabilizing effect of tighter regulation prevails: net worth is better protected against shocks than it is drained by compliance costs. But when β is large relative to α and δ, the drain dominates even in bad states, and higher regulatory intensity leaves the system closer to insolvency despite lower leverage and better-protected returns. Even where outright fragility does not increase, the net outcome may be characterized by lower growth with little or no measurable improvement in stability. This possibility, that a regulatory regime can simultaneously reduce shock exposure and erode the very buffers meant to absorb shocks, is absent from the standard framework and is central to the analysis. The full derivation is provided in online Appendix B. The next section shows the described effects through simulations.
Illustrating the Model
Before turning to the data to assess where Canada stands, it is useful to quantify the implications of the mechanism described above through a simple illustrative example. The paper simulates the model developed in the last section under three regulatory cost regimes (low, medium, and high) to examine how the probability of financial distress evolves as the policy stance becomes more strongly oriented toward stability. For each cost regime, the simulation computes how the implied probability of financial distress evolves when regulatory tightness increases by exposing the system to a fixed distribution of random shocks, thereby isolating the effect of policy from changes in the external environment. The simulation incorporates the leverage and compliance-cost channels; the return-protection channel is set aside here, since no comparable external target exists to discipline how strongly regulatory intensity narrows the distribution of realized returns, and the paper does not calibrate this parameter without one.18Even though the simulation does not model the link between s and the distribution of Rt+1, the fixed shock distribution used throughout is not a neutral or average-case choice: its level is set to be narrow and well-contained, consistent with the kind of conditions strong market conduct regulation would generate. This is a deliberate upper-bound assumption on the benefit that the channel could deliver, rather than an attempt to model it directly.
The regulatory stance is modelled as an index of policy intensity, which captures the extent to which regulation is tilted toward stability-oriented measures. The index ranges from zero to one: higher values correspond to a stronger emphasis on risk containment within the regulatory framework.
To discipline the model quantitatively, the paper proceeds in two steps. First, it calibrates the leverage channel so that moving from a low- to a high stability-oriented regulatory environment reduces leverage by approximately 15-20 percent, consistent with existing literature.19This calibration is chosen to be in line with the magnitude of leverage adjustments typically obtained in quantitative models of bank capital regulation. For example, see: Begenau and Landvoigt (2021) and Elenev, Landvoigt, and Van Nieuwerburgh (2021). This ensures that the stabilizing effect of tighter constraints operates within a realistic range.
Second, compliance costs are modelled using a simple linear specification, in which higher regulatory intensity leads to a proportional increase in the share of resources devoted to compliance-related activities. As explained, the key parameter governing this relationship can take three different values (corresponding to the three different cost regimes), and is calibrated so that, in the medium-cost scenario, a highly stability-oriented regime implies a level of resource absorption comparable to that observed in the survey20In the medium regime (s=1), C=0.18, implying compliance absorbs ~18 percent of firm resources under high stability-orientation, matching the survey general results. Low-cost regime (C=0.1) reflects efficient large-bank compliance; high (C=0.26) captures small-firm realities. (i.e., that compliance activities account for a substantial share of organizational effort). In this sense, the medium cost scenario serves as a benchmark grounded in empirical magnitudes, while the low- and high-cost scenarios span a range of less and more resource-intensive regulatory environments.21Results do not hinge on the linear functional form for regulatory cost. What matters is that compliance costs increase with regulatory intensity. The linear specification simply provides a transparent and tractable benchmark for illustrating the mechanism.
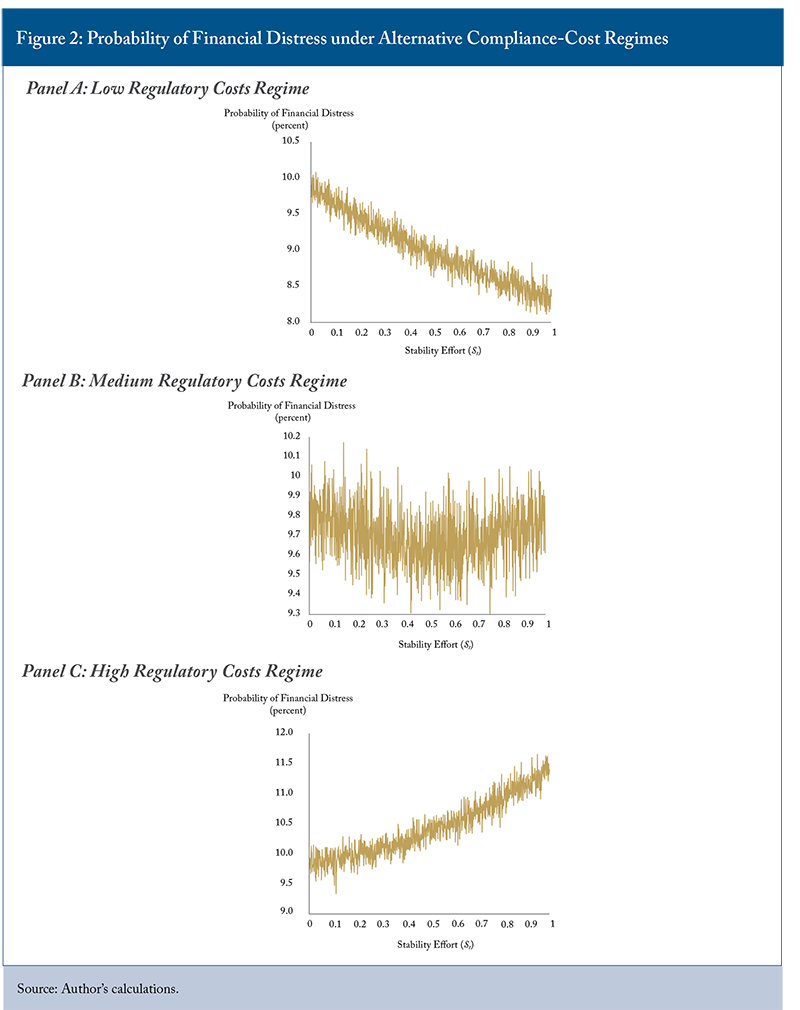
The results reveal a clear and intuitive pattern (Figure 2).22The curves may appear “spiky” due to the threshold nature of distress and the use of finite simulations: small changes in regulatory intensity can generate discrete jumps in outcomes. The relevant information is the overall direction of the curve: a downward (upward) trend indicates that the probability of distress falls (rises) with regulatory intensity, while a flat pattern indicates offsetting effects. In the low-cost environment (panel A), increasing the emphasis on stability reduces the probability of distress. In this case, the reduction in leverage dominates (given a shock distribution already calibrated to reflect strong market conduct regulation), and the standard stabilization mechanism prevails.
In the medium-cost scenario (panel B), the two channels broadly offset each other. While tighter regulation reduces the amplification of shocks, the associated compliance costs erode balance-sheet buffers to a comparable extent. As a result, the relationship between regulatory intensity and stability becomes largely flat.
In the high-cost environment (panel C), the relationship reverses. As regulatory effort becomes increasingly biased toward stability, the erosion of net worth induced by compliance costs dominates the reduction in leverage, and the probability of distress rises.
The curves in Figure 2 plot the distress probability derived in online Appendix B (section B.7) as the stability effort index varies. The short vertical segments reflect the finite set of simulated net-worth draws at each level of effort, over which the distress threshold is evaluated. The main feature is the overall slope of each panel.
Altogether, these results illustrate the central mechanism of the model. Shifting regulatory effort toward stability-oriented measures simultaneously reduces shock amplification and the system’s capacity to absorb shocks. Whether the overall effect is stabilizing or destabilizing depends on the relative strength of these two forces.
Crucially, this ambiguity is not driven by a particular calibration. It arises whenever compliance costs respond sufficiently strongly to increases in regulatory intensity relative to the reduction in leverage, making it a general implication of the framework. Notably, this result holds despite a shock distribution deliberately set to reflect strong market conduct regulation; a less favourable assumption about this channel would only reinforce the pattern, not overturn it.
From a policy perspective, this implies that increasing the emphasis on stability-oriented measures does not necessarily translate into greater resilience, particularly in environments where the resource cost of regulation is significant.
Measuring Stability-Oriented Policy
The analysis now turns to the data to assess how the theoretical framework is reflected in the Canadian experience. The empirical analysis focuses on the leverage and compliance-cost channels described above because reliable, time-varying data exist for prudential policy actions, whereas no comparable measure of market conduct intensity is available, making an equivalent empirical test of the return-protection channel infeasible at this stage.
To bring the framework to the data, an empirical proxy is needed for the intensity of stability-oriented policy.23This scorecard is only in its third edition and doesn’t therefore provide enough data points to be used in an empirical study. The paper constructs a stability effort index using the International Monetary Fund’s (IMF) Integrated Macroprudential Policy (iMaPP) database, which records policy actions in Canada across a broad set of macroprudential instruments, including capital buffers, loan-to-value and debt-to-income limits, reserve requirements, and related tools. The measure is based directly on the iMaPP tightening index, which captures the number of tightening actions implemented within each period across all available instruments. This index provides a simple and transparent measure of how actively regulators are leaning toward tighter, stability-oriented prudential policies at a given point in time. Periods with higher values correspond to more intensive regulatory tightening, while lower values indicate limited policy activity. As such, it provides a natural empirical proxy for the concept of stability effort underlying the framework.24This proxy, like the simulation in the previous section “Illustrating the Model,” speaks to the leverage and compliance-cost channels specifically: the iMaPP database records actions on capital, leverage, and related prudential instruments, with no equivalent measure of market conduct intensity. The regression results that follow should accordingly be read on those terms.
Empirical Strategy
With this measure in hand, the analysis turns to the empirical core of this exercise: how does macroprudential tightening affect economic performance in Canada? The analysis focuses on two dimensions that directly correspond to the trade-off highlighted in the model:
- economic growth, which captures the cost side of regulation; and,
- resilience, proxied by the likelihood of entering a recession,25In the empirical analysis, the OECD Recession Indicator is used. A binary 0-1 time series variable takes the value 1 during a recessionary period and 0 otherwise. This indicator is constructed using a two-part methodology that identifies the beginning (peak) and end (trough) of economic downturns. which captures the intended benefit.
Regulatory Intensity and Growth
To evaluate the impact on economic activity, the analysis estimates a set of time-series regressions in which current output growth is related to lagged values of the stability effort index.26See online Appendix C for a discussion of the data and the regressions. The use of lags is central to the identification strategy. Macroprudential policies are of course inherently forward-looking: regulators tend to tighten when vulnerabilities are building, not after the downturn has already occurred. Relating contemporaneous policy to contemporaneous outcomes would risk conflating policy actions with the conditions that triggered them. By focusing on lagged stability effort, the analysis instead asks a cleaner question: how does yesterday’s regulatory stance shape today’s economic performance?
To isolate the independent effect of regulation, the regressions include a comprehensive set of control variables identified in the literature that capture other drivers of the business cycle. These include measures of global financial conditions, such as risk sentiment, the domestic monetary policy stance, indicators of economic policy uncertainty, and variables capturing the position of the credit cycle. Lagged output growth is also included for two reasons. First, it captures persistence in economic activity, and second, it mitigates omitted-variable bias arising from the serial correlation of the business cycle. Because both regulatory actions and output growth respond to evolving cyclical conditions, failing to control for lagged growth would risk attributing predictable momentum in economic activity to past regulatory policy. Overall, this specification identifies the relationship between sustained macroprudential tightening and subsequent economic growth, conditional on a broad set of macro-financial influences.
Regulatory Intensity and Resilience
Assessing the impact of stability-oriented regulation on resilience requires a different lens. Rather than focusing on average growth, the analysis examines the likelihood of adverse macroeconomic outcomes. Specifically, it estimates a Probit model in which the dependent variable indicates whether the economy is in a recession or not.
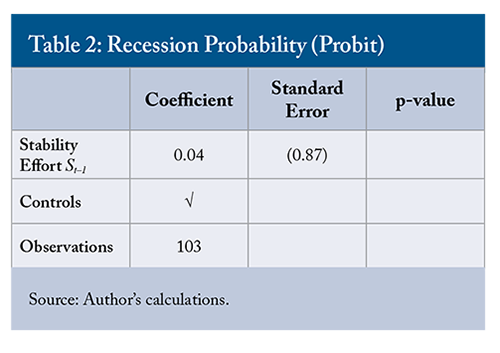
Recession incidence is the natural summary statistic for this test. As explained above, the rationale for stability-oriented regulation is to reduce the likelihood that adverse shocks propagate into a systemic downturn, and a lower recession probability is precisely the outcome the standard framework predicts.27Recession depth and duration are related but distinct margins that the binary indicator does not speak to directly. A regulatory regime could in principle reduce the severity of downturns without changing their frequency. The results should be read as evidence on whether tighter regulation reduces the odds of a recession occurring, which is the central and most policy-relevant test of the standard framework’s own logic. The explanatory variables mirror those used in the growth analysis: lagged stability effort and the same set of macro-financial controls. This approach directly tests the core prediction of the standard framework: if stability-oriented regulation is effective, periods of stronger regulatory effort should be associated with a lower probability of entering a recession, all else equal.
Findings: Clear Costs, Elusive Stability Gains
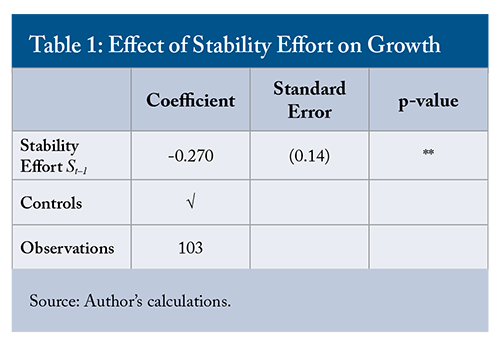
The empirical results reveal a consistent and economically meaningful pattern. On the growth side, tighter macroprudential regulation is systematically associated with lower subsequent output growth. This relationship is robust across specifications and different sets of control variables. In practical terms, periods characterized by sustained regulatory tightening tend to be followed by weaker economic performance. Table 1 reports the results of the growth regression. The coefficient on lagged stability effort is negative and statistically significant, consistent with a meaningful drag on output.
On the stability side, however, the evidence is much less supportive of the standard narrative. In the Probit framework, the estimated effect of stability effort on the probability of recession is small and statistically indistinguishable from zero once macro-financial conditions are considered. In short: the data point to a situation in which the costs of regulation are clearly visible, while the benefits are much harder to detect. Table 2 reports the Probit estimates. The coefficient on stability effort is close to zero and statistically insignificant, indicating no measurable improvement in stability.
Linking the Empirical Findings to the Theoretical Framework
The findings clearly highlight the effects of the traditional channel: by constraining leverage and tightening balance sheet conditions, macroprudential regulation dampens credit expansion and weighs on growth. However, the absence of measurable stability gains suggests that this channel does not operate in isolation. The cost channel, through which compliance requirements absorb resources and erode intermediaries’ effective net worth, appears to offset the stabilizing effects of lower leverage. As a result, while shocks may be less amplified, the system may also start from a weaker buffer position, leaving overall resilience largely unchanged.
The net effect is a system that is more constrained, but not demonstrably safer. The empirical design identifies the macroprudential margin rather than the full compliance burden directly, so the offset between the two channels is inferred from the model rather than measured directly. Nevertheless, the pattern itself is informative. With no significant financial institution failure in Canada for more than 25 years, these results are exactly what would be expected from a system operating beyond the point of measurable marginal stability benefits. The analysis indicates that Canada is likely past that point.
Conclusions and Policy Implications
The central policy implication of the analysis is that the costs of regulation cannot be treated as secondary. As the scorecard has made clear, cost-benefit analysis is largely absent from regulatory practice, suggesting that these costs are not systematically incorporated into policy design. Analysis of the regulators’ mandates has shown that this reflects a system of priorities that places stability and resilience above all else. But even from this perspective, ignoring costs and sacrificing efficiency in the name of stability is a strategic mistake.
The empirical results reinforce this point for the channel tested here: regulatory costs can work against the very objective they are meant to serve because reducing intermediaries’ net worth partially offsets the stabilizing effect of tighter constraints on leverage. The bottom line is simple: stability and efficiency are not competing objectives to be traded off against one another. When compliance costs are significant, neglecting efficiency undermines stability itself.
The relevant policy question, and the future challenge for Canada’s regulators, is therefore not how much stability to pursue at the expense of efficiency, but how to design regulation that achieves stability without unnecessarily absorbing resources. Integrating cost considerations into the regulatory framework is a necessary condition for effective stability policy.
References
Alam, Zohair, Adrian Alter, Jesse Eiseman, Heedon Kang, Machiko Narita, Erlend Nier, and Naixi Wang. 2019. “Digging Deeper–Evidence on the Effects of Macroprudential Policies from a New Database.” IMF Working Paper 19/066. Washington, DC: International Monetary Fund.
Ampudia, Miguel, Marco Lo Duca, Mátyás Farkas, Gabriel Perez-Quiros, Gerhard Rünstler, and Eugen Tereanu. 2021. “On the Effectiveness of Macroprudential Policy.” ECB Working Paper 2559. Frankfurt: European Central Bank.
Baker, Scott R., Nicholas Bloom, and Steven J. Davis. 2016. “Measuring Economic Policy Uncertainty.” Quarterly Journal of Economics 131(4): 1593–1636.
Barth, James R., Gerard Caprio Jr., and Ross Levine. 2001. Bank Regulation and Supervision: What Works Best? Basel: Bank for International Settlements.
Begenau, Juliane, and Tim Landvoigt. 2021. “Financial Regulation in a Quantitative Model of the Modern Banking System.” NBER Working Paper 28501. Cambridge, MA: National Bureau of Economic Research.
Bernanke, Ben, and Mark Gertler. 1989. “Agency Costs, Net Worth, and Business Fluctuations.” American Economic Review 79(1): 14–31.
Blanchard, Olivier, Giovanni Dell’Ariccia, and Paolo Mauro. 2013. “Rethinking Macro Policy II: Getting Granular.” IMF Staff Discussion Note SDN/13/03. Washington, DC: International Monetary Fund.
Bluwstein, Kristina, and Alba Patozi. 2024. “The Effects of Macroprudential Policy Announcements on Systemic Risk.” Bank of England Working Paper 1080. London: Bank of England.
Bourque, Paul C., and Gherardo Gennaro Caracciolo. 2024. The Good, the Bad and the Unnecessary: A Scorecard for Financial Regulations in Canada. Commentary 664. Toronto: C.D. Howe Institute.
Caracciolo, Gherardo. 2025. Pruning the Rulebook: Canada’s Financial Regulatory Scorecard, Year Two. Commentary 694. Toronto: C.D. Howe Institute.
Cecchetti, Stephen G., and Enisse Kharroubi. 2012. Reassessing the Impact of Finance on Growth. BIS Working Paper 381. Basel: Bank for International Settlements.
Chen, L., H. Li, F.H. Liu, et al. 2021. “Bank Regulation and Systemic Risk: Cross-Country Evidence.” Review of Quantitative Finance and Accounting 57: 353–387.
Eichenbaum, Martin, Michelle Alexopoulos, and Jeremy M. Kronick. 2024. “Lagging Productivity Not Just a Number, It’s Making us Poorer.” Intelligence Memo. Toronto: C.D. Howe Institute. August 14.
Elenev, Vadim, Tim Landvoigt, and Stijn Van Nieuwerburgh. 2021. “A Macroeconomic Model with Financially Constrained Producers and Intermediaries.” Econometrica 89(3): 1361–1418.
Estrella, Arturo, and Frederic S. Mishkin. 1998. “Predicting U.S. Recessions: Financial Variables as Leading Indicators.” Review of Economics and Statistics 80(1): 45–61.
Gertler, Mark, and Nobuhiro Kiyotaki. 2010. “Financial Intermediation and Credit Policy in Business Cycle Analysis.” In Handbook of Monetary Economics, Vol. 3, edited by Benjamin M. Friedman and Michael Woodford, 547–599. Amsterdam: Elsevier.
Goff, Brian L., et al. 1996. Regulation and Macroeconomic Performance. Vol. 21. New York: Springer Science & Business Media.
Gu, Wulong. 2025. Regulatory Accumulation, Business Dynamism and Economic Growth in Canada. Analytical Studies Branch Research Paper Series 481. Ottawa: Statistics Canada.
Kiyotaki, Nobuhiro, and John Moore. 1997. “Credit Cycles.” Journal of Political Economy 105(2): 211–248.
Miranda-Agrippino, Silvia, and Hélène Rey. 2021. “The Global Financial Cycle.” NBER Working Paper 29327. Cambridge, MA: National Bureau of Economic Research.
Robson, William B.P., and Mawakina Bafale. 2024. Underequipped: How Weak Capital Investment Hurts Canadian Prosperity and What to Do about It. Commentary 666. Toronto: C.D. Howe Institute. September.
Schularick, Moritz, and Alan M. Taylor. 2012. “Credit Booms Gone Bust: Monetary Policy, Leverage Cycles, and Financial Crises, 1870–2008.” American Economic Review 102(2): 1029–1061.
Trebbi, Francesco, Miao Ben Zhang, and Michael Simkovic. 2023. “The Cost of Regulatory Compliance in the United States.” USC Marshall School of Business Research Paper. Los Angeles: University of Southern California.