To: Provincial ministries of education
From: Lucia Tramonte and Herbert Emery
Date: September 9, 2026
Re: Knowledge Economy, With Little Knowledge: Canada’s Dismal Math Scores
Strong numeracy skills are essential for Canada to remain globally competitive, build a knowledge economy and ensure its youth can fully participate in society.
Yet for about two decades, Canadian 15-year-olds’ mathematics skills, as measured by the OECD’s Programme for International Student Assessment (PISA), have declined in every province. As our aspirations for a knowledge economy went higher, our educational outcomes sank steadily lower.
For years, Canadian politicians and economists have promised a “knowledge economy” future. In the 2000s, Tom Courchene and many others argued that Canada’s prosperity would come from transitioning to a knowledge economy requiring a higher human capital workforce. Recent federal budget speeches highlight the need to invest in skills and training that workers will need for the “good-paying jobs of tomorrow,” and now, Ottawa’s “AI for All” strategy has set a goal of 250,000 AI-related jobs.
Despite all of that, Canadian youth showed no advance in these skills and for most, the skills declined.
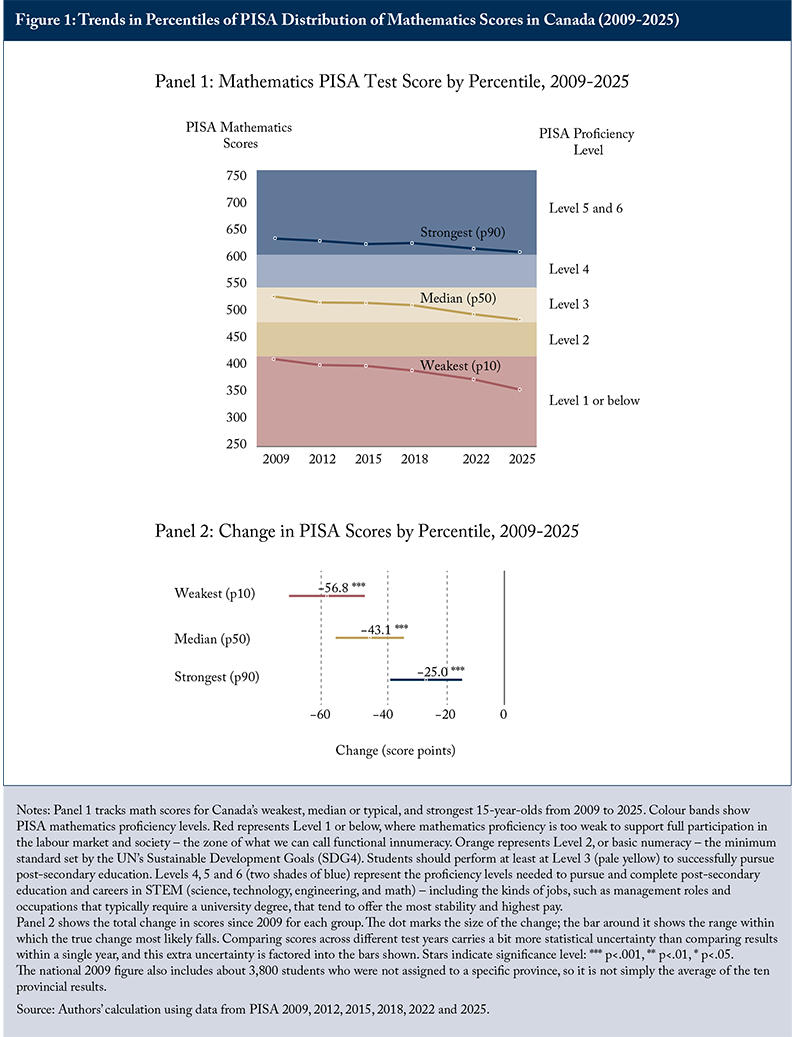
Between 2009 and 2025, across all provinces, PISA mathematics performance deteriorated and the deterioration was concentrated at the bottom of the distribution. The decline was roughly three times worse for the weakest students than for the strongest.
To put these changes in perspective, about 20 points on the PISA scale is equivalent to roughly one year of learning. Our analysis of publicly available PISA data for Canada from 2009, 2012, 2015, 2018, 2022 and 2025 is represented in Figure 1, and shows the stark decline: The weakest students, at the 10th percentile, lost about 2.5 years of learning; at the median, 2.0; the strongest, at the 90th percentile, 1.1. The decline was therefore roughly three times larger for the weakest students than for the strongest, and the distance between 10th percentile and 90th percentile widened by about a year and a half of learning.
The decline at the bottom of the distribution is alarming because it points to a growing number of youth entering adulthood with weak numeracy skills and greater economic vulnerability. But the losses extend beyond the weakest students, showing another important socio-economic cost for provinces.
Fewer students are now reaching the higher levels of mathematical proficiency that can help prepare them for post-secondary STEM pathways. Expressing each percentile's distance from that line in years of learning answers a concrete question: how much of the age cohort is still within reach of a STEM program, and how far the rest would have to travel to get there.
STEM readiness – which we define as scoring at a minimum 544.7 points in the mathematics PISA test or being proficient at least at Level 4 – has moved from a near-majority standard for Canadian 15-year-olds in 2009 to one met by only one-quarter of 15-year-olds in 2025. The share of 15-year-olds meeting this STEM-readiness threshold dropped sharply between 2009 and 2025. Across provinces, it declined from between 26 percent and 52 percent in 2009 to between 16 percent and 34 percent in 2025. New Brunswick had the smallest share of STEM-ready youth at 15.8 percent in 2025, down from 27.1 percent in 2009. Quebec retains the largest share of its youth STEM-ready, 33.9 percent, but is down from 51.7 percent in 2009. By 2025, no province has a median student performing at Level 4, and the decline in the median proficiency ranges from 2.1 years of learning in Quebec to a disastrous 4.8 years in New Brunswick.
This deterioration has consequences for Canada’s future talent pipeline. If the difference between the share of 15-year-olds reaching Level 4 or higher in 2009 and 2025 is applied to the 2025 population of 15-year-olds, the results imply that about 66,000 fewer young people per year are ready for post-secondary STEM study. This represents an enormous loss of potential human capital at a time when Canada needs more, not fewer, young people prepared to pursue STEM education and careers. For perspective, about 170,000 domestic students entered the first year of a university bachelor’s program in Canada in 2023/24.
Canadian provinces spend heavily on education in a system that is highly decentralized in administration and curriculum, and remarkably weak in accountability for outcomes.
It would be one thing if provincial governments recognized the problem but were struggling to fix it. They have the data, but we wonder whether they are even aware of the growing social and economic costs of declining, but reversible, educational outcomes.
Lucia Tramonte is a professor of sociology and Herbert Emery a professor of economic and political science at the Atlantic Institute for Policy Research, University of New Brunswick.
To send a comment or leave feedback, email us at blog@cdhowe.org.
The views expressed here are those of the authors. The C.D. Howe Institute does not take corporate positions on policy matters.