






The Study In Brief
Despite improvements over time, the quality of the financial information presented to legislators and the public by Canada’s federal, provincial and territorial governments remains uneven. Some governments stand out for the transparency, quality and timeliness of their financial documents; others, however, present information that is opaque, misleading and late.
Canada’s senior governments raise and spend huge amounts, and have legally unlimited capacity to borrow when their revenues falls short of their expenses. Holding public officials accountable for their use of these funds is a foundational task of representative government. In pursuit of such accountability, citizens and taxpayers have a number of tools: the budgets governments present around the beginning of the fiscal year; the estimates legislatures vote to approve specific programs and the audited financial statements governments present in their public accounts after year-end.
The C.D. Howe Institute’s annual report card on the usefulness of these government financial documents assigns letter grades that reflect how readily an interested but non-expert user may find, understand and act on the information therein. In this year’s report card, which covers financial statements for fiscal year 2018/19 and budgets and estimates for 2019/20, New Brunswick tops the class with an A; British Columbia and Saskatchewan, each with A–, come close behind. At the other end of the scale are Yukon, with a D+, and the Northwest Territories and Nunavut, each with D–.
Alberta, with a B+, and Ontario and Nova Scotia, each with B this year, could join the top rank next year with relatively small improvements, such as moving key numbers closer to the front of their budgets and more timely presentation and publication. The federal government, which earned a B–, could raise its grade with similar changes – but its failure so far to produce a budget at all for 2020/21 prefigures a failing grade next year.
Two decades ago, none of Canada’s senior governments budgeted and reported its revenues, expenses and bottom line on the same accounting basis; today, accounting consistent with public sector accounting standards is the rule. Canada’s governments, however, can do better. This annual report card hopes to encourage further progress and limit backsliding. If Canadians demand more transparent financial reporting and better fiscal accountability from their governments, they can get it.
Note to readers: This is a revised version, with corrections to some of the past grades in Table 2.
Introduction
Canada’s federal, provincial and territorial governments loom large in the Canadian economy and in Canadians’ lives.
In the 2019 calendar year, they raised and spent more than $845 billion – around 40 percent of gross domestic product, or more than $22,000 per Canadian – a number that responses to the COVID-19 crisis have swelled further. In addition to health and education services, these governments’ functions range from national defence and policing to income support and business subsidies. They tax Canadians’ incomes from work and saving, and they tax the consumption of most goods and services. They borrow billions of dollars to cover the difference between their revenues and expenses: as of 2019, their combined net financial liabilities amounted to $1.2 trillion – a figure that is rising rapidly – on which they paid more than $63 billion in interest that year (Statistics Canada 2019).
Effective representative government exists when taxpayers and citizens can monitor, influence and react to how legislators and officials manage public funds. Ensuring that legislators and government officials (who act on behalf of taxpayers and citizens) behave responsibly, rather than negligently or in self-interest, is a particular challenge. Governments have extraordinary powers to extract resources from citizens, but they do not always follow the same rules they impose on citizens.
Financial reports are key tools for monitoring governments’ performance of their fiduciary duties. The audited financial statements a government publishes in its public accounts after the end of each fiscal year include much useful information. In particular, the statement of operations shows the government’s revenues and expenses during the year and the difference between them: its surplus or deficit. The statement of financial position shows the government’s assets – both financial and capital – and its liabilities. The difference between its assets and liabilities – its net worth – is a key indicator of the government’s capacity to provide services.
Similarly, citizens and taxpayers, and the legislators who represent them, can examine the budget a government presents at the beginning of the fiscal year – notably, its commitments with respect to revenues and expenses and the projected surplus or deficit, with the change in net worth that the surplus or deficit is expected to produce.
In addition, the estimates that a government presents to the legislature provide details on spending for which the government must obtain legislative approval. The scope of the estimates is not the same as the expenses that appear in the budget and in the financial statements, as the estimates exclude some entities, such as Crown corporations, and some types of ongoing expenses, such as interest on the public debt. The estimates are nevertheless central to the legislature’s control of public money.
The C.D. Howe Institute’s annual report on the fiscal accountability of Canada’s senior governments focuses on the relevance, accessibility, timeliness and reliability of these documents. Our concern in this report is not whether governments spend and tax too much or too little, whether they run surpluses or deficits or whether their programs are effective or misguided. Rather, our goal is to assess whether Canadians can get the basic information they need to form opinions on these issues and act to correct any problems they discover. Do governments’ budgets, estimates and financial statements let legislators and voters understand their fiscal plans and enable governments to be held account for fulfilling them?
Our perspective in determining the usefulness of these documents is that of an intelligent and motivated but non-expert reader. We ask how readily that reader – who might be a legislator, journalist or concerned citizen – can find the relevant numbers in each document, and use them to compare the revenues and expenses projected at the beginning of the year, and approved by legislators, with revenues and expenses collected and disbursed during the year and by year-end.
Such a reader looking at the fiscal year 2019/20 budgets and estimates and 2018/19 financial statements of New Brunswick, British Columbia and Saskatchewan would find the task easy. These provinces displayed the relevant numbers prominently, and used consistent accounting and aggregation methods in all documents. Related elements of their financial reporting – tables that reconcile results with budget intentions and in-year updates – were also good. Moreover, these provinces tended to produce timely numbers: all three tabled their 2019 budgets before the beginning of the fiscal year, with British Columbia doing so in February, and Saskatchewan releasing its public accounts within three months after the fiscal year-end.
Our reader would have a tougher time with the documents of other governments from these fiscal years. Some governments’ budgets, estimates and/or public accounts used inappropriate and inconsistent accounting and aggregation, impeding understanding of the documents and comparisons among them. Some governments buried the consolidated revenue and expense figures hundreds of pages into a document or even hid them in separate documents.
Some also failed to produce timely documents. Some presented budgets after the fiscal year had started, with money already committed or spent. Some did not present their main estimates simultaneously with their budgets, which impeded scrutiny of individual spending decisions in the context of the fiscal plan. Some did not release their year-end financial statements until most of the following fiscal year had elapsed, undercutting attempts to compare recent performance against a definitive baseline.
These flaws help explain the grades of the worst performers, with Yukon, the Northwest Territories and Nunavut earning the worst grades in this year’s report.
Although our principal focus is on the budgets and reports published in the most recent complete fiscal cycle, we have two comments about the past and the future. Looking back, we are glad to report that, over time, the grades earned by the senior governments have improved. Two decades ago, none of Canada’s senior governments budgeted and reported its consolidated revenues, expenses and bottom line on the same accounting basis; lately, consistent accounting has become the rule. Looking forward, we provide a preview of the scores for the fiscal year 2020/21 budgets and estimates. On this front, the news is mixed. More of the senior governments presented timely documents in the most recent budget cycle, but as of the time of writing the federal government still had not presented a budget nor had it even committed to doing so. This failure of accountability sets Ottawa up for an F on its 2021 report card.
A key aim of this annual survey is to limit backsliding and to encourage further progress. The deficiencies we highlight in this report can be fixed, as improvements by the leading jurisdictions show. Canadians can get good financial reporting from their governments. They should insist on it.
Measuring Fiscal Accountability
To be useful, a financial report for any organization must satisfy certain criteria. It must be relevant to the decisions people need to make. It must be accurate and complete. It must communicate the information in a manner that lets users find and interpret the key numbers.
In the case of governments, an essential minimum is that a reader who is motivated and numerate, but not an expert in accounting, should be able, unaided and in a reasonable amount of time, to identify the consolidated revenue and expense numbers in a government’s principal financial documents and to compare results with intentions. Our focus on these attributes complements some other measures of fiscal transparency, including the Organization for Economic Co-operation and Development’s Best Practices for Budget Transparency (OECD 2002) and the Open Budget Survey (International Budget Partnership 2020).11 The OECD’s “best practices” are somewhat dated – for example, specifying conformity with national income accounting practices, which would be a step backward from Canada’s public sector accounting standards. In other respects, however, the OECD’s criteria for timeliness of budgets and financial reports, clear and consistent reporting of gross amounts in both documents, timely updates relative to plan and informative comparisons of projections with results and vice versa run parallel to ours. The Open Budget Survey awarded the federal government 71 out of 100 for transparency in its 2019 report. Some of its other criteria, including opportunities for public consultation, differ from ours, and it focuses less than we do on the clarity of the financial projections and reports themselves. Nevertheless, there are some key common themes: the Open Budget Survey highlights the limited legislative oversight in Canada’s budget process, recommending earlier presentation of the budget to the legislature, earlier approval of the budget by the legislature and monitoring of in-year budget implementation.
The Fiscal Cycle and Principal Documents
The fiscal year of Canada’s senior governments runs from April 1 to March 31. Two sets of documents come at opposite ends of that cycle. Budgets are forward looking, and should appear before the beginning of the fiscal year. The main estimates are likewise forward looking: they set out particular spending for which a government must obtain the approval of legislators. The financial statements in the public accounts are backward looking in that they provide audited information on actual revenues and expenses and a government’s fiscal health. They appear after the end of the fiscal year, typically in the summer or early fall.
The budget is the core statement of a government’s fiscal priorities. It typically undergoes critical scrutiny in the legislature, with media coverage and attention from the interested public. Its central features are a projected statement of operations – expected revenues and expenses, and the resulting annual surplus or deficit, along with the effect of the surplus or deficit on net worth (the accumulated surplus or deficit). All the figures should be prepared using public sector accounting standards, consistently consolidating and aggregating across entities and functions in the same way the government does in its financial statements.
The estimates that set out particular spending are key links in the chain of accountability from voters through legislators to the officials who actually collect and spend the money. The links we focus on are the main estimates that set out planned spending at the beginning of the fiscal year. Their timeliness and the ease with which legislators can understand their relationship to the larger fiscal plan both figure in our assessment of the quality of governments’ financial reporting.
The audited financial statements in the public accounts are the definitive report of a government’s revenues and expenses during the year and of its net worth at the beginning and end of the year. The financial statements, too, should present a consolidated annual statement of revenues and expenses, with the difference between them equalling the change in the government’s net worth – that is, its accumulated surplus or deficit, which represents its capacity to provide services at the date of measurement – over the year.
Comparing all these documents should be straightforward. With respect to budgets and financial statements, the most recent proposals from the Public Sector Accounting Board say this:
Accountability is better demonstrated in financial statements if the budget is prepared:
- using the same basis of accounting as the financial statements;
- following the same accounting principles used in preparing financial statements;
- for the same scope of activities as those reported on in the financial statements; and
- using the same classifications as the financial statements. (Public Sector Accounting Board 2018, 12)
If this comparison is straightforward, a motivated though non-expert reader will easily be able to answer such questions as how close last year’s results were to last year’s plans, and what kinds of increases or decreases in revenues and expenses this year’s budget would produce relative to last year’s results. If the comparison is not straightforward, even an expert might be hard pressed to answer such questions, and a non-expert would find it impossible.
Although the main estimates do not cover all spending captured in the consolidated expenses in a government’s budget or financial statements, similar logic applies to their presentation. Governments that present estimates simultaneously with their budgets, and provide clear reconciliations of the amounts they are asking legislators to approve with the overall fiscal plan, are being more transparent about their intentions, and provide more helpful context for the spending decisions, than governments that do not.
Many governments also produce interim fiscal reports at intervals as the year progresses. These show performance relative to budget, and some provide updated financial projections for the year. This kind of interim information helps legislators and citizens track in-year progress relative to budget, which can improve understanding of how events affect public finances, and can foster early action if things are going problematically off course. Our survey also looks at the frequency of these reports.
The Quality of Financial Reporting: Key Questions
Going to the next level of detail, we ask the following questions about the accessibility, timeliness and reliability of the documents our reader would consult. With respect to the budget:
- when did the government table it?
- did it present consolidated figures for revenues and expenses?
- were those figures easy to find and identify?
- were those figures consistent with their counterparts in the financial statements?
With regard to the main estimates:
- when did the government table them?
- were the spending items on the same accounting basis as their counterparts in the budget and the financial statements?
- could the reader readily reconcile the estimates with the budget?
With regard to the financial statements in the public accounts:
- when did the government release them?
- did the legislative auditor (auditor general) give a clean (unqualified) opinion on the financial statements?
- were the consolidated financial statements or a summary easy to find and identify?
- did the public accounts clearly explain variances – differences between the results and the budget?
- did the difference between revenues and expenses equal the change in the government’s net worth?
Finally, we ask if the government published inyear updates that let readers see and understand deviations from budget.
How We Graded the Senior Governments’ Financial Documents
Going a layer deeper yet, we proceed to a more detailed discussion of the criteria we used in answering these questions.
Grading Budgets
With respect to the timeliness of budgets, legislators ideally would have sufficient time to consider the government’s fiscal plan, and should certainly vote on the tabled budget bill before the start of the fiscal year. Accordingly, we awarded 0 to governments that presented their 2019/20 budgets after the start of the fiscal year, 1 to governments that presented their budgets within one month before the start of the fiscal year and 2 to governments that presented their budgets more than one month before the start of the fiscal year.
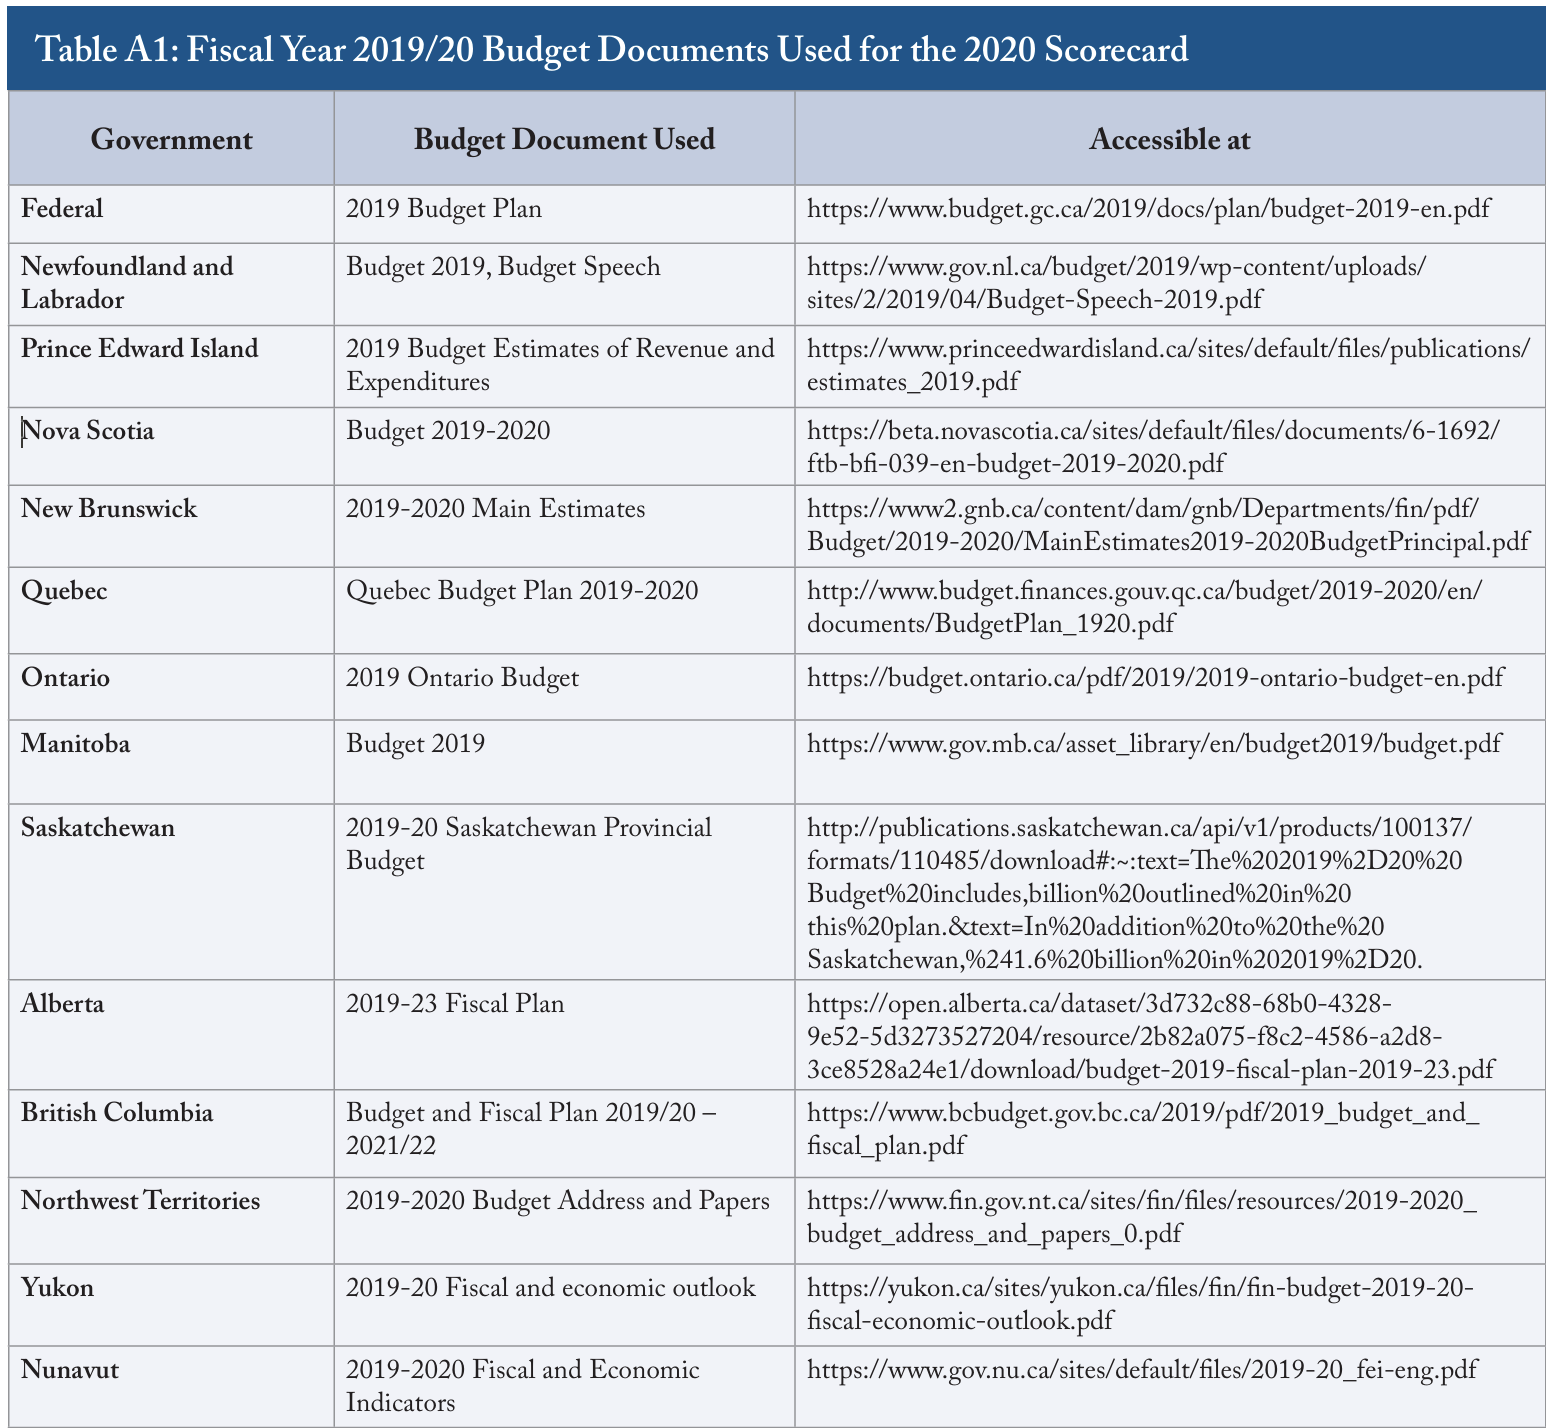
A budget’s readers should not need to dig deep through many pages, extraneous material and potentially misleading numbers before finding projections for consolidated revenues, expenses and the bottom line. We made the formal publication – the physical budget book or its electronic PDF equivalent – the focus of our inquiry, because web pages and links among documents are sometimes ephemeral and not clearly dated, and can present users with hard-to-quantify navigational challenges. We awarded 0 to governments that located their consolidated revenue, expense and bottom-line numbers more than 50 pages into their 2019/20 budget, 1 to governments that located them 31–50 pages into their budget, 2 to governments that located them 16–30 pages into their budget and 3 to governments that located them within the first 15 pages.22 We numbered pages from the first page of the entire document, which corresponds to page 1 in the PDF version. We used a specific page count, rather than a proportional measure – such as “within the first 10 percent of pages” – to avoid marking longer documents (with larger denominators) more easily. The appendix lists the budget documents we reference in this report.
Readers of a budget will learn more if they can readily compare budget plans with historical results as published in previous financial statements and with the projected results for the fiscal year about to end.33 When governments table budgets before the start of the fiscal year, as they should, the term “year about to end” applies literally – it is the then-current fiscal year. When governments table budgets after the start of the fiscal year, the year before has already ended, but the audited financial statements are not yet ready, so the results for that year will still be projections. We awarded 0 to governments that presented budget numbers that were not on the same accounting basis as the financial statements, and 1 to governments whose budget numbers and financial statements were on the same accounting basis. Clear budget projections let a reader relate projected revenues and expenses to the projected surplus or deficit, and relate the projected surplus or deficit to the projected change in the government’s net worth. Governments whose balances omit items such as amortization of capital or debtservicing costs or that move money in and out of special-purpose accounts obscure their bottom line. We awarded 0 to governments that did not present consolidated revenue, expense and bottomline figures, 1 to governments that did not clearly identify consolidated revenues and expenses, but did present a consolidated bottom line, or that mixed the consolidated revenue and expense figures with other numbers or that showed below-the-line adjustments, and 2 to governments that prominently presented consolidated figures for all three.
Grading the Main Estimates
Main estimates, like budgets, should be timely. Legislators ideally would get them at the same time as the budget, and early enough to consider them properly before the start of the fiscal year. We awarded 0 to governments that presented their 2019/20 estimates after the start of the fiscal year, 1 to governments that presented them within one month before the start of the fiscal year and 2 to governments that presented them more than one month before the start of the fiscal year. We awarded a bonus point to governments that presented their estimates simultaneously with their budget.
To understand the context of their votes on items in the main estimates, legislators need to be able to see how those items reconcile with projected consolidated expenses in the budget. We awarded 0 to governments that presented estimates that did not match the presentation in the budget and did not reconcile them with projected consolidated expenses. We awarded 1 to governments that presented estimates that did not match the budget, but provided a clear reconciliation with projected consolidated expenses, and to governments that presented estimates with accounting that matched the budget, but did not provide a clear reconciliation. We awarded 2 to governments that presented estimates that matched the budget, and provided a clear reconciliation with projected consolidated expenses.
Grading the Presentation of Results
Timely publication of the audited financial statements matters. The later they are, the less useful they are for holding a government to account for its performance and for evaluating subsequent projections. We awarded 0 to governments that tabled their 2019 financial statements more than six months after the end of their fiscal year, 1 to governments that tabled them three to six months after the fiscal year-end and 2 to governments that tabled them less than three months after. Typically, the publication of the financial statements coincides with the tabling of the public accounts: if it did not, we used the date of the public accounts in our score, since the public accounts often contain key additional information, such as reconciliations of results with the previous budget (see below).
Like budgets, public accounts documents should present the key information – consolidated revenues, expenses and bottom line – early. As with budgets and for the same reasons, we focused on the printed document (volume 1, where there was more than one volume) or its PDF equivalent. Presentation of the financial statements themselves near the front of the document fulfilled this requirement admirably. Governments that provided a summary statement early in their public accounts showing the key numbers also served their readers well. We awarded 0 to governments that located their consolidated revenue, expense and bottomline figures more than 50 pages into their public accounts, 1 to governments that located them 31–50 pages in, 2 to governments that located them 16–30 pages in and 3 to governments that located them within the first 15 pages.44 Among the features that make financial documents easier for users to navigate is searchable text in the PDF versions. Governments nearly always publish PDFs with searchable text, so we did not include a criterion for that in our report card. We note, however, that Yukon’s public accounts are not searchable – a gratuitous obstacle to the reader’s ability to find information.
Receiving an unqualified opinion, which requires adherence to public sector accounting standards, is vital to the user’s ability to trust a government’s financial statements. We awarded 0 to governments that had more than one qualification, in their legislative auditor’s opinion, with respect to their 2019 financial statements, 1 to governments that had one such qualification and 2 to governments that received an unqualified opinion.55 We gave legislative auditors’ opinions relatively heavy weight in calculating our overall grade because of the scope and rigour of their work. As in a non-government setting, a qualified audit opinion is a red flag to any user of financial statements. We did not give them even more weight – at the extreme, turning this exercise into a pass/fail assessment on that criterion alone – for two reasons. First, although numbers that have passed inspection are clearly better than those that have not, their timeliness and the ease with which users can find and identify them confidently matter; audited numbers published very late and in a format or location where people have difficulty finding them are not much good. Second, compliance with public sector accounting standards is a matter on which reasonable people can and do disagree; not all of Canada’s legislative auditors apply identical tests in evaluating their government’s financial statements, and judgments about how best to reflect reality for decision-making purposes in financial statements are continuously evolving.
An informative comparison of the results with the budget projections for the fiscal year is a great aid to understanding and accountability. Our evaluation of such comparisons has two parts: one related to the financial statements themselves, the other related to analysis in the public accounts.
As public sector accounting standards require, many governments provide budget comparisons right in the statement of operations in their financial statements. With this in hand, the reader can learn more if the budget numbers in the comparison match those in the budget itself – or, if they do not, if the financial statements explain the discrepancy or restatement of the budget numbers. We awarded 0 to governments that did not include budget projections in their statements of operations, 1 to governments that did include budget projections, but presented numbers that differed from those in the budget itself without explaining the discrepancies, and 2 to governments that included non-matching budget projections and explained the discrepancies. We awarded the top score of 3 on this criterion to governments with budget numbers that matched, or were restated to improve their adherence to public sector accounting standards and that explained any discrepancies.
Readers can also get more from a comparison if the public accounts provide a table showing variances between budgeted and actual revenue, expense and bottom-line results, with narrative explaining the variances. We awarded 0 to governments that did not show these variances, 1 to governments that showed the variances, but did not explain them, and 2 to governments that both showed and explained them.
Financial results are easier to understand if the difference between revenues and expenses – the surplus or deficit – is straightforwardly related to the change in the government’s net worth over the fiscal year. Even experts can have trouble figuring out what lies behind a line with a label such as “other comprehensive income or loss” that adjusts the year’s results to produce a change in the government’s accumulated surplus or deficit that differs from what the year’s operations produced. For non-experts, these “below-the line” adjustments are problematically opaque.
There are justifications for such adjustments. A government might discover that a contingent liability related to, say, cleaning up an environmental problem that is years old was more or less expensive than expected. It then might want to show the impact of that item on its financial position separately from the revenues and expenses it was able to control during the fiscal year. But there are many reasons to dislike these adjustments. For one, the accumulated surplus or deficit is the definitive statement of a government’s capacity to provide future services, and it is a problem if the annual results and the adjusted amounts show something different. As well, a below-the-line adjustment can hide a problem that is within a government’s control – as when it deliberately underreports an expense in one year, producing a misleadingly positive bottom line for that year, and brings the underreported amount in later in a reconciliation item that hardly anyone understands. Because major below-the-line adjustments are an obstacle to transparency and accountability, we evaluated those adjustments in governments’ 2018/19 financial statements relative to expenses, and awarded grades that reflected performance compared to the averages for all governments over the previous five years. We awarded 0 to governments with adjustments whose absolute value exceeded 1.6 percent of expenses, 1 to governments with adjustments between 1.1 and 1.6 percent of expenses, 2 to governments with adjustments between 0.6 and 1.1 percent of expenses, 3 to governments with adjustments below 0.6 percent of expenses and 4 to governments with no adjustments.66 These thresholds reflect the distribution of adjustments relative to expenses in all governments’ financial statements over fiscal years 2014/15 to 2018/19. The mean absolute adjustment over those years was about 0.6 percent of expenses, and the standard deviation was about 0.5 of a percentage point, so adjustments larger than 1.6 percentage points were two standards deviations worse than the average of all governments over the period.
Another key vehicle for timely information about how the fiscal results are unfolding relative to the budget is interim updates. Accordingly, our final criterion evaluated the frequency of interim information. We awarded 0 to governments that provided none, 1 to governments that provided only half-year updates, 2 to governments that provided quarterly updates and 3 to governments that provided monthly updates.
To produce an overall grade from these criteria, we standardized the scores for each criterion to be between 0 and 1,77 For example, if we awarded 2 for a criterion with a maximum score of 3, the government’s standardized score on that criterion would be 0.67. weighted them based on our judgment of their relative importance to the overall goal of clarity and reliability88 Subjectivity is inevitable in any weighting system of this kind, and it is natural to wonder how sensitive the results are to the weights we chose. A simple test of their importance to our scores is to compare those grades to the grades that would have resulted from placing equal weight on each criterion. That exercise produces an average absolute change across the 14 governments of 1 degree – equal, for example, to a change in score from B to B–. The correlation between the rankings using weighted and non-weighted criteria is 93 percent, while the correlation between the numerical grades using weighted and non-weighted criteria is 95 percent. and summed the weighted scores to produce a percentage score that we converted to a letter grade on a standard scale: A+ for 90 percent or above, A for 85–89 percent, A– for 80–84 percent, B+ for 77–79 percent, B for 73–76 percent, B– for 70–72 percent, C+ for 67–69 percent, C for 63–66 percent, C– for 60–62 percent, D+ for 57–59 percent, D for 53–56 percent, D– for 50–52 percent and F for less than 50 percent.
The 2020 Report Card
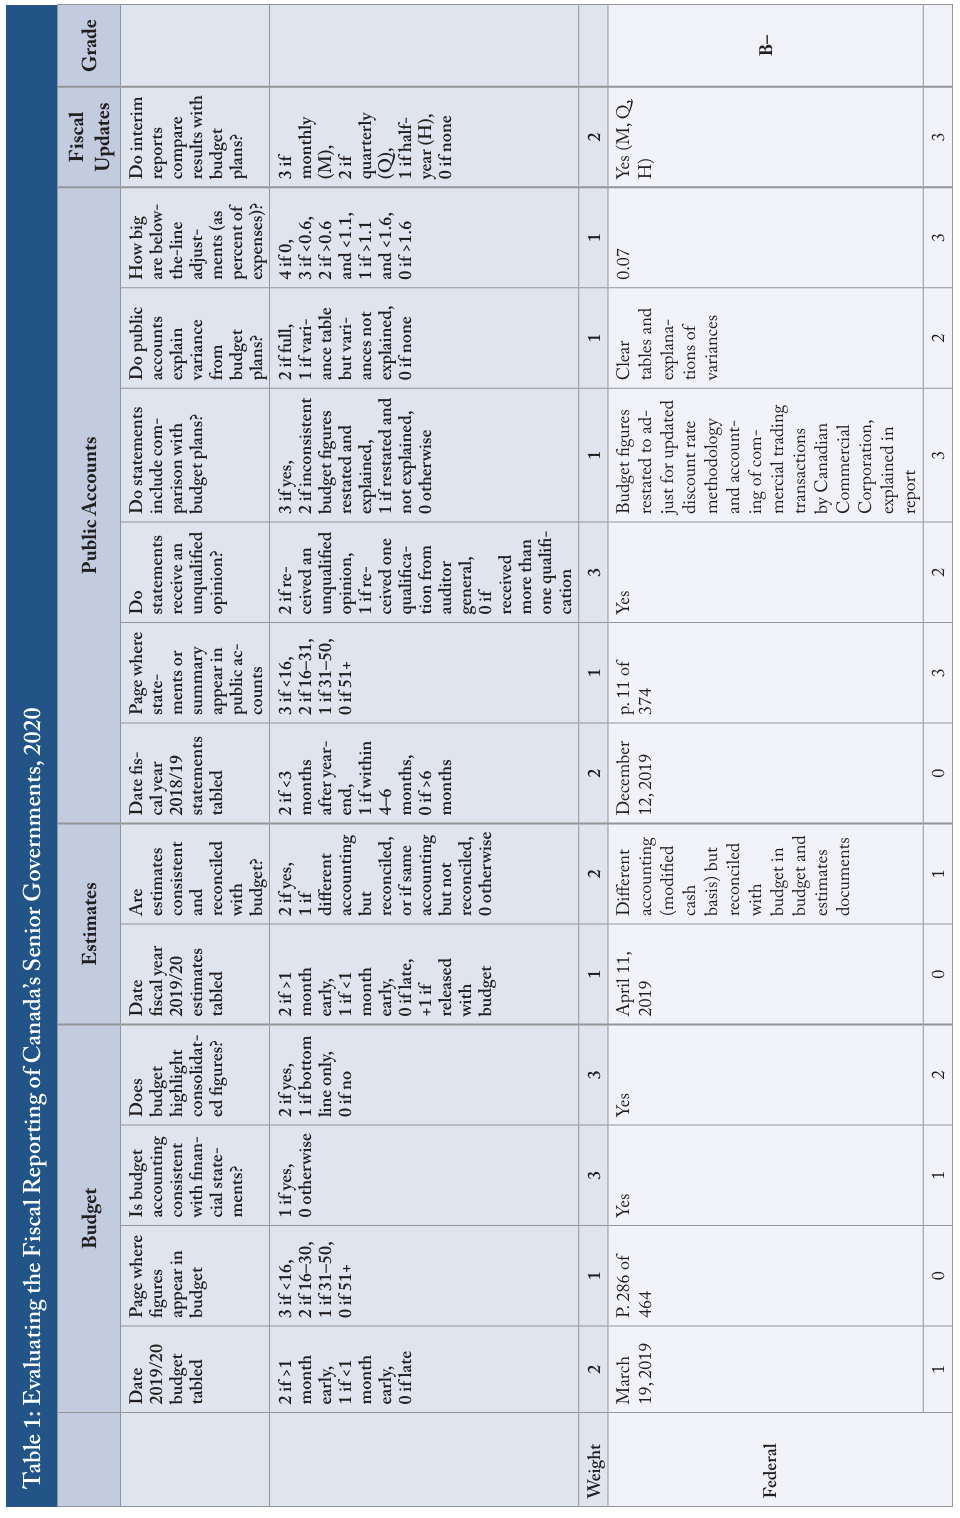
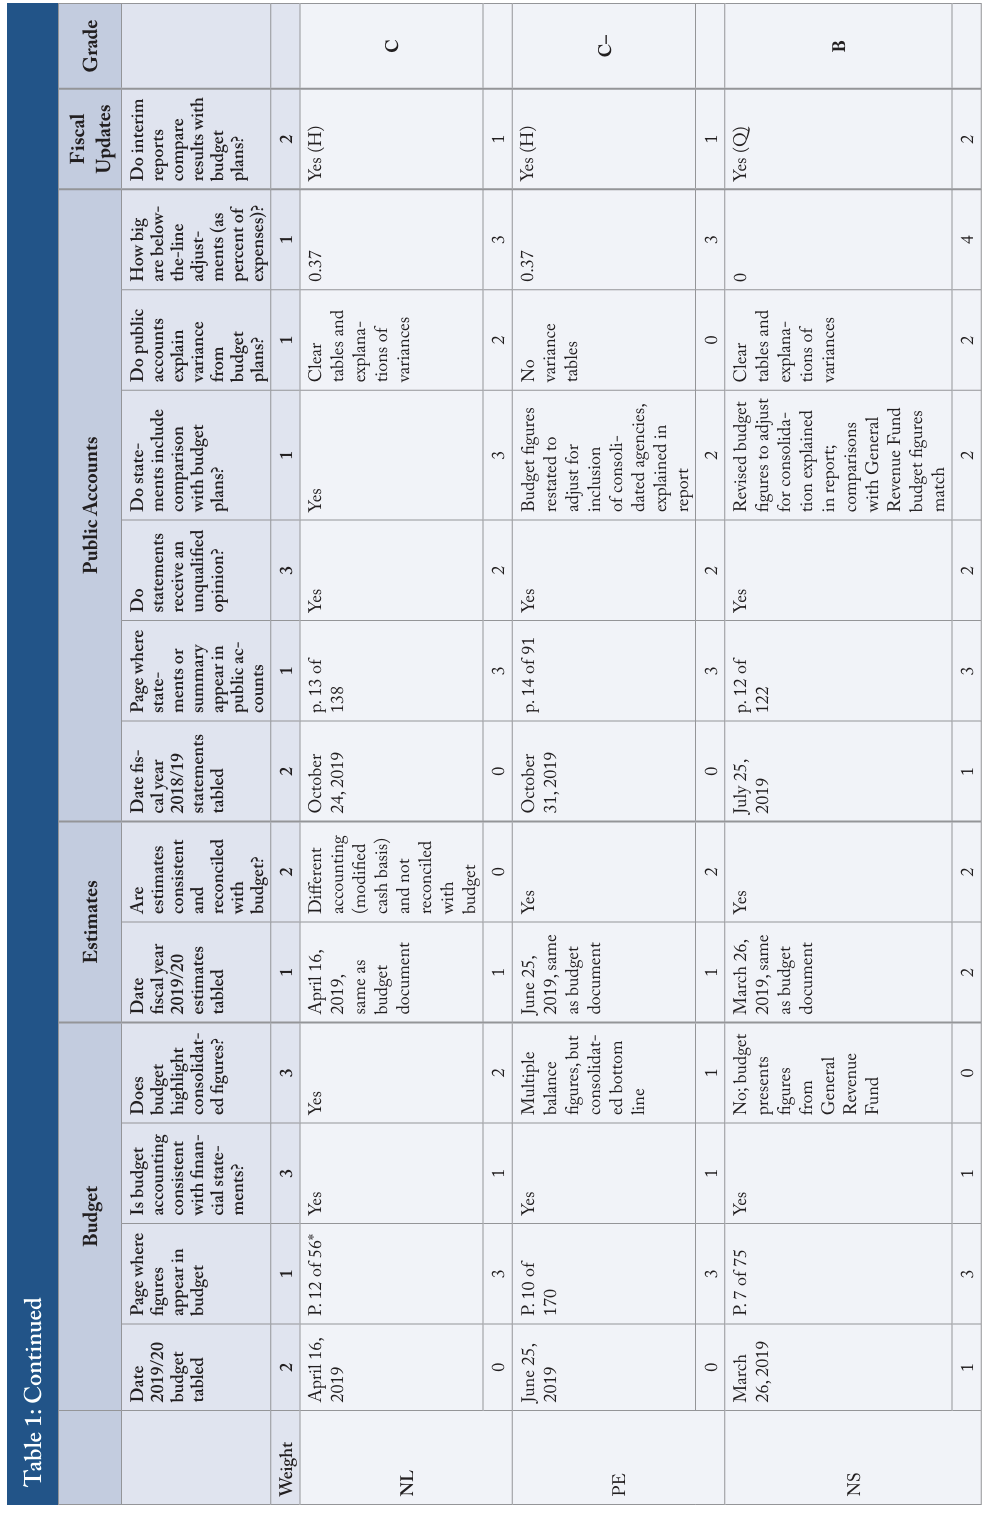
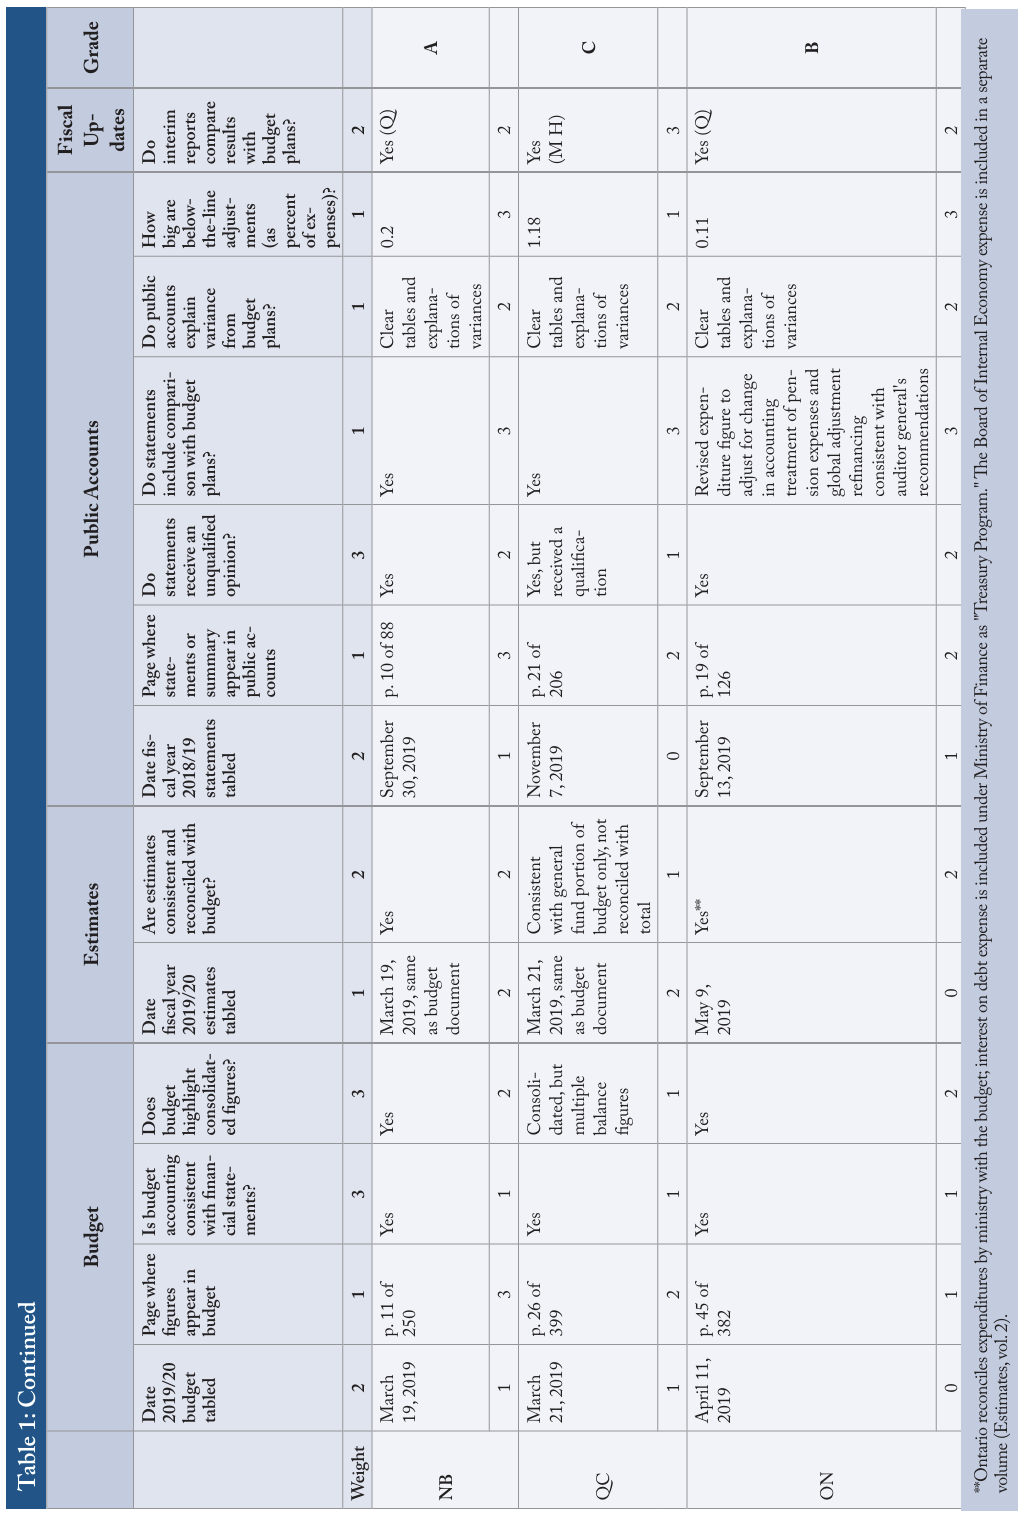
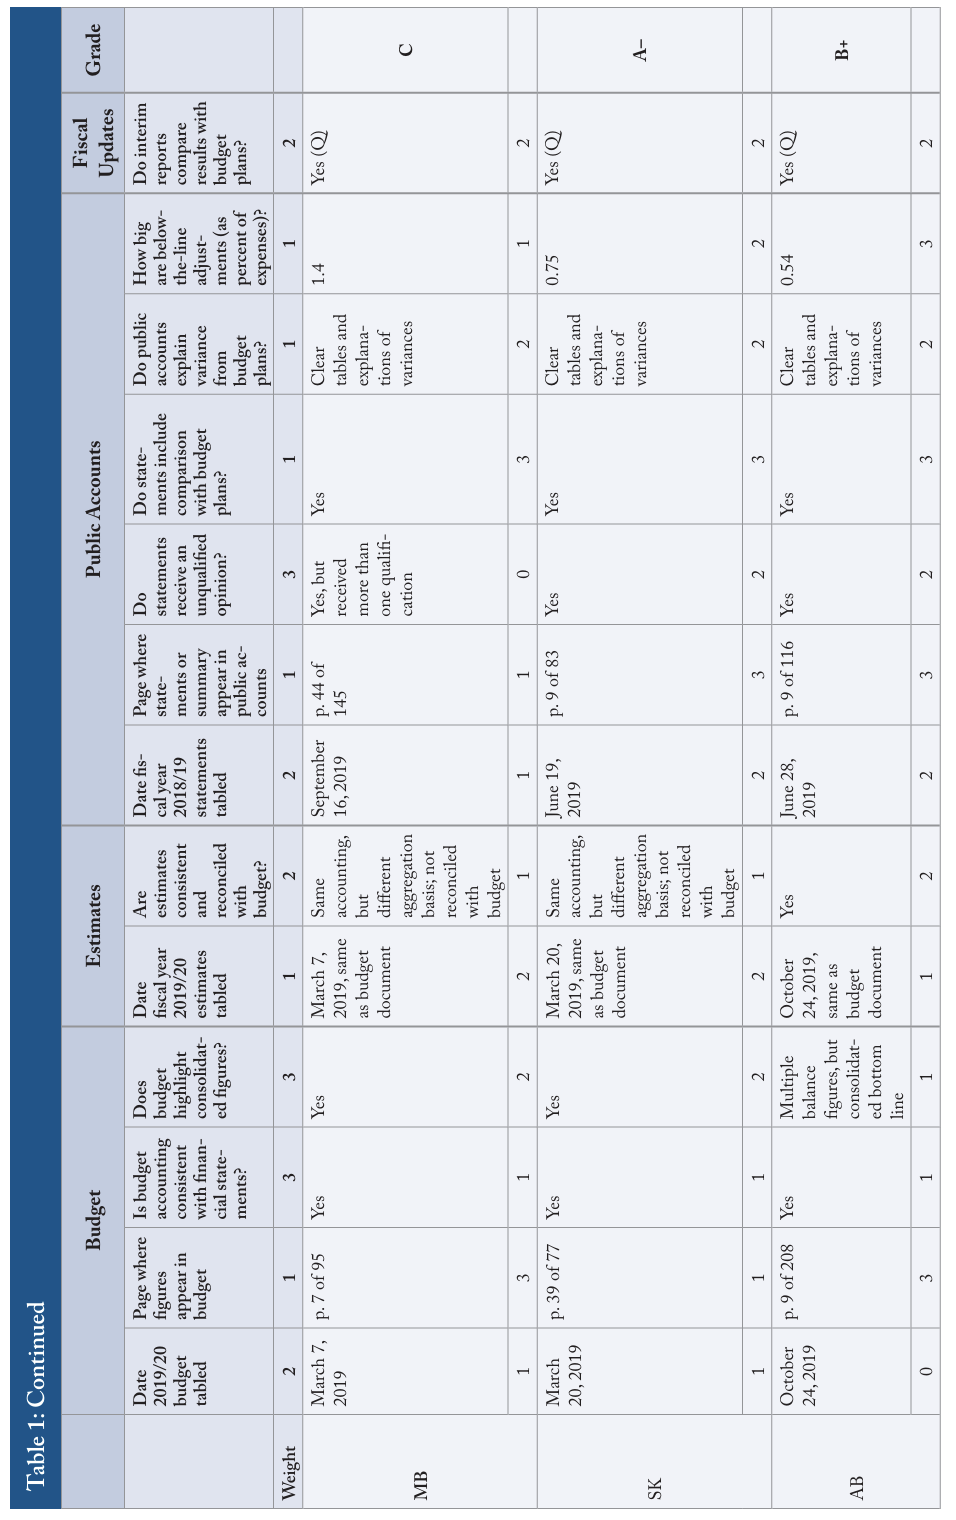
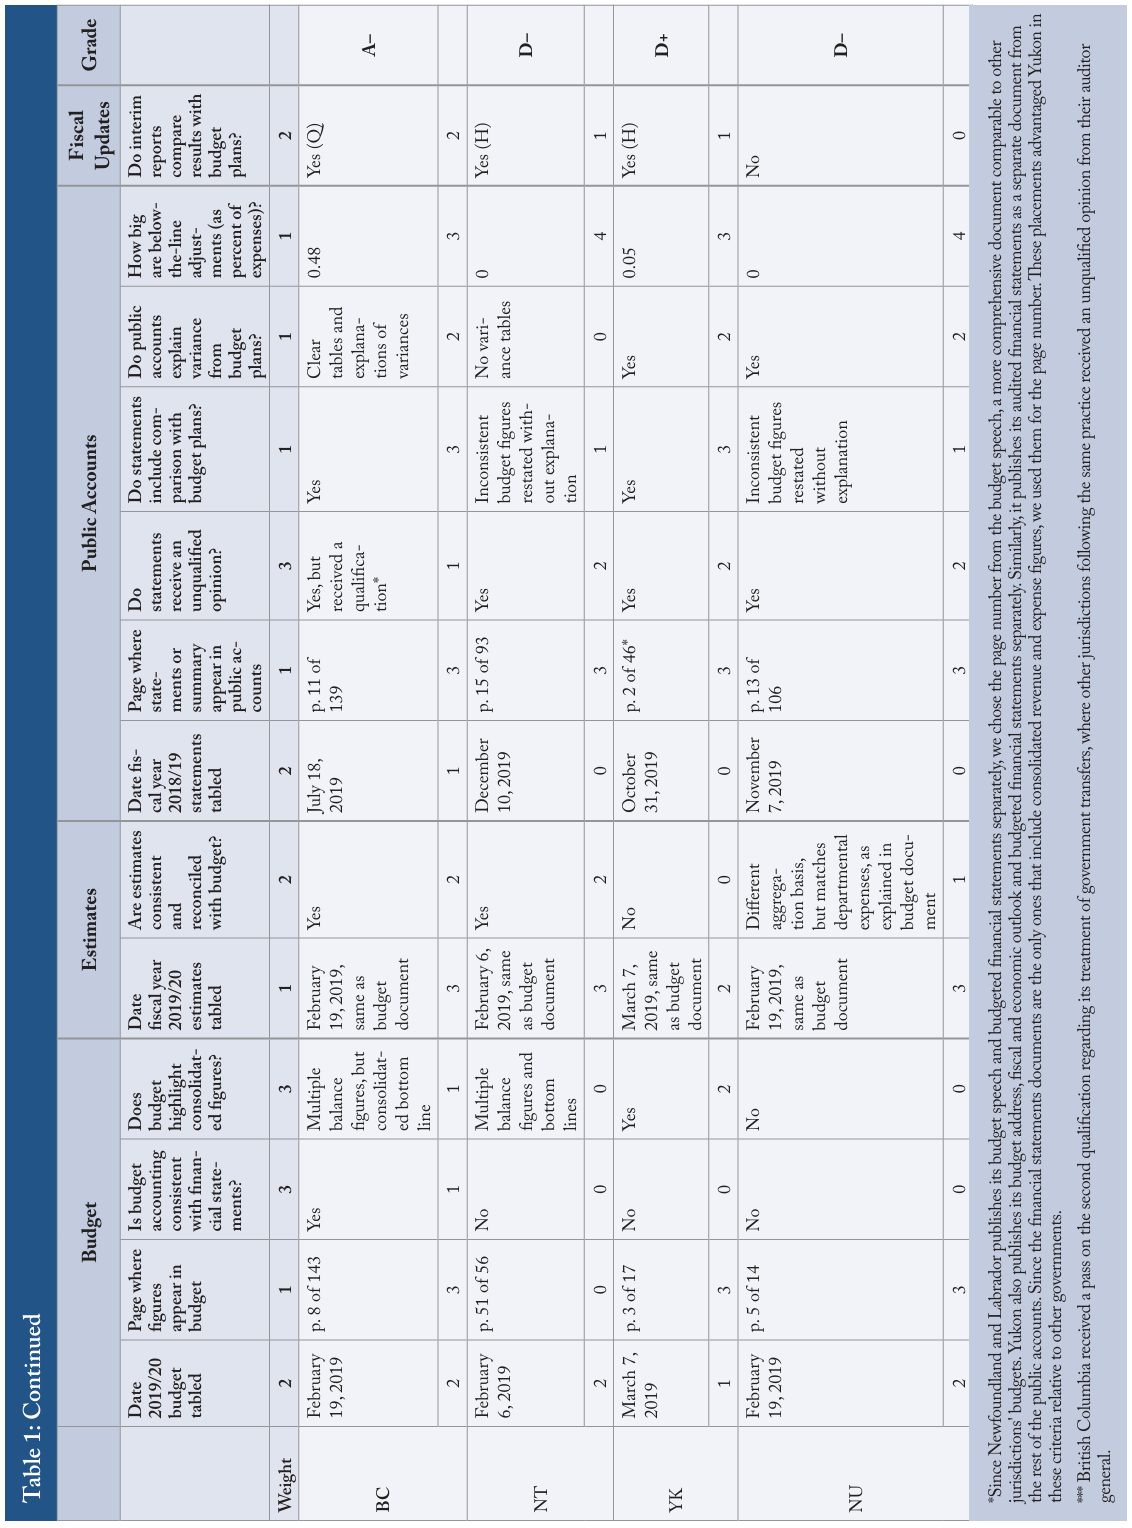
Our assessments for each criterion, along with the letter grade for each government produced by the weighted sum of all criteria, appear in Table 1.
The Best and Worst
As noted, the top mark goes to New Brunswick, with an A, followed by Saskatchewan and British Columbia, each with A–. Alberta, with a B+, and Ontario and Nova Scotia, each with a B, are not far behind.
The federal government earns a B–, its grade hurt by the burying of key numbers in an annex hundreds of pages deep in the budget and the late presentation of the estimates.
Quebec, with a C, is a chronic middling performer: qualified opinions from its auditor general and the late presentation of its public accounts are persistent problems.
Yukon’s D and the D– received by both the Northwest Territories and Nunavut reflect several problems common to each territory. Their budgets contain multiple revenue and expense numbers that a non-expert cannot reconcile with the numbers in their financial statements. Moreover, they publish their financial statements late, and do not provide straightforward comparisons of their results with their budgets.
Changes in Grading and Grades
The quality of financial reporting by Canada’s senior governments has been improving in recent years. Particularly notable are more consistent adherence to public sector accounting standards in financial statements and budgets that are prepared consistently with the financial statements, and therefore also reflect public sector accounting standards.
This widespread adherence to public sector accounting standards is a phenomenon of the twenty-first century. Previously, senior governments largely used cash-based budgeting, recording revenues when cash flowed in and expenses when cash flowed out, even if the activity related to the receipts and payments did not occur in the relevant fiscal year. Public sector accounting standards, in contrast, mandate accrual accounting, which matches revenues and expenses to the period when the relevant activity took place. Amortizing longlived assets over the period in which governments deliver services, for example, is far more informative than showing their up-front cash costs. Likewise, recording deferred compensation – such as pensions for government employees – when the work that earns the benefits is done, as public sector accounting standards require, is more informative than showing it when the payments occur.
As Canada’s senior governments moved to public sector accounting standards in their financial statements, they initially continued presenting budgets on a cash basis, resulting in discrepancies between the two documents that flummoxed most readers. We are glad to report that most senior governments have recently presented budgets consistent with public sector accounting standards. As such problems have become less salient over time, the C.D. Howe Institute’s fiscal accountability project’s scrutiny has extended to other issues. In recent iterations of this report, we added the criteria that estimates should follow public sector accounting standards, provide ready comparison with the budget and appear before the beginning of the fiscal year – ideally at the same time as the budget. We also revised the criteria related to the timing of budgets and financial statements in order to accentuate the difference between governments that present budgets early enough to permit substantive legislative scrutiny and those that do not, and between governments that publish their results promptly and those that do not. And we refined the criterion related to adherence of the financial statements to public sector accounting standards to differentiate between governments that received one auditor’s qualification, which might reflect a minor matter or an arguable difference in interpretation, from those with more than one, which more likely reflects a chronic problem with the reliability of the numbers.
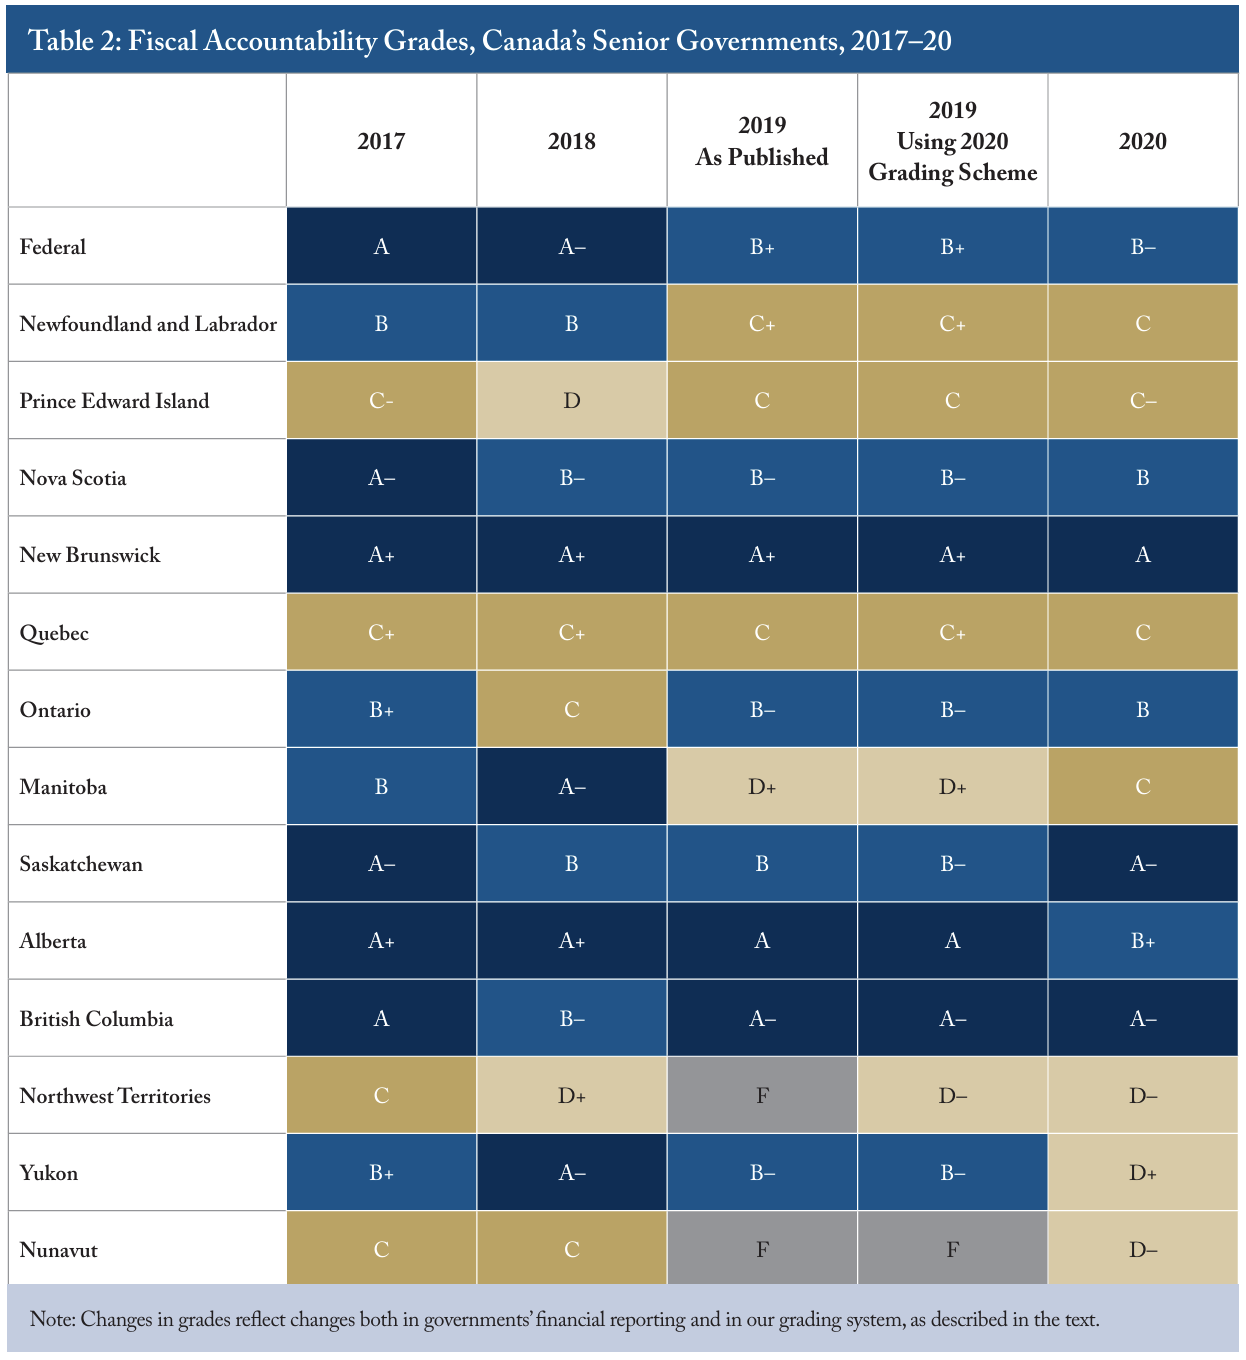
New in the 2020 report card is the criterion on below-the-line adjustments, which we introduce in anticipation of difficult economic and fiscal times ahead, and increased scrutiny of the bottom line. These might induce governments to use “other comprehensive income or loss” as a tool to obscure the impact of policy decisions on their net worth and their capacity to deliver services in the future. Since readers might wonder if this new criterion affected governments’ relative standings, we provide a check. Table 2 compares each government’s grade for 2020 with its grade for 2019, as published in last year’s report (Robson and Omran 2019c) and with the grade it would have received in 2019 if last year’s report had used this year’s grading system. As the table shows, changes in rankings mostly reflect changes in governments’ financial reporting.99 The average absolute difference attributable to changes in the scoring system across the 14 governments was 0.2. The bulk of these changes are positive: generally better performance with respect to the clarity, reliability and timeliness of budgets, estimates and financial statements. Notably, our evaluation of the fiscal year 2019/20 budgets and estimates and the 2018/19 financial statements produced no failing grades.
New Brunswick emerged as a top-performing government in 2017, after improvements to its accounting for public sector pension plans and consequent disappearance of a reservation by the provincial auditor. New Brunswick also has a particularly strong record in presenting timely budgets: for several years, it was unique in presenting a January budget, and it has consistently presented its budget before the start of the fiscal year.
Saskatchewan’s high grade is worth noting. That province joined the top performers in this year’s report due to timely presentations of its budget, estimates and public accounts.
British Columbia continues as a high performer, despite receiving a qualification from the provincial auditor general regarding its rate-regulated accounting related to future electricity revenues.1010 British Columbia received two qualifications from its auditor general in fiscal years 2016/17, 2017/18 and 2018/19. One qualification concerned the treatment of government transfers, where the province deferred transfer revenue related to capital projects until the project delivered its services. Several other provinces, including Alberta, follow the same practice, but have not received qualifications from their auditor on this basis; we therefore did not penalize British Columbia for its qualification. For more detail on the dispute between the provincial auditor and the government, see British Columbia (2017). Positives for the province were its timely budget and estimates, consistency between both documents and its public accounts and prominent presentation of key numbers. British Columbia could improve its grade by cleaning up its electricity accounting and including capital amortization in its budgeted expenses.
If Nova Scotia had presented consolidated revenue and expense figures in its budget, reflecting the same aggregation it uses in its year-end financial statements, it would have joined the top rank.
Alberta had been an outstanding performer since 2016, but the late release of its budget and estimates cost it a top mark this year. Alberta’s delayed release of its fiscal year 2019/20 budget and estimates was due to its 2019 election – the outgoing government did not produce a budget prior to the election. New legislation, however, requires Alberta’s budget to be tabled in February, and Alberta released its fiscal year 2020/21 budget in February and its estimates for that year in March. It is worth noting that Alberta scored poorly for several years, thanks to a confusing array of “operating,” “saving” and “capital” accounts that were not consistent with public sector accounting standards. Since resolving those issues, Alberta has been a solid performer.
Ontario improved its grade considerably in 2019, after a qualified opinion from the provincial auditor general previously hurt it. It would have dropped a notch this time due to the delayed presentations of its budget and main estimates, but a better alignment of the two documents more than offset the deterioration in timeliness. Ontario could raise its grade by moving key revenue and spending numbers forward in the budget and tabling financial reports sooner.
The federal government, Newfoundland and Labrador, Quebec and Prince Edward Island all slipped for reasons that could be easily corrected. These include later publication of documents (Ottawa and Newfoundland and Labrador), less prominent presentation of important numbers in the budget (Quebec) and less frequent fiscal updates (Prince Edward Island).
Manitoba’s improvement in this year’s rankings reflects legislative changes to the governance structure of its Workers Compensation Board (WCB). After penalizing Manitoba in last year’s report for excluding the WCB from its budget, we awarded full marks for its consolidated budget this year. Although the province’s grade in this year’s report card still reflects reservations and qualifications by the auditor general regarding the WCB and other agricultural insurance trusts, these issues are expected to be resolved once these amendments receive Royal Assent. If the fiscal year 2019/20 financial statements receive a clean audit, Manitoba likely will receive a B+ in next year’s report – a significant improvement. With other efforts to improve the transparency and clarity of its financial reporting underway, Manitoba could join the top performers in future iterations of this report.
Yukon’s grade this year is a notable deterioration: after standing out as the one territory that presented its budget on the same basis as its financial statements, consistent with public sector accounting standards, it failed in 2019/20 to point readers to a proper budget document. The user who followed the links on Yukon’s website found a fiscal and economic outlook document that was not comparable to the territory’s financial statements.1111 The fiscal and economic outlook document is not Yukon’s main budget document, but we chose it as the appropriate one to use for determining its grade for this year’s report card. Experience has taught us, as authors of this annual report, how to recognize the budget document with the key numbers, but the same cannot be expected of a first-time, non-expert user. Indeed, we tested this assumption by asking several individuals who are not experts in government financial reporting to point out what document they thought was Yukon’s fiscal year 2019/20 budget – all pointed to the fiscal and economic outlook document. A simple website reorganization to highlight the main budget document could raise Yukon’s grade. A more prominent presentation of the appropriate budget document, timelier presentation of its public accounts and a reconciliation of its main estimates with its budget could improve Yukon’s grade to an A next year.
Although Nunavut ranks last in this year’s report, its grade improved over last year’s failing one, reflecting the territory’s earlier publication of its budget and main estimates.
The 2020/21 Budget Cycle and Preview of 2021 Results
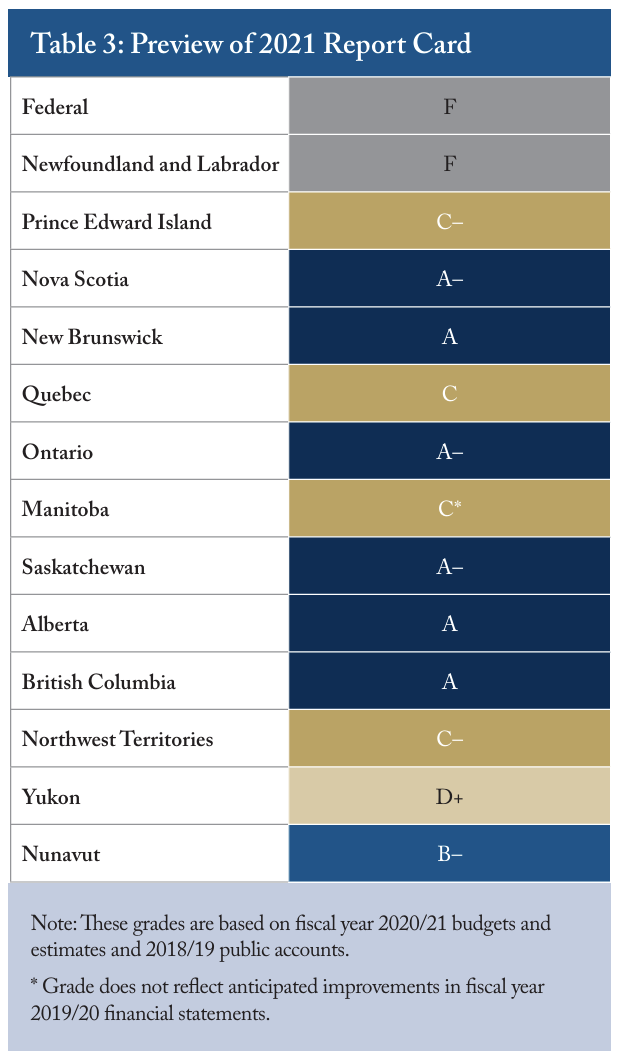
Although the overall trend in fiscal transparency and accountability of Canada’s senior governments has been positive, the experience of early 2020 highlights that there is nothing automatic about improvement. As of the time of writing, neither the federal government nor Newfoundland and Labrador has presented a budget for fiscal year 2020/21. These failures are not an inevitable consequence of the COVID-19 crisis: more senior governments presented timely documents in the 2020/21 budget cycle than the year before, with Alberta and Nova Scotia joining the Northwest Territories, British Columbia and Nunavut in presenting budgets and estimates in February. Yukon, Quebec and New Brunswick presented budgets and estimates in early March, and Manitoba presented its own later that month. Other provinces performed less evenly, but on current evidence Ottawa and Newfoundland and Labrador might not present budgets for 2020/21 at all. If they do not, next year’s grades might look like those in Table 3,1212 These grades are not necessarily what we will award in 2021, as they do not reflect potential changes in the presentation of the public accounts for the year ending March 31, 2020. which are the result of updating the grades in Table 1 using the 2020/21 budgets and estimates, and assuming each government’s performance in the 2019/20 round of public accounts is the same as in the previous round. On the basis of its performance to date, Ottawa would get an F on the 2021 report card. Newfoundland and Labrador has promised to release a budget “as soon as possible,” but if it does not, it also will earn a failing grade in next year’s report card.
Does Fiscal Accountability Matter?
Relevant, accurate and accessible financial reports cannot, on their own, ensure that governments will serve the public interest, but they provide a critical foundation. Without them, the principals – citizens and taxpayers, and the legislators acting for them – lack basic insights into what their agents – governments – are planning, how well they are meeting their targets and what the consequences are for their capacity to deliver services in the future. Battles between governments and legislative auditors show that governments think the presentation of financial information matters: why risk a qualified opinion unless the presentation of misleading numbers offers some political reward? Good numbers, by contrast, give the principals a strong start in understanding any problems the numbers reveal and in monitoring progress toward a solution.
Budget Hits and Misses
Canada’s senior governments have had a notable tendency to overshoot their budget targets: over the past couple of decades, both revenues and expenses have come in over budget projections far more often than not. This overshooting of targets has become less pronounced in recent years, but it means, among other things, that governments’ fiscal footprints going into the COVID-19 crisis were significantly larger than they would have been if they had hit their annual targets previously.1313 Robson and Omran (2019a) document this phenomenon; Robson (2020) discusses it in regard to healthcare spending in particular. Although COVID-related spending will interrupt this improving trend, the fiscal pressures of the crisis will intensify the focus on governments’ bottom lines. Financial reports that allow easier comparisons between intentions and results will be a valuable tool to contain the gap between promises and results in future years.
This focus on consistency of presentation might appear a preoccupation of accountants, without much relevance for the decisions and allocation of resources that affect taxation and the quality of government services. Canada’s municipalities, however, offer examples of the real-world consequences of problematic budget presentations. Whereas municipal financial statements, like those of most senior governments, are consistent with public sector accounting standards, their budgets typically are not: most municipal budgets use cash accounting rather than accrual accounting. The information municipal councillors use in making budget decisions likely discourages capital investments in general, and encourages cities to charge too much up front for the projects they undertake. Annual angst over balancing the city’s budget is familiar to councillors, ratepayers and voters. Much less noticed are the sizable annual surpluses cities show in their financial statements – surpluses reflected in holdings of financial assets, when most residents probably would favour higher investment in physical assets such as roads, drinking water and sewers, and transit (Robson and Omran 2019b, 2020). Budget presentations that are consistent with financial statements and that facilitate comparisons between intentions and results could help cities tax and spend more effectively; we think the correlation between consistent accounting and smarter decisions applies equally well to senior governments.
Disputes over Financial Reporting
Disagreements over financial presentations offer indirect but powerful testimony of their importance. When public sector accounting standards were newer in the 1990s, reservations by legislative auditors were more common. Salient examples occurred at the federal level in the late 1990s and early 2000s, when Ottawa prebooked increasingly large amounts of spending, artificially reducing surpluses (Robson 1999; Robson and Omran 2019a). As the auditor general of Canada complained in a series of reports (see, for example, Canada 2001, 1.29–1.34), the federal government was presenting Parliament with financial statements that reflected neither what Parliament voted nor the government’s true fiscal position. Moreover, as in the municipal case, making decisions on the basis of what will look good in the financial statements distorted the actual allocation of resources. Ottawa ended up taxing more, and spending more on programs that lent themselves to financial manipulation, than it would have done had it presented more honest information.
More recent examples have occurred in Ontario. In fiscal year 2015/16, the provincial auditor general issued a qualified opinion on the province’s financial statements because of concerns about its access to surpluses in jointly sponsored pension plans that it was reporting as net assets. The following year, the auditor general also objected to the government’s accounting related to potential future electricity revenues, which obscured expenses related to electricity subsidies. Ontario’s 2017/18 financial statements, which garnered an unqualified opinion from the auditor general, showed a much larger deficit than would have been the case had these practices continued. As at the federal level in earlier years, the provincial government’s desire to achieve a particular accounting result drove policy, particularly on the electricity front. And with regard to the province’s larger fiscal strategy, budgets and financial statements showing a less positive bottom line during those years likely would have produced some mixture of spending restraint and more aggressive revenue collection than actually occurred.
Improving Fiscal Accountability in Canada
To summarize, on the positive side, many of Canada’s senior governments have made notable improvements in their financial presentations, and in recent years results have tended to be closer to budgets. On the negative side, there is continuing tension between the requirements of good financial reports and the obscure and/ or misleading presentation of key numbers. We conclude this year’s report by suggesting a number of improvements to foster better government fiscal accountability.
Public Accounts Should Reflect Public Sector Accounting Standards
All of Canada’s senior governments should publish financial statements that are consistent with public sector accounting standards. All other documents, including budgets, in-year updates on the evolving situation and reconciliation tables explaining differences between projections and outcomes, should likewise be consistent with those standards.
Budgets Should Match Financial Statements
Governments should not confuse users of their financial documents with more than one set of headline figures, or inconsistent aggregating and netting that make what should be a simple comparison of projections and results practically impossible. Budgets should present consolidated revenues and expenses, and the anticipated surplus or deficit, on the same basis as those numbers appear in financial statements.
Budgets Should Precede the Start of the Fiscal Year
Budgets should be timely, giving legislators and citizens time to understand and respond to – and, in the case of legislators, vote on – the fiscal plan before the year is already underway. It is an affront to accountability to ask legislatures to approve a plan after money has already been spent. Public engagement inevitably will be less if lack of time precludes an opportunity to understand and comment on a budget’s projections before the fact. Ontario recently committed to presenting its budget no later than March 31. While that is better than presenting after April 1, there is no reason all governments should not table their budgets before the end of February. Alberta’s recent commitment to present a February budget sets a better standard.
Estimates Should Be Timely and Reconcile with Budgets
Legislators’ approval of estimates is a link in the chain of fiscal accountability that, in most jurisdictions, is weaker than it should be. Governments that present estimates inconsistent with their budget and/or their financial statements create a huge information gap for legislators. Inconsistencies might result from different accounting and/or aggregation, and from legislators’ not receiving information showing whether expenses authorized by votes on individual programs reconcile with the fiscal plan. Presenting consolidated expenses on the same accounting basis as the budget, with clear reconciliation of any aggregation differences between the estimates and the budget, would mitigate this problem.
An additional problem is that legislators often get, and vote on, the estimates after the financial horses are leaving the barn. Several Atlantic provinces set a good example in this regard, releasing estimates consistent with budget projections simultaneously with their budget. Elsewhere, estimates might come weeks later. In recent years, the federal government improved the presentation of its estimates, providing reconciliations with the budget plan and showing the relevant expenses on an accrual basis. After taking a step back on timing for the past two years, tabling its main estimates as late as mid-April, Ottawa tabled its fiscal year 2020/21 estimates in February. Unfortunately, its failure to present a 2020/21 budget has overshadowed that positive step. A good measure of accountability and transparency would be a commitment to presenting the budget in February, as the federal government had done in previous years, and the main estimates at the same time.1414 The OECD (2002) recommends that governments submit their draft budget – equivalent to the budget in Canadian practice – no less than three months prior to the start of the fiscal year, and that approval of the budget – the estimates in Canadian practice – should precede the start of the fiscal year. The Open Budget Survey on Canada’s federal government says it should “[e]nsure the Executive’s Budget Proposal is provided to legislators at least two months before the start of the budget year and that the budget proposal and the Main Estimates are better aligned” (International Budget Partnership 2020).
This is an area where legislators should play a stronger role by using powers they already have. The federal, provincial and territorial legislatures all have standing committees to deal with estimates, such as the federal House of Commons Standing Committee on Government Operations and Estimates. In the modern world of centralized communications and control in the offices of premiers and prime ministers, these committees can seem unexciting and membership in them like a lot of work for relatively little profile. But the wisdom, or not, of governments’ use of public funds tends to become high profile at intervals, and members of these committees who take their job seriously, and insist on timely and useful information, make a difference.
Key Numbers Should Be Accessible and Recognizable
Relevant and accurate numbers are less useful if readers cannot find them or recognize them when they do find them. Clearly labelled numbers in the opening pages of a document are conducive to understanding and engagement. Obscure numbers hundreds of pages deep, or in an annex, look like an attempt to evade scrutiny.
In this connection, we urge governments to cut extraneous information and clutter from their budgets. The federal government’s budgets are particularly bad, with page after page of repetition, condescending narrative and extensive Commentary on matters far removed from fiscal policy. Readers of its 2019/20 budget had to flip almost 300 pages into an annex to find the consolidated revenues, expenses and bottom-line projections. Experts know to persist until they find the summary statement of transactions that includes the effects of the budget measures. A non-expert exploring the budget might give up before finding it, or think that numbers given so little prominence in the document could not be important. Ontario’s budgets have suffered from a less extreme version of the same flaw, but the province has committed to putting the key numbers up front, and made a major improvement in this respect in its 2019 budget. Yukon’s latest budget presentation was a regrettable unforced error – its website does not point the user to the appropriate budget document, and the choice a non-expert would reasonably make provides inconsistent numbers.
Year-End Results Should Be Timely
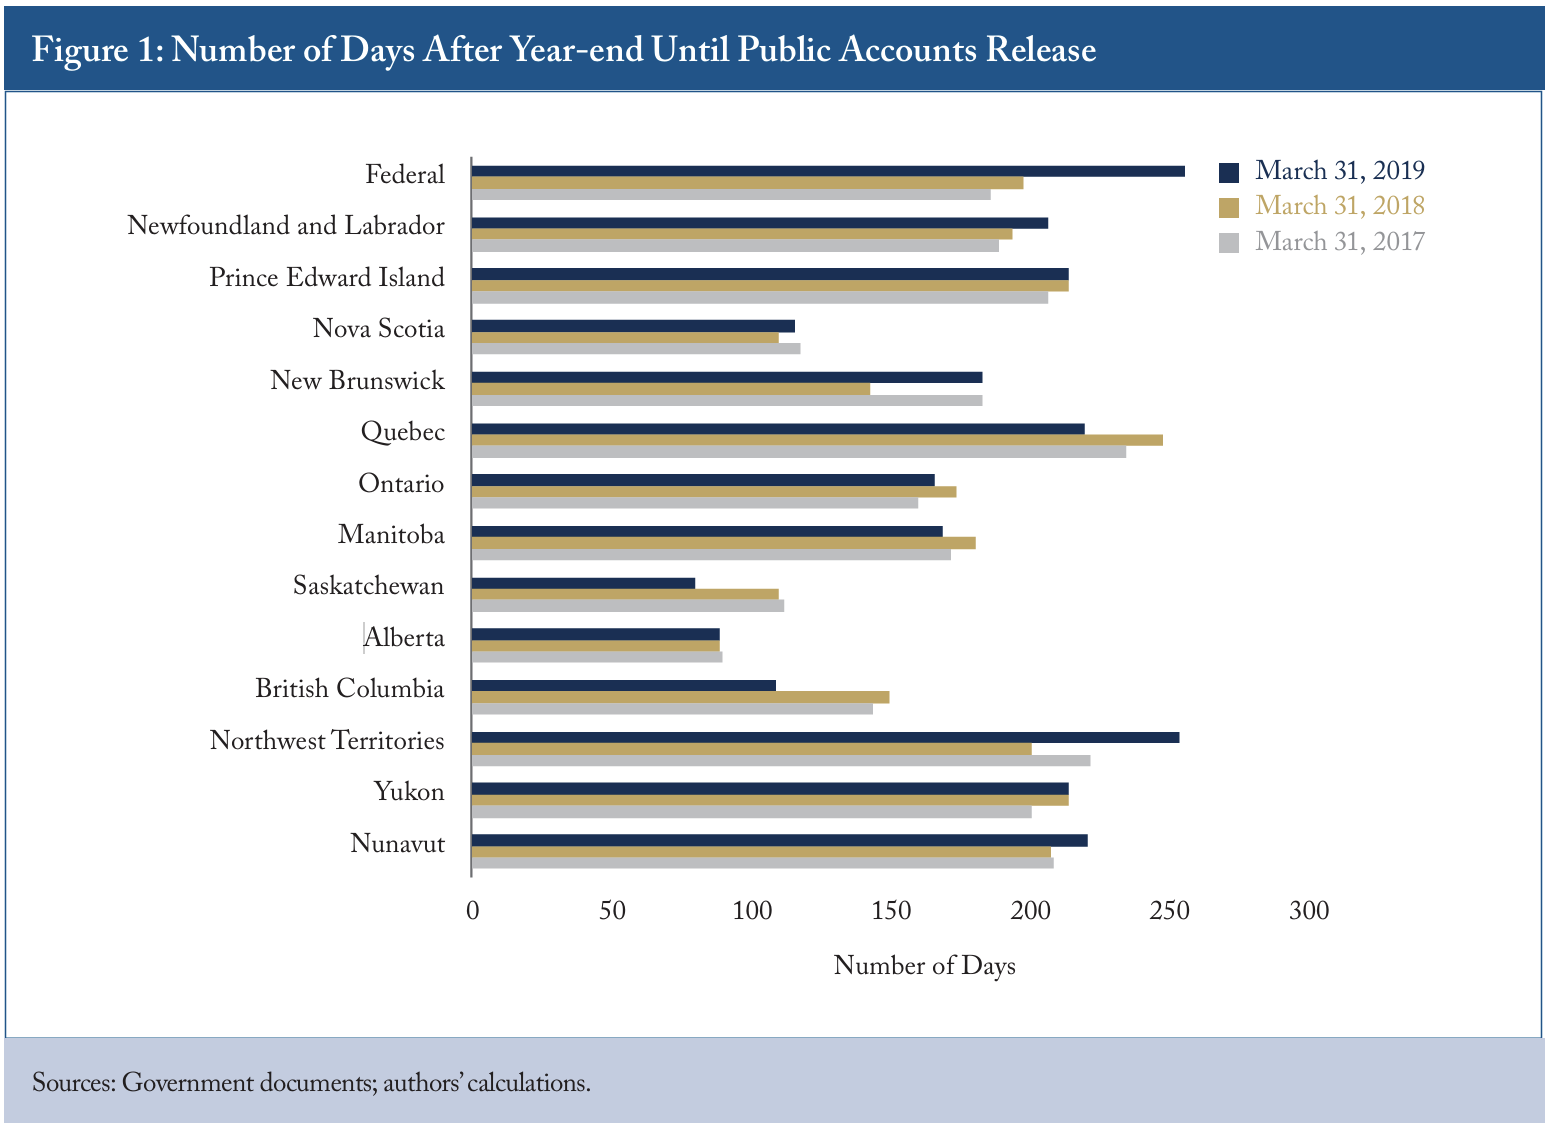
Every organization needs timely operational and financial information to set and adjust its course. The public accounts of Canada’s senior governments let legislators and citizens compare end-of-year results with budget plans to see if the government fulfilled its promises and to understand the size of, and reasons for, deviations from targets. The quick production of financial statements would encourage the faster gathering and compilation of the necessary data, which should improve the quality of the numbers in the budget plan for the year underway and, by extension, for the baseline fiscal position in the future. Currently, however, the gaps between earliest and latest are large and not easy to understand (Figure 1).
At the beginning of this century, the OECD (2002) recommended the publishing of audited financial statements not more than six months after year-end, to allow legislators to scrutinize the prior year’s outcomes before voting on the next budget. With improvements in information technology since then, we think this is a reasonable outside limit and that a best-practice standard would be sooner than that.1515 Former federal auditor general Michael Ferguson (2017) elaborated on this point with reference to the federal government: We all know how much work it takes to prepare and audit a set of financial statements for a senior government….But I looked at the financial statements of Exxon Mobile Corporation for the year ended 31 December 2016. Over the years 2012 to 2016, Exxon had revenue of between $451 billion and $219 billion, which is in the same range as the Government of Canada’s revenue totaling about $293 billion for the year ended 31 March 2017. In Exxon’s management discussion and analysis, about seven pages explain critical estimates and uncertainties they have to deal with in their accounting. They have to make estimates in complex areas, such as oil and natural gas reserves, impairments, asset retirement obligations, suspended exploratory well costs, and tax contingencies. Let us also not forget that their financial information will be relied on by users to make investment decisions. Despite all that, Exxon’s audit report for its 31 December 2016 financial statements is dated 22 February 2017, less than two months after its year-end. Speedy preparation of data by the federal government would be particularly helpful, because most other Canadian senior governments rely on Ottawa for tax information, without which they have difficulty finalizing their statements.
Alberta requires its public accounts to be published before the end of June; most governments, however, receive their auditor’s approval and produce their reports far later. Manitoba’s legislative date for tabling the public accounts is September 30, which, not surprisingly, is also the date they are often released. In our view, September 30 should be the latest date on which any government tables and releases its public accounts, with releases in June, July or August deserving bonus marks.
Legislators Should Review the Public Accounts
Finally, we underline the importance of legislative involvement at the end of the fiscal cycle, as well as at the beginning. With the exception of Quebec, every senior legislature has a standing committee on public accounts.1616 In the Quebec National Assembly, the Committee on Public Administration performs many functions of the public accounts committees in other jurisdictions, including an annual hearing with the provincial auditor general, but its role with respect to the public accounts is less comprehensive. Quebec’s auditor general has observed that an annual review of public accounts by a parliamentary committee would promote better oversight of the government’s performance (Quebec 2020, chap. 10). Chaired by a member of the opposition, these committees have responsibility for scrutinizing governmental effectiveness and efficiency, ensuring that the public accounts are timely and accurate and taking up concerns raised by the relevant auditor general.
Like the committees dealing with estimates, the public accounts committees typically will not generate the highest profile for their members. But that profile will largely reflect the degree to which members use their powers. The attention garnered by reports of legislative auditors – and by this annual C.D. Howe Institute report card – shows that people who insist on transparency and accountability for public funds can make a difference.
Canada’s Senior Governments Can Do Better
Governments play a massive role in the Canadian economy and in the lives of Canadians. The chains of accountability that link citizens’ wishes, through their elected representatives, with the officials who tax, regulate and serve them are long and complicated, and transparency and accountability in fiscal policy are essential. Canada’s senior governments have improved their reporting of their financial intentions, transactions and positions. Yet gaps remain. An intelligent and motivated, but non-expert, citizen seeking to understand a government’s current situation and plans should be able, quickly and confidently, to find the key figures in budgets, estimates and public accounts. That concerned citizen should be readily able to see what governments plan to do before the year starts and compare that with what they did shortly after the year has ended. Sadly, many governments do not make this possible.
Happily, however, they easily could. The high marks we give the top performers in this fiscal accountability report card reflect consolidated financial statements consistent with public sector accounting standards, and budgets, estimates and interim reports prepared on the same basis. Those are things any government can do. They also reflect presentations that make the key numbers readily accessible early in the relevant documents – again, any government can present that way. And they reflect timely presentations: budgets presented before the fiscal year starts and public accounts tabled shortly after fiscal year-end. Those, too, are things any government can do.
There is no mystery to the challenge. If Canadians insisted on better financial reporting from their governments, they could get it.
Appendix
References
British Columbia. 2017. Office of the Auditor General of British Columbia. “Understanding Our Audit Opinion on B.C.’s 2016/17 Summary Financial Statements.” Victoria. September.
Canada. 2001. Receiver General for Canada. Public Accounts of Canada 2001, vol. I. Ottawa. September.
Ferguson, Michael. 2017. “Why Is More Attention Not Paid to Government Financial Statements?” Presentation to the CPA Canada Public Sector Conference, Ottawa, October 23.
International Budget Partnership. 2020. “The Open Budget Survey, 2019.” Washington, DC. March.
OECD (Organisation for Economic Co-operation and Development). 2002. “OECD Best Practices for Budget Transparency.” Paris.
Public Sector Accounting Board. 2018. “Statement of Concepts: A Revised Conceptual Framework for the Canadian Public Sector.” Toronto. May.
Robson, William B.P. 1999. “Hiding the Good News: Ottawa’s Book-Cooking Is a Troubling Sign for the Future.” Backgrounder. Toronto: C.D. Howe Institute. February.
———. 2020. There Is No Try: Sustainable Healthcare Requires Reining in Spending Overshoots. Commentary 566. Toronto: C.D. Howe Institute. February.
Robson, William B.P., and Farah Omran. 2019a. Big Spenders: Canada’s Senior Governments Have a Bad Budget Habit. Commentary 548. Toronto: C.D. Howe Institute. July.
———. 2019b. From A to F: Grading the Fiscal Transparency of Canada’s Cities, 2019. Commentary 560. Toronto: C.D. Howe Institute. December.
———. 2019c. Show and Tell: Rating the Fiscal Accountability of Canada’s Senior Governments, 2019. Commentary 545. Toronto: C.D. Howe Institute. May.
———. 2020. What You See Is Not What You Get: Budgets versus Results in Canada’s Major Cities, 2019. Commentary 565. Toronto: C.D. Howe Institute. February.
Statistics Canada. 2019. “Table 10-10-0015-01 Statement of Government Operations and Balance Sheet, Government Finance Statistics, fourth quarter 2019.” Ottawa.
Quebec. 2020. Vérificateur général du Québec. Rapport du Vérificateur général du Québec à l’Assemblée nationale pour l’année 2019-2020. Quebec City.