





The Study In Brief
To provide a comparative view of electricity costs across Canada, this Commentary presents cost estimates for each province’s electricity system in 2018 and monthly costs facing representative consumer profiles in each province for 2019.
In 2018, Ontario, Nova Scotia and Alberta had the highest unit system costs for power – estimated at $143/MWh in Ontario, $133/MWh in Nova Scotia and $122/MWh in Alberta. Provinces relying predominantly on hydro generation have the lowest unit system costs: in 2018, Quebec and Newfoundland and Labrador had the lowest unit system costs at $70/MWh, followed by Manitoba ($87/MWh) and British Columbia ($97/MWh).
However, while useful in comparing electricity costs across provinces, the system cost in a given province is not charged uniformly to each consumer class. The complex set of rate components results in unit power costs (i.e., $/ MWh) that, in turn, differ between consumer classes. In most provinces, industrial consumers pay the lowest unit power costs, followed by commercial consumers, with small business and residential consumers paying the highest unit costs. The exception is Ontario, where taxpayer-funded rebates result in very low power costs for residential and small business consumers while industrial and commercial consumers face higher costs relative to other provinces.
As well, electricity costs have increased for various consumer classes over the past five years – particularly in Ontario and Alberta. The analysis of components of systems’ costs and consumers’ rates revealed that growth in Alberta’s system costs and consumer rates was primarily driven by increases in transmission and distribution costs, while in Ontario, heightened energy costs (through the growing Global Adjustment, which covers the gap between contract costs and market rates) drove increased costs for non-residential consumers. Although Ontario’s industrial consumers may benefit from the Industrial Conservation Initiative (the “ICI,” under which a consumer may reduce its share of the Global Adjustment by avoiding the year’s five highest peak demand periods), such rate reductions are not automatic, and any reduction of the Global Adjustment under the ICI for a given consumer shifts these costs onto other consumers.
This analysis of electricity prices underscores several important policy considerations. These are particularly relevant as policymakers contemplate changes to the design of markets and structure of electricity rates. First is closer alignment of the marginal prices (that is, the price of an incremental unit of electricity), facing different classes of consumers with the marginal costs for providing electricity – for example, introduction of dynamic or time-of-use pricing, as well as critical peak pricing and direct load control. Second is the efficient allocation of fixed system costs (e.g., the infrastructure for transmission and distribution, as well as the costs of generation) – for example, through lower prices for more price-sensitive consumers to avoid defection of load or departure from the grid.
Finally, policymakers should scrutinize the competitiveness of a province’s overall system costs in order to ensure the efficient attraction and retention of economic activity. If all other costs are equal, an industrial firm – particularly in a trade-exposed, electricity-intensive industry – will rationally locate production in the jurisdiction where the producer minimizes its electricity costs. Therefore, the comparative costs of generating electricity can be an important source of comparative advantage for a given province – for example, the access to relatively low-cost hydroelectric resources in Quebec or Manitoba.
Introduction
This Commentary provides a comparative view of power prices across Canada and explores the impact from the structure of rates on electricity consumption by residential, commercial, industrial and farm consumers.
The structure and level of power prices matter to the economic efficiency of power consumption. The costs for power facing commercial or industrial consumers also influence the attractiveness of locating business in a given jurisdiction – particularly electricity-intensive industries with internationally traded products. As the composition of power generation shifts and consumers increase and broaden their reliance on electricity for energy needs (e.g., vehicle electrification), it will be increasingly important to align consumption incentives (i.e., electricity rates) with system costs. Advances in technology increasingly enable real-time responses of demand to pricing, and a mismatch between rate structure and system costs can induce economically inefficient depression of power consumption and excessive investments in distributed generation. A comparative picture of power costs across Canada can inform policymaking and planning for electricity systems.
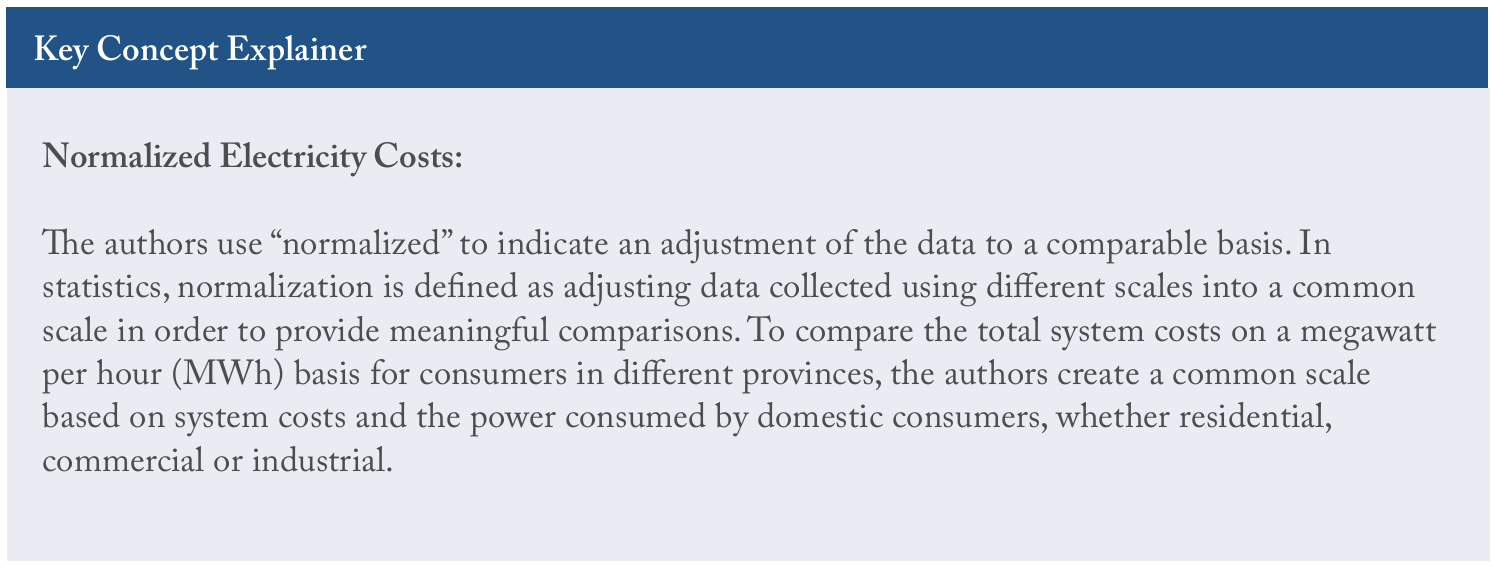
This Commentary examines the structure and level of power prices across Canadian provinces, including how these differ across consumer classes (e.g., industrial, small business or residential) and have changed over time. Provinces – and indeed service areas – have specific rate structures and various tariff components, and this compilation and presentation of electricity costs therefore represents a unique contribution. To compare pricing for each consumer class, the analysis in this paper incorporates a survey of rates from each power provider and applies these to defined profiles for each consumer type.11 This comprehensive dataset of tariffs for power across provinces is available on request. Additionally, this paper compares the normalized system cost of power – defined here as the total revenues from domestic consumers divided by domestic consumption – across provinces.
Comparing power prices – particularly across jurisdictions – is not a straightforward exercise. The cost for power facing a given consumer class typically involves a set of fixed charges and variable rates (i.e., a charge for each unit of power consumed). For certain consumers in certain provinces, power is charged in blocks, with either increasing or decreasing prices with greater consumption. As well, commercial or industrial consumers frequently face demand charges set according to the given consumer’s average or maximum load and certain provinces provide incentives for reducing demand in particular hours. This paper breaks down the contribution of fixed, demand, variable and energy components of power rates to the overall costs facing different consumer classes. Although power rates for each consumer class follow roughly similar designs across provinces, the costs for different components can differ significantly.
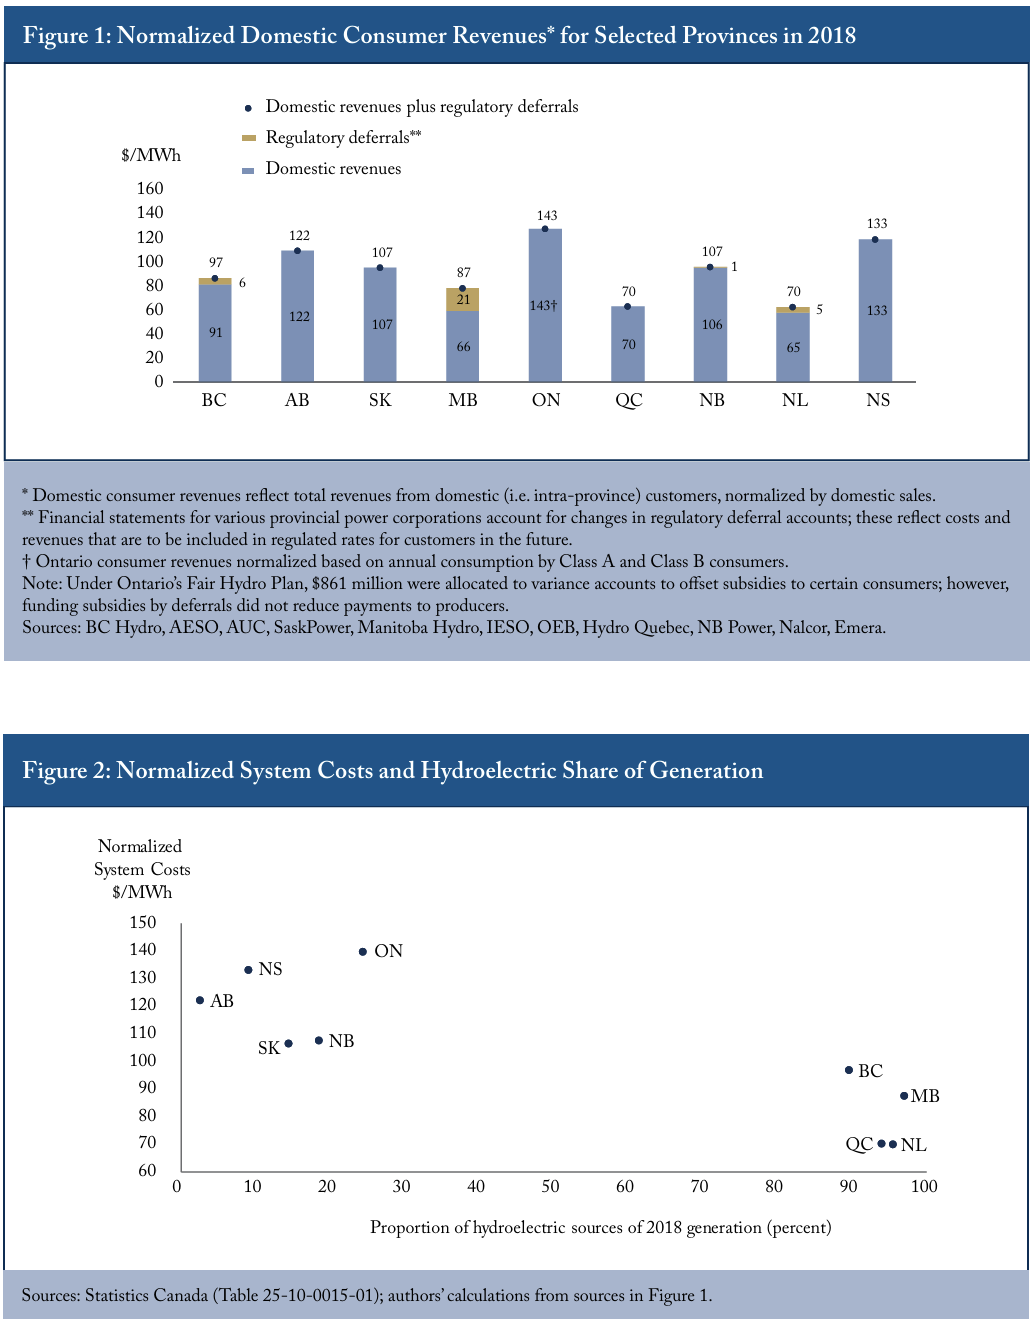
This Commentary shows that the normalized system cost of power (i.e., the cost of each province’s electricity system to domestic consumers on a $ per MWh basis) differs significantly across provinces. Such system costs include generation, transmission, and distribution costs. For a system as a whole, some costs may be variable (for example, fuel for generation or payments to power producers) and others are fixed, at least in the short run (for example, infrastructure to deliver power). In 2018, Ontario, Nova Scotia and Alberta had the highest unit system costs for power – estimated at $143/MWh in Ontario, $133/MWh in Nova Scotia and $122/MWh in Alberta. Provinces relying predominantly on hydro generation had the lowest unit system costs: in 2018, Quebec and Newfoundland and Labrador had the lowest unit system costs at $70/MWh, followed by Manitoba ($87/MWh) and British Columbia ($97/MWh).22 The observation that provinces with a relative abundance of hydro face lower relative costs may reflect the long-lived character of these assets. In certain cases, the capital costs of these long-lived assets may be treated as fully depreciated for rate-setting purposes. For any investment in construction of new hydro assets, an investor must expect to recover the capital costs over the life of the asset.
While useful in comparing electricity costs across provinces, the system cost in a given province is not charged uniformly to each consumer class. The complex set of rate components results in unit power costs (i.e., $/MWh) that, in turn, differ between consumer classes. In most provinces, industrial consumers pay the lowest unit power costs, followed by commercial consumers, with small business and residential consumers paying the highest unit costs. The exception is Ontario, where taxpayer-funded rebates result in very low power costs for residential and small business consumers while industrial and larger commercial consumers face higher costs relative to other provinces.
While certain industrial consumers may benefit from incentives to limit demand at particular times, such rate reductions are not automatic. For example, Ontario’s Industrial Conservation Initiative (ICI) requires an industrial consumer to correctly predict and dramatically reduce consumption during the five hours with highest system-wide consumption. Even when taking into account average savings for large industrial consumers under Ontario’s ICI, power costs for the industrial consumer profile analyzed in this paper would remain above all other provinces except Nova Scotia.
This paper proceeds by: first, comparing unit system costs across major provinces; second, providing an overview of power consumption and consumer rate structures across provinces; third, based on defined profiles for each consumer class, comparing estimated monthly power costs across provinces; fourth, exhibiting changes in power prices in the past five years for select provinces; and, finally, commenting on implications for the efficient structuring of power prices.
PART I Comparative System Costs across Provinces
Figure 1 exhibits estimates of comparative system costs for domestic consumers across provinces in 2018.
The basis for this comparison is the sum of revenues paid by domestic consumers in each province, as well as changes to regulatory deferral accounts,33 A regulatory deferral account balance is an amount of expense or income that qualifies to be deferred because the amount is included, or is expected to be included, by a rate regulator in establishing the price that an entity can charge to customers for rate-regulated goods or services. Regulatory deferrals are included in these estimates of system costs because these are included in the Crown corporation’s accounting of its comprehensive income and reflect in-year costs by the given regulated entity to be recovered from consumers in future rates. normalized by the total power consumption from each province’s grid.
For provinces with an effective monopoly provider of electricity (all provinces except Ontario and Alberta),44 In British Columbia, BC hydro serves approximately 90 percent of the province; however, certain areas are served by Fortis and certain cities (e.g.,New Westminster) also maintain local distributors. the estimates reflect the consumer revenues and regulatory deferrals by the respective Crown corporation. For Ontario and Alberta, the estimates reflect the aggregation across the different components of the electricity system (generation, transmission, distribution and system operation). Since the aim is to estimate the relative costs to domestic consumers within the respective province, revenues from exported power are not included in the estimate.55 It should be noted that provinces with significant power exports may have invested in additional transmission capacity to enable interconnection with export markets. The approach used in this paper for provinces with vertically integrated electricity providers (e.g., British Columbia, Manitoba or Quebec) avoids this problem: in these provinces, the system cost reflects revenues only from domestic consumers and this is normalized by electricity consumption by these domestic consumers. This is therefore only a potential discrepancy in Ontario and Alberta where the analysis uses revenues for each component of the system (i.e., generation, transmission, distribution and system administration). Because transmission is available to all electricity dispatched in these markets, the available data for transmission revenues do not distinguish between those from domestic and export consumers.
Dividing the respective revenues and regulatory deferrals by the total power consumption from the grid provides a normalized estimate of each province’s relative costs to consumers.
Based on these estimates, Ontario faced the highest system costs in 2018, followed by Nova Scotia and Alberta. Quebec and Newfoundland and Labrador had the lowest system costs, followed by Manitoba and British Columbia. Provinces with greater weight placed on hydroelectric power achieved lower relative system costs (see Figure 2).
The comparison of relative system costs is complicated by differing market structures across provinces.
For those provinces with monopoly power providers, the annual reports of their respective Crown corporations report revenues from all consumers and the total consumption by each consumer class, as well as any changes to regulatory deferral accounts. Each of these provinces has a regulatory body that regulates the rates that participants in the power system charge for transmission and distribution services, as well as the rates facing end-use consumers.
For Ontario and Alberta, the costs to domestic consumers must be estimated by aggregating the revenues accruing from consumers to the different operators of each component of the system. Unlike other provinces, Ontario and Alberta have no monopoly electricity entity (i.e., not vertically integrated) and instead organize the supply of power with a variety of different operators involved in each component. For these provinces, estimating system costs requires summing revenues for power producers, distribution entities, transmission provision and system operation. The first section below describes the estimation of system costs and basis for normalizing these estimates in Ontario. The next section provides a similar description of normalized system costs for Alberta.
For all provinces, trade in electricity with other jurisdictions both delivers power imports for domestic (i.e., intra-province) consumption and provides revenues through the export of power. It is beyond the scope of this paper to relate the costs of electricity imports and revenues from exports to the relative domestic power costs in each province. However, further below this paper discusses the extent of each province’s trade in electricity and, where available, the relative export and import prices for power.
Ontario Normalized Electricity System Costs
Figure 3 exhibits the estimated revenues from each component of Ontario’s electricity system.66 Figure 3 does not directly include the fiscal costs from Ontario’s taxpayer-funded Global Adjustment Rebate for residential and small business consumers. The fiscal costs of these rebates and impact on consumer electricity costs are further discussed in Box 2 below. However, the fiscal costs for the rebates do not impact this calculation of Ontario’s system costs: the rebates offset certain consumers’ net costs for the Global Adjustment but do not reduce the amount of payments to producers funded by the Global Adjustment. All revenues are in current dollars (i.e., rather than adjusted for inflation).
For Ontario, various companies operate facilities to generate power, deriving revenue under long-term power contracts (amounts paid under these contracts are aggregated into the “Global Adjustment”)77 Certain power generation assets (e.g., nuclear and hydro owned by Ontario Power Generation) face regulated rates. The Global Adjustment includes amounts for these assets. As well, the Global Adjustment also includes amounts for conservation programs. Costs for conservation programs comprised approximately 3 percent of total Global Adjustment charges in 2019 and 4 percent in 2018. Costs for contracted power and regulated rates comprised 97 percent of the Global Adjustment in 2019 and 95 percent in 2018. and from payments in the a real-time wholesale market (the “Hourly Ontario Energy Price” or “HOEP”).88 More specifically, the HOEP is the average of the 12 market clearing prices set in each hour (i.e., new market clearing price is set every five minutes). The HOEP reflects the weighted average of these five-minute prices. Ontario’s wholesale market is operated by the Independent Electricity System Operator (IESO), which collects administration fees to fund its operations.
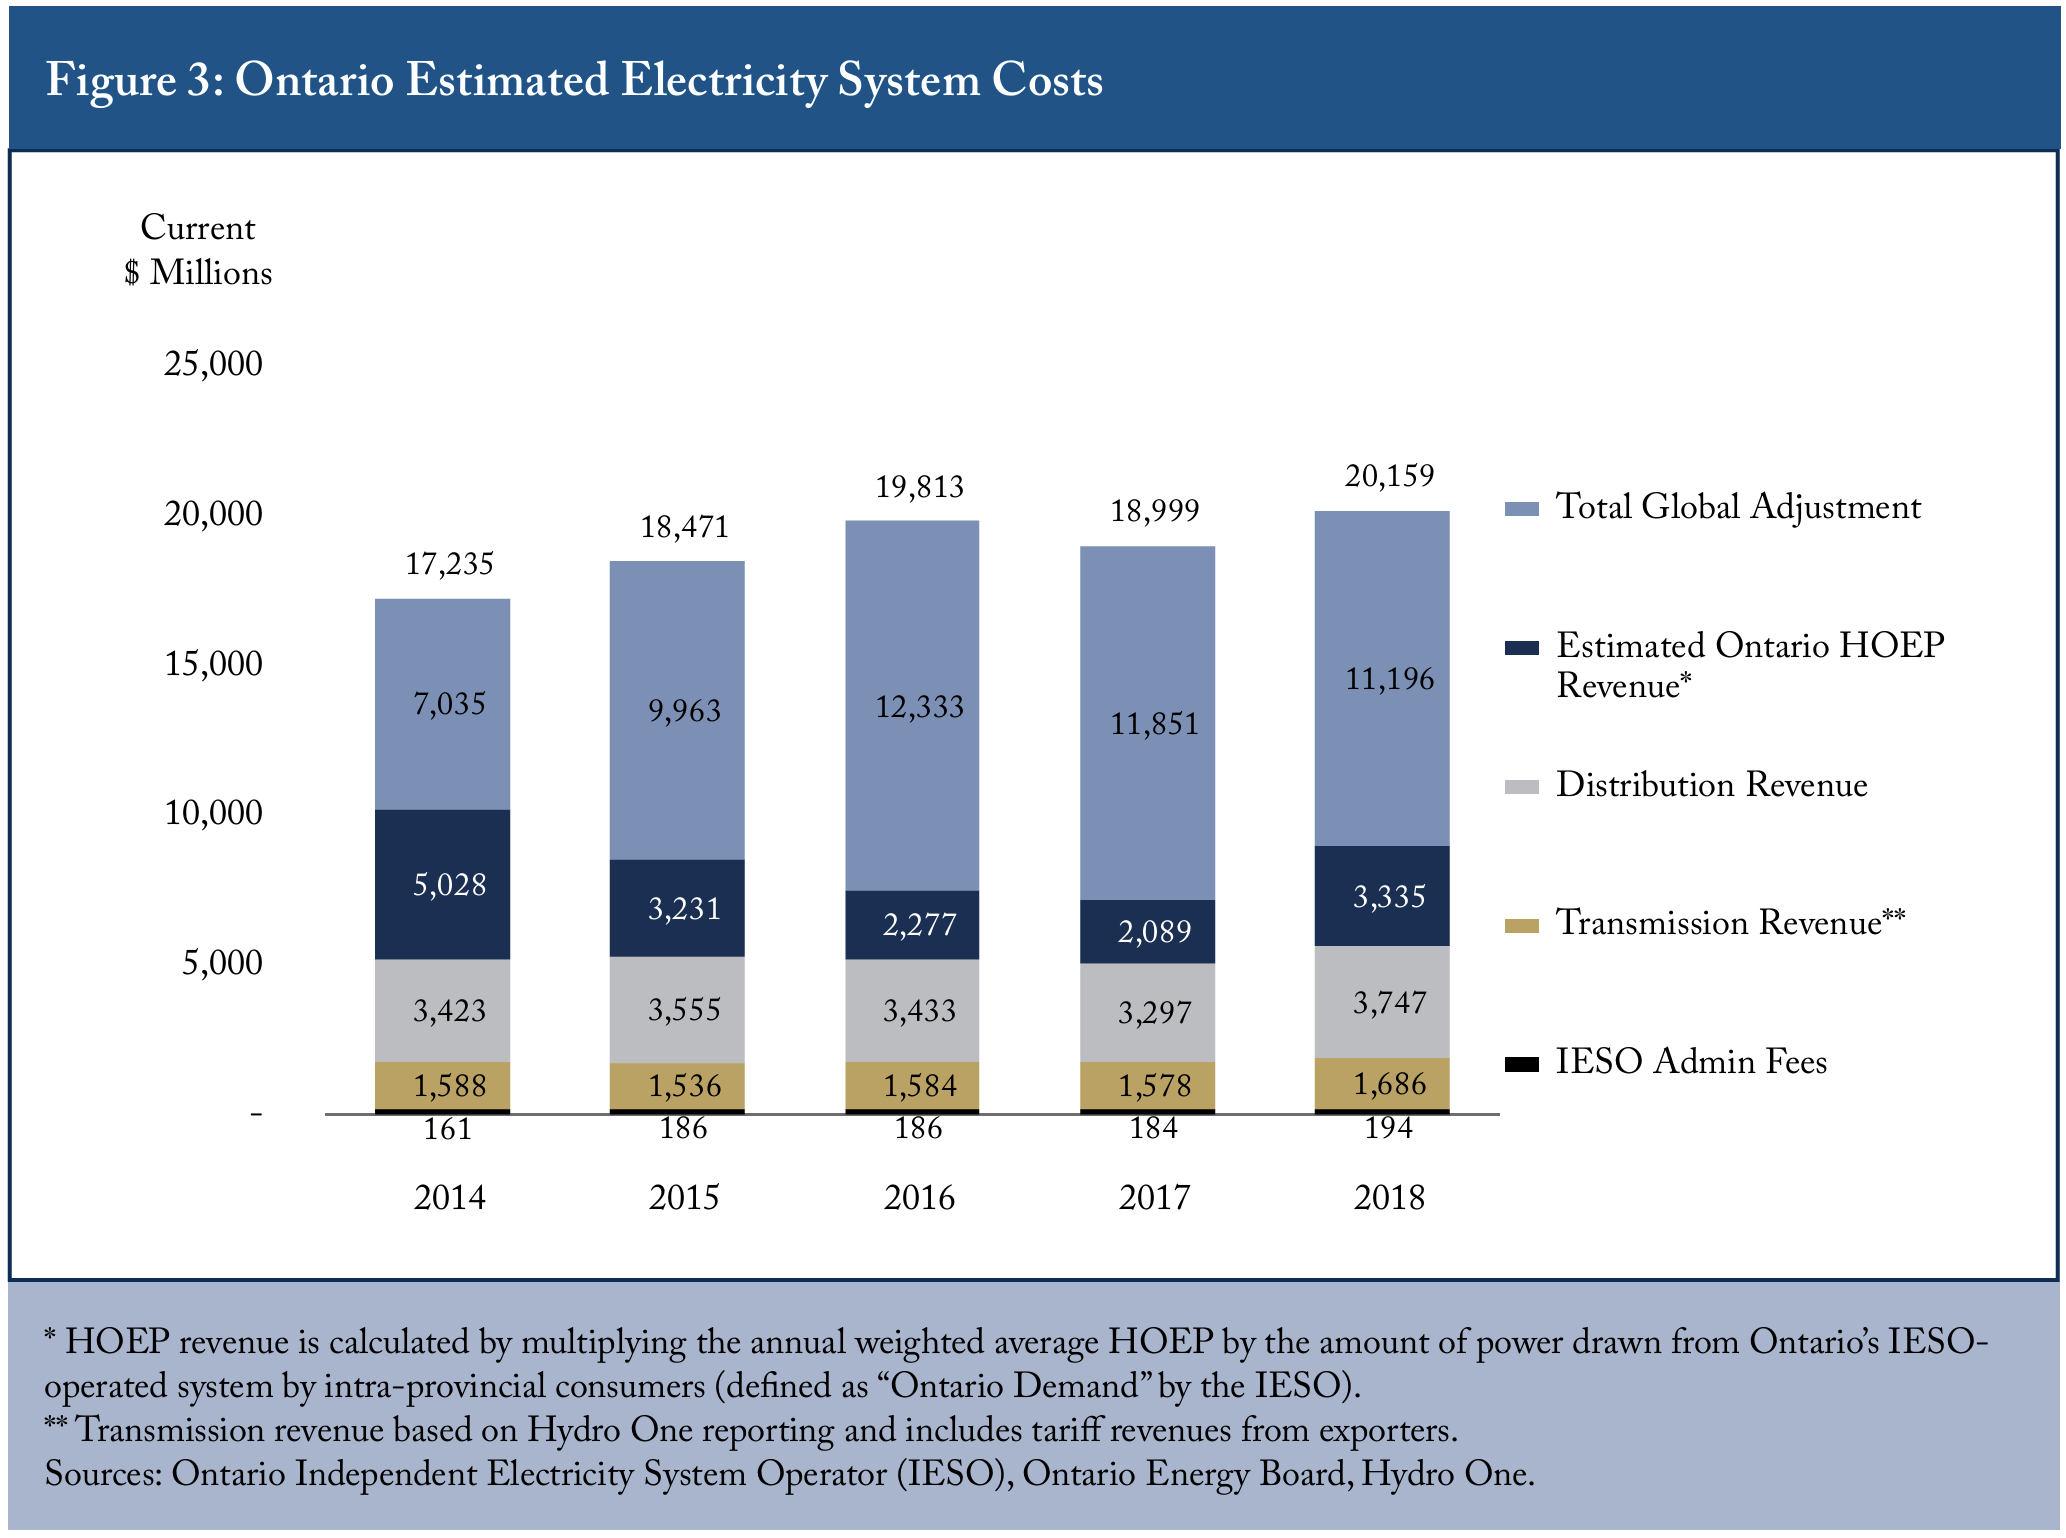
To estimate revenues for power producers in Ontario, this paper sums the annual Global Adjustment amounts and the estimated Ontario HOEP revenue.99 The estimated Ontario HOEP revenue is calculated by multiplying the annual weighted average HOEP by the amount of power drawn from Ontario’s IESO-operated system by intra-provincial consumers (defined as “Ontario Demand” by the IESO). Therefore, for consistency with the exclusion of export revenues in other provinces, this estimate excludes revenues from exported electricity. Again, the Global Adjustment reflects recovery of contracted or rate-regulated prices that is not funded by the wholesale market price (HOEP).1010 Since many contracts are structured to provide fixed prices for generators (i.e., with payments through the Global Adjustment funding the difference between a generator’s realized wholesale price and the contract price), the Global Adjustment has grown markedly as the average HOEP has declined. This dynamic is elaborated in Box 2 below.
Almost all transmission in Ontario is provided by Hydro One, a publicly listed and privatized corporation in which the Ontario government is the controlling shareholder. Hydro One operates transmission facilities under regulated tariffs and charges distributors and directly connected consumers for transmission services. Distribution services are provided by various local distributors (including Hydro One) that service distributionconnected consumers in given geographic service areas. The Ontario Energy Board regulates these local distribution companies (LDCs) and annually collects financial reporting of their revenues.
Note that these estimates of costs exclude fees collected for programs administered by the IESO and any charges or other payments resulting from government assumption of debt or support for capital costs. A comparison and comprehensive analysis of non-rate channels for subsidizing system components is beyond the scope of this paper. This approach of examining revenues for each system component that are paid by ratepayers is conceptually consistent with the view of revenues from each ratepayer class in other provinces.
To normalize Ontario’s system costs for comparison with other provinces, this estimate of Ontario’s system cost is divided by the total consumption by all domestic consumers (i.e., both Class A and Class B) reported by the IESO in its Global Adjustment reporting. This normalized system cost from 2014 to 2018 is shown in Figure 5.
Other measures of power consumption in Ontario are illustrated in Figure 4. “Ontario Demand” reflects the total power drawn from Ontario’s IESO-operated system,1111 Ontario Demand does not include power produced by “embedded generation” (that is, distribution-connected power generation) and delivered to distribution consumers by individual LDCs. This paper’s authors have been unable to obtain annual reporting of the total power produced by embedded generation in Ontario. and is exhibted for 2014-2018 on Figure 4. Also exhibited on Figure 4, “Market Demand” represents all power drawn from Ontario’s IESO-operated system, including exports of Ontario electricity. Ontario’s system also involves consumption of power from distribution-connected (“embedded”) generation (6.8 TWh of Ontario’s total estimated 144 TWh domestic consumption in 2018).1212 Such distribution-connected generation is small-scale generation located within local distribution companies’ territories. Since such generation is not transmitted on the IESO-operated grid, it is not included in “Ontario Demand.” The total generation from distribution-connected generation is reported for 2018 by the Ontario Energy Board, and the sum of Ontario Demand and this distributionconnected generation is illustrated in Figure 4.
Based on the estimate of system cost in Figure 3 and consumption by domestic consumers (Class A and Class B) in Figure 4, Figure 5 exhibits Ontario’s normalized system costs in terms of dollars per MWh for the years from 2014 to 2018. This illustrates that the growth in Ontario’s system costs since 2014 have been driven by increases in the costs for producing power – particularly the increases in the Global Adjustment.
Alberta Normalized Electricity System Costs
For Alberta, Figure 6 exhibits the estimated costs for domestic consumers of each component of the province’s electricity system from 2014 to 2018. All revenues are in current dollars (i.e., rather than adjusted for inflation).
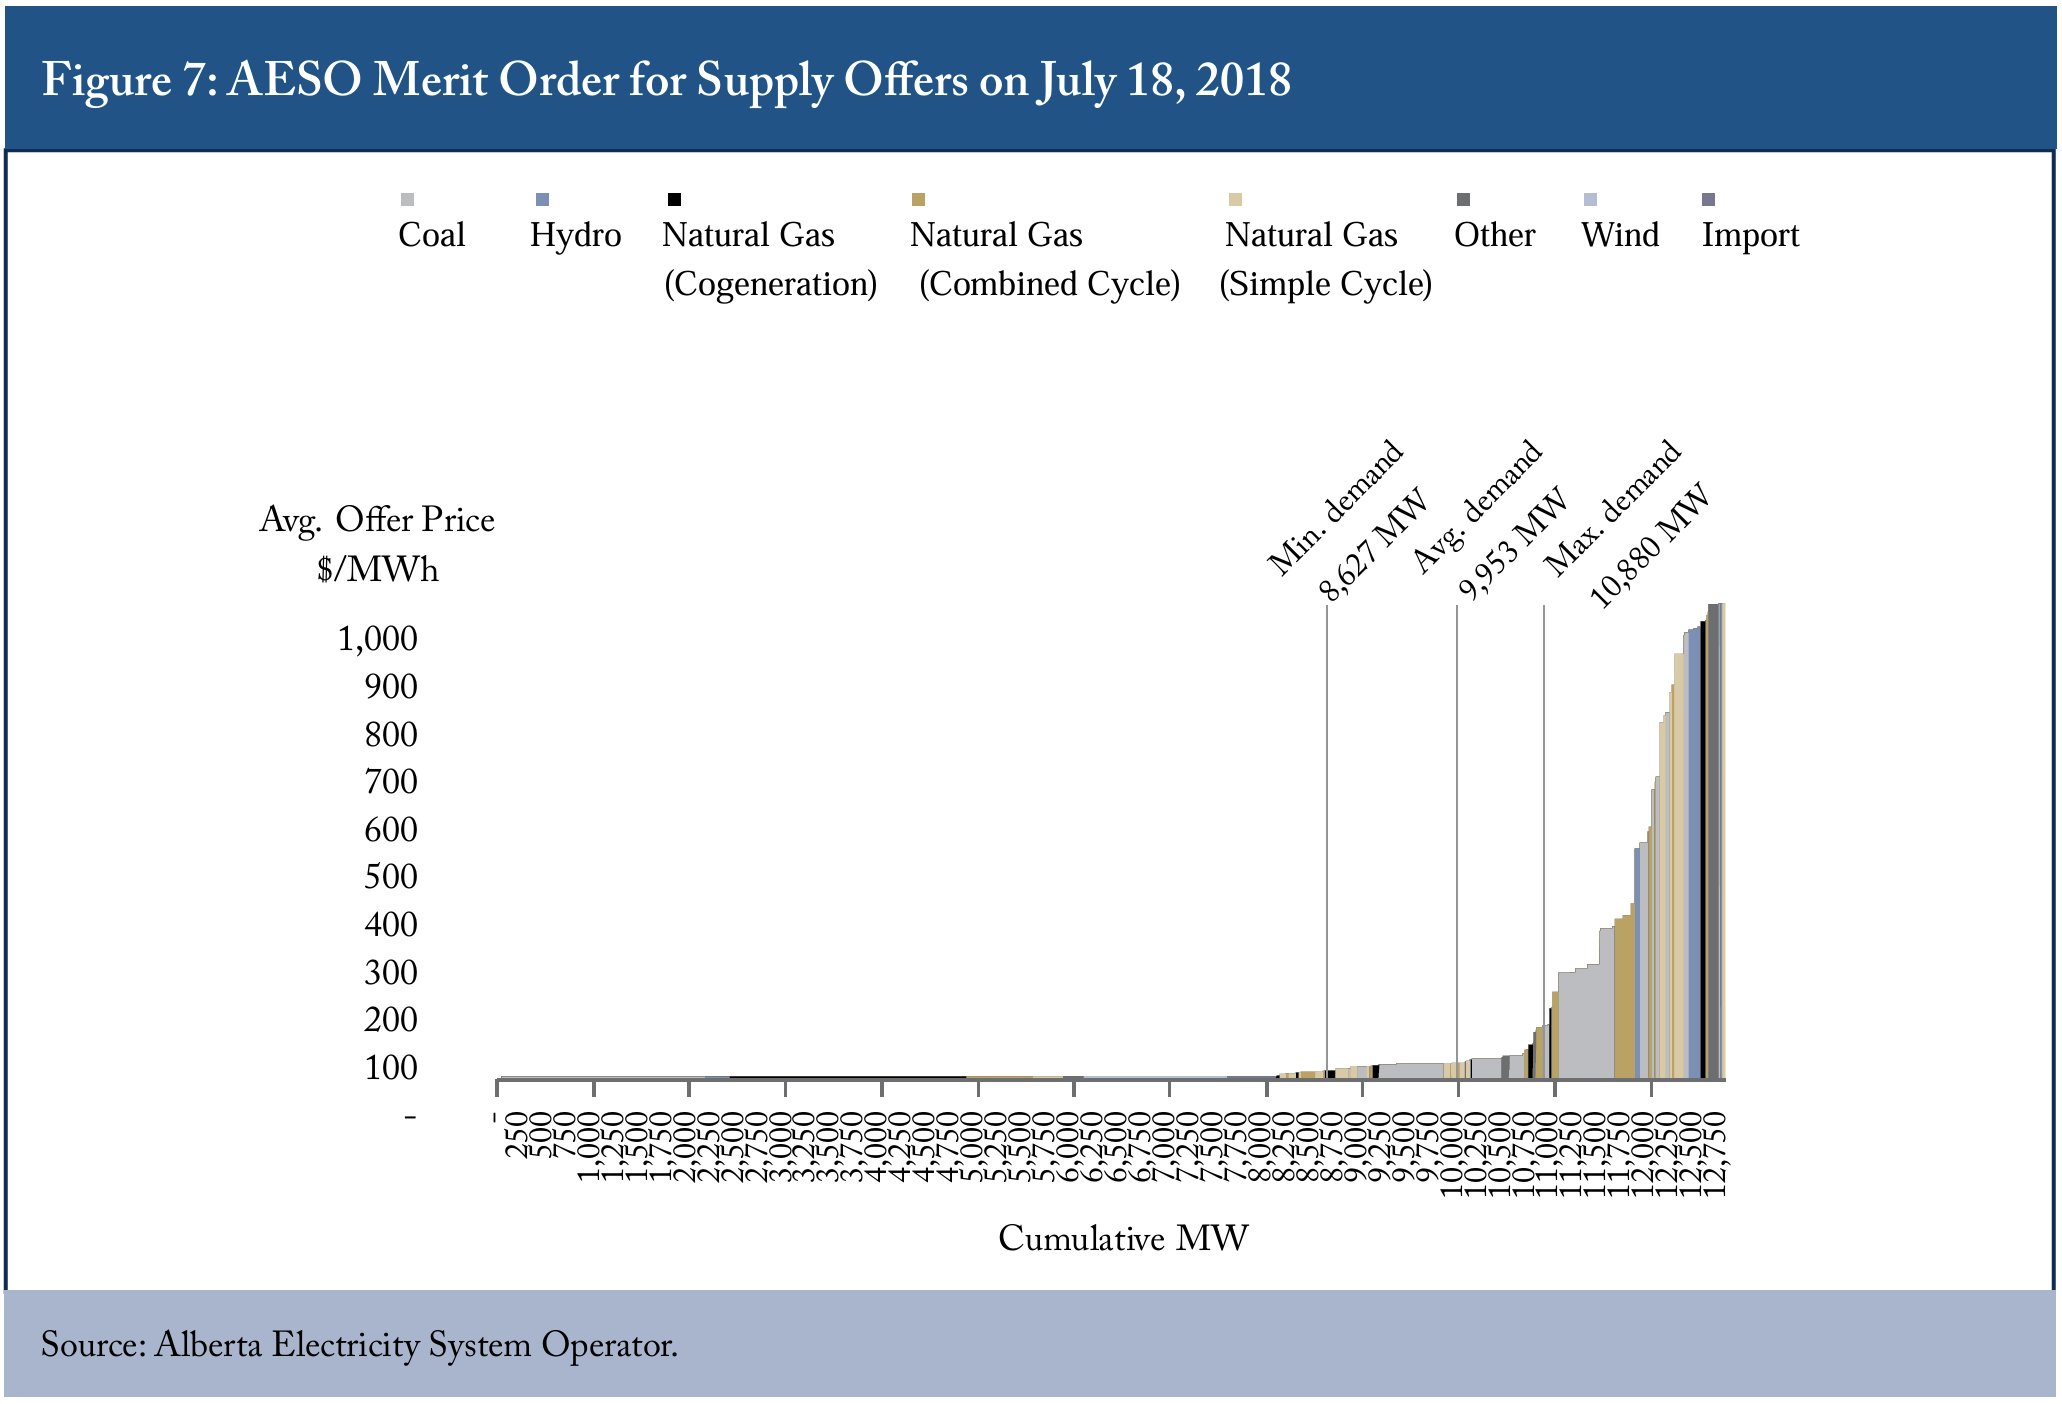
Energy market revenue is estimated based on Alberta’s system load multiplied by the weighted average price in Alberta’s wholesale energy market. The Alberta Electric System Operator (AESO) operates Alberta’s grid-provided power and Alberta’s competitive wholesale energy market – the so-called “power pool.” Revenues for Alberta’s power producers from domestic consumers primarily accrue through this energy-only power market.1313 Certain power producers have power purchase agreements with specific power consumers. However, such contracts relate to the bilateral settlement of payments between these consumers and producers at agreed power prices. Except where electricity is delivered directly from generators to consumers (e.g., an on-site co-generation plant), these producers still deliver energy onto Alberta’s grid and receive revenues based on the market-based energy price for the delivery. Since these are private arrangements by individual consumers and producers outside the AESO-operated system, these are not included in the revenues here. In contrast, balancing pool revenues/payments are included because these are charged or rebated across all participants in the AESO-operated system. For each hour, producers offer blocks of electricity into the power pool for given prices. Based on these offers, AESO constructs a “merit order” for dispatching electricity, scheduling dispatch in order of the lowest to the highest offers. For any hour, the marginal system price is determined based on the offer of the last dispatched producer on the merit order that balances supply and demand for the system. As an illustrative example, Figure 7 exhibits the average prices across the merit order of blocks of power offered by power producers on July 18, 2018.


Consumers from the AESO-operated system also make payments to or receive rebates from Alberta’s Balancing Pool. The Balancing Pool is a legacy of Alberta’s transition to a competitive electricity system and manages power purchase arrangements (PPAs) that facilitated that transition in the late 1990s/early 2000s. The net proceeds or costs from the PPAs held by the Balancing Pool have been rebated or charged as an annual consumer allocation. Many unprofitable PPAs held by private entities were terminated and thus returned to the Balancing Pool in 2015 and 2016, and since 2017 Alberta consumers have faced annual charges to recover these costs.1414 Details of annual consumer allocations are provided by the Balancing Pool (Available online: http://www.balancingpool.ca/consumer-allocation-2001-2019/).
Alberta’s distribution tariff revenue has been compiled from reporting by Alberta’s four distributors (Enmax, Epcor, ATCO and FortisAlberta) to the Alberta Utilities Commission. Transmission revenues in Alberta are based on the reporting of “wires costs” by the AESO,1515 Since transmission costs are charged to consumers by the AESO for flow-through to transmission providers, AESO’s annual reporting provides a consistent figure for total payments. Transmission providers also report transmission tariff revenue to the Alberta Utilities Commission. Aggregate transmission tariff revenue compiled from this annual reporting roughly reconciles with the AESO wires costs. However, for consistency, wires costs are used here as the preferred source. and the costs associated with system operation based on AESO’s non-wires costs.
To normalize Alberta’s system costs, the estimate of system costs is divided by Alberta’s System Load, reported annually by the AESO.1616 AESO Annual Market Statistics (2019) report “average system load,” and the total system load is calculated by multiplying this average system load by 24 hours/day and 365 days/year. Figure 8 exhibits System Load for the years 2014 to 2018, as well as Alberta Internal Demand and Distribution Energy Sales. In contrast with System Load, Alberta Internal Demand includes power produced and consumed “behind the meter” (i.e., on-site generation that is not delivered to the grid). Distribution Energy Sales are calculated based on the annual reporting from distributors to the Alberta Utilities Commission and are a subcategory of System Load.1717 The difference between Distribution Energy Sales and System Load reflects directly connected loads from the AESOoperated system.

Figure 9 shows the estimated normalized system cost for Alberta from 2014 to 2018 (i.e., estimated total system costs in Figure 6 normalized by System Load in Figure 8). This illustrates how Alberta’s overall system costs have evolved as power prices declined and then rebounded over the interval. Based on this analysis, an increase in normalized system costs for Alberta’s system between 2014 and 2018 resulted from increases in the costs associated with distribution tariffs and, in particular, wires (i.e., transmission).
Imports and Exports of Electricity
An analysis of the impact of electricity trade on system costs in each province is beyond the scope of this paper. Nonetheless, electricity trade impacts the ultimate prices facing consumers, both through the cost of imports and revenues from exports. Since supply and demand on the grid must be balanced instantaneously, electricity imports may fulfill consumption at a lower cost than domestic generation in certain hours. As well, exports may use generation capacity that would otherwise be idle and export revenues may thereby offset fixed costs for domestic consumers.

Based on data from Statistics Canada for 2018, Figure 10 shows each province’s exports and imports – both with other provinces and with U.S. jurisdictions – as well as generation and final supply. This shows the extent of power trade and overall supply in absolute terms, illustrating that, while a given province may be a net importer or net exporter, every province (with the exception of Newfoundland and Labrador) engages in significant bilateral trade of electricity. Many provinces will import electricity in certain hours (e.g., when the import price is less than the marginal cost for domestic generation) while exporting in other hours (e.g., when the export price is greater than the marginal cost for generation and available generation exceeds domestic demand). Given the different system structures across provinces, the extent of trade may depend on supply, demand and market prices in a given hour. As well, market rules (e.g., for offers into a real-time market), bilateral arrangements (e.g., contracted power) and transmission capacity (i.e., capacity of interconnections between grids) will also determine the extent of a province’s imports and exports.
As relative measures of trade for each province’s electricity system in 2018, Figure 11 exhibits the export share of generation in each province and Figure 12 exhibits the import share of final electricity supply. Alberta and Saskatchewan engaged in relatively minimal trade in electricity. Ontario and Quebec were net exporters but nonetheless imported significant amounts of electricity relative to final supply. While both were net importing provinces in 2018, British Columbia and New Brunswick also exported significant amounts of power – roughly 15 percent of generation from British Columbia and over 20 percent from New Brunswick. Notably, Newfoundland and Labrador exports the vast majority of power produced in the province. This primarily reflects sales of power to Hydro-Quebec from the Churchill Falls generating station in Labrador under a 65-year take-or-pay contract that will expire in 2041.
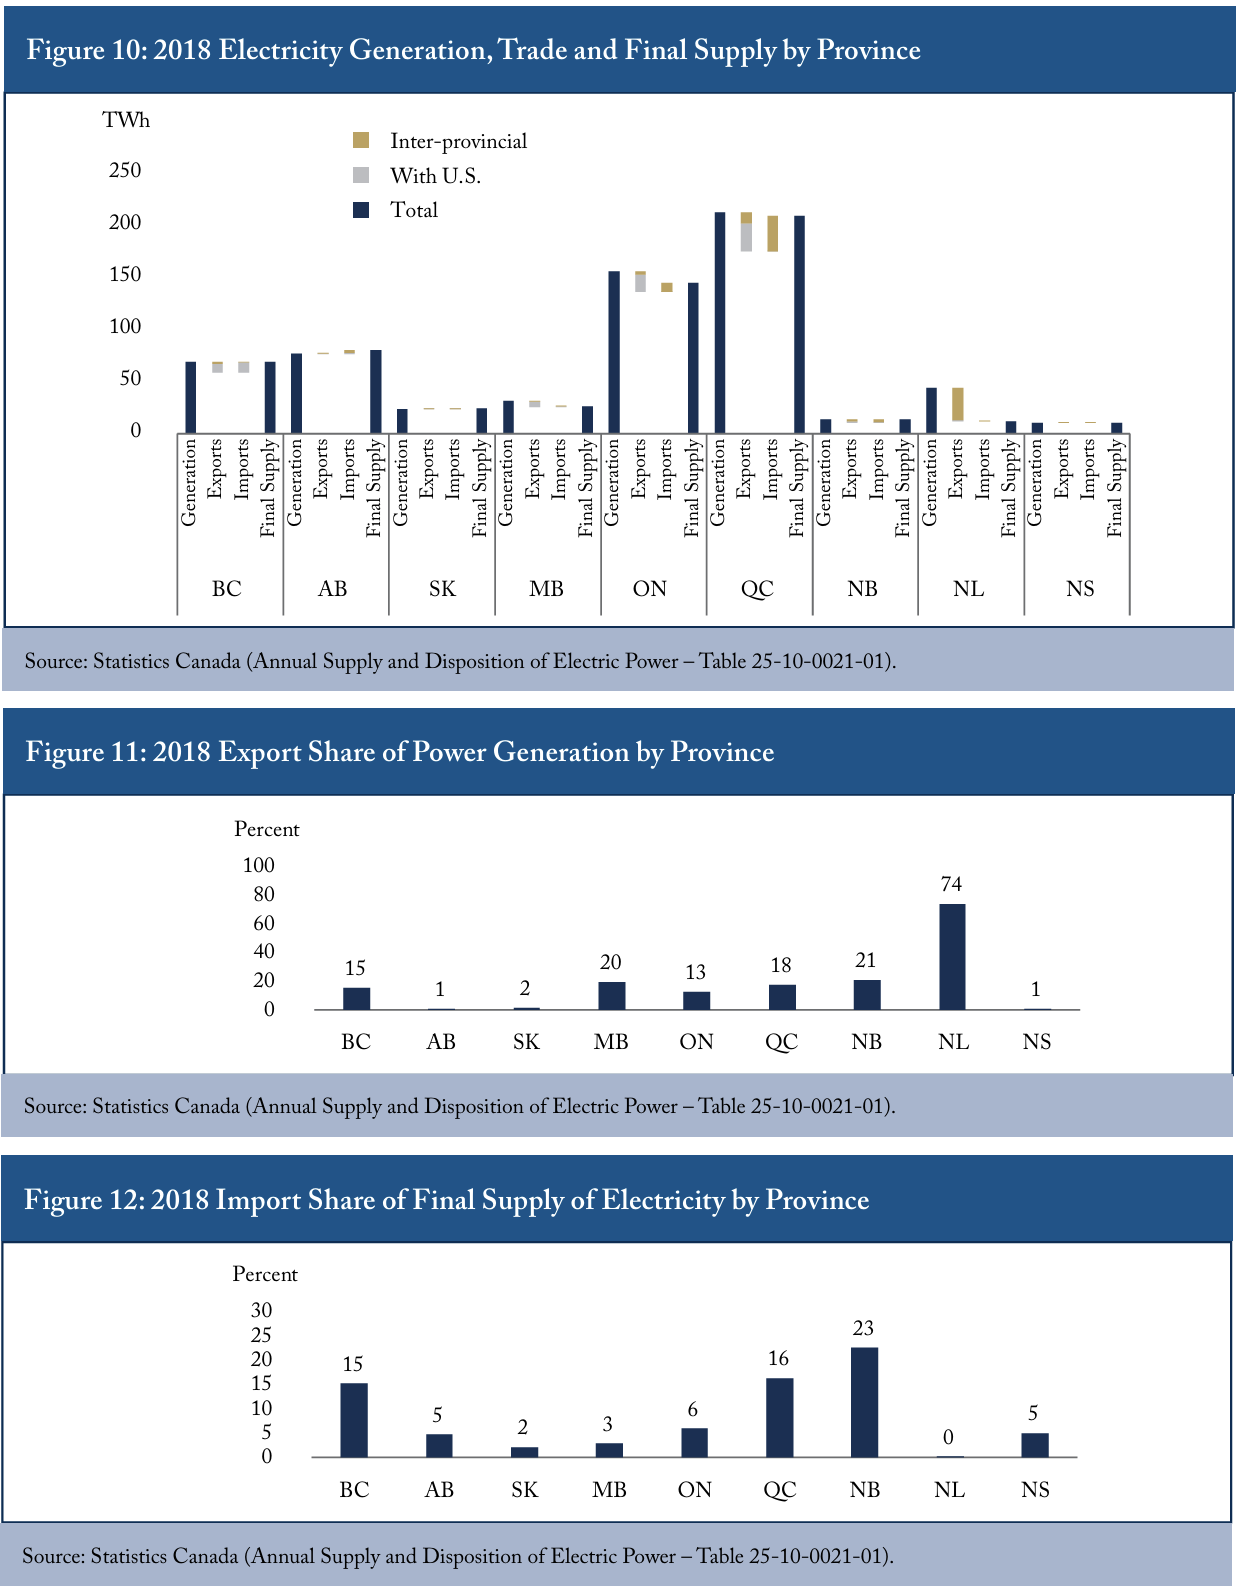
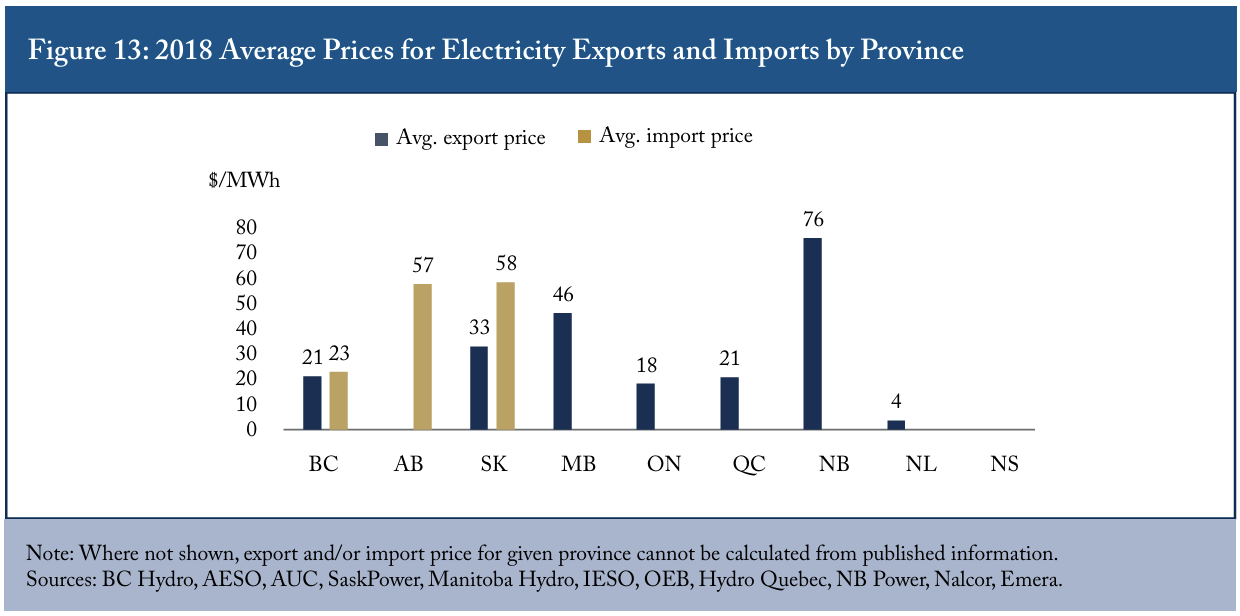
Import and export prices also appear to differ widely across provinces. Where published data are available, Figure 13 provides average prices for exports and imports for the given province in 2018.1818 These prices are based on reported sales and purchase volumes and revenues published in annual reporting by each province’s power corporation or system operator. Where an average import or export price is not provided in Figure 13, data were not available in the given province. For example, financial statements by Emera did not allow for import and export prices to be computed for Nova Scotia. The opportunities and prices for exporting and importing power will depend on demand and supply in adjacent jurisdictions. Therefore, geography imposes constraints on the extent of and returns to trade. The low average export price faced by Newfoundland and Labrador in 2018 reflects the long-term contract for export of generation from Churchill Falls to Quebec. Notably, Quebec’s average export price in 2018 was significantly higher than the average export price for Newfoundland and Labrador.
PART II Comparative Power Consumption and Rate Structures across Provinces
Provinces differ in the degree to which different classes of consumers consume electricity. Climatic differences and available sources of energy in each province contribute to these differences. As well, the different structure of industry across provinces results in differences in the composition of overall power demand.
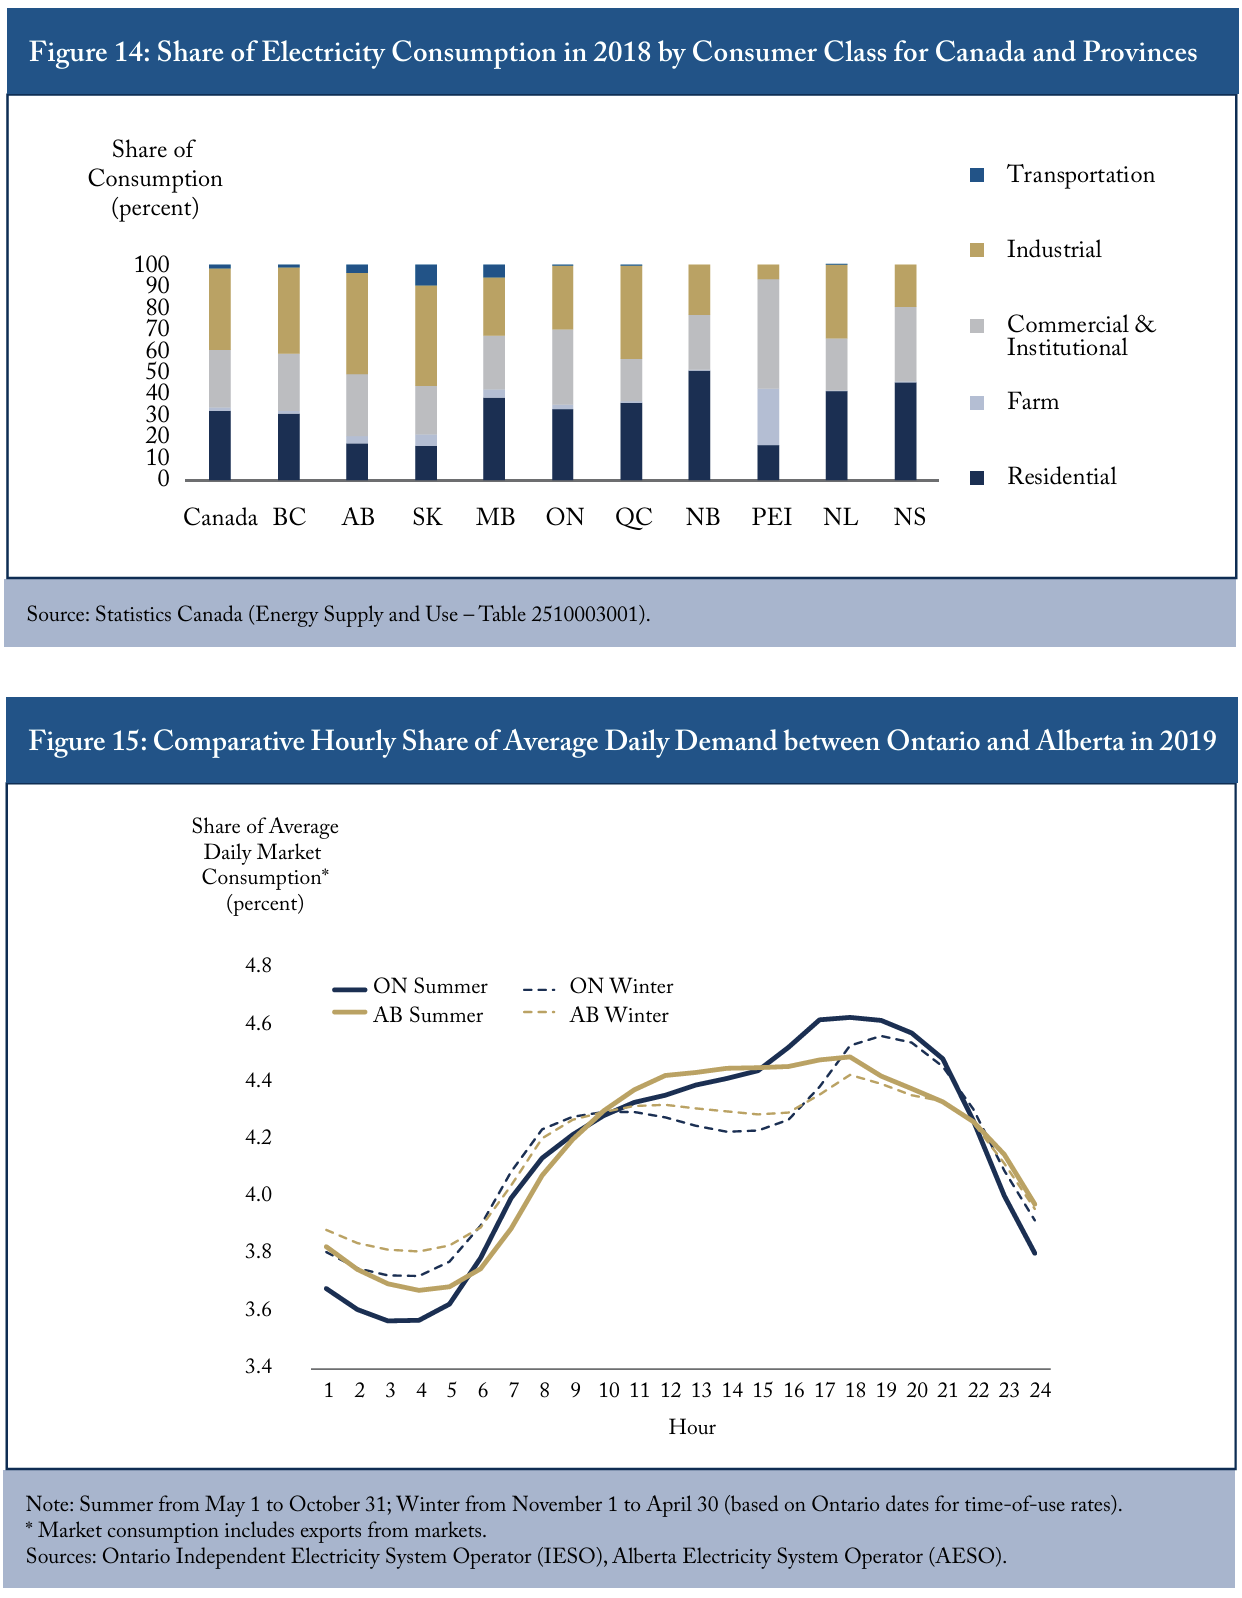
Figure 14 shows these differences in composition of domestic electricity consumption. Relative to other provinces, industrial loads represent a much greater share of electricity consumption in Alberta and Saskatchewan, and residential consumers comprise significantly lower proportions. Residential consumers comprise a comparatively greater share of electricity consumption in East Coast provinces (excepting Prince Edward Island).
Consumption also varies for electricity during the day and the shape of hourly demand for the overall system also varies by season. With differing conditions and composition of demand, the hourly profile of demand will have a different shape between provinces.
To illustrate, Figure 15 compares the share of average daily consumption in each hour of the day between Ontario and Alberta in the summer and winter seasons of 2019. For both provinces, early morning hours comprise a low share of consumption. However, in each season, Alberta has a comparatively flatter profile for consumption relative to Ontario. In particular, Ontario’s grid experiences relatively more pronounced peaks during evening hours than Alberta. This follows from the composition of electricity demand in each province: as exhibited in Figure 14, residential consumers comprise a greater share of consumption in Ontario and typically use power during evening hours. In contrast, industrial loads dominate electricity consumption in Alberta, and Alberta’s large industrial facilities operate with a generally stable demand profile.
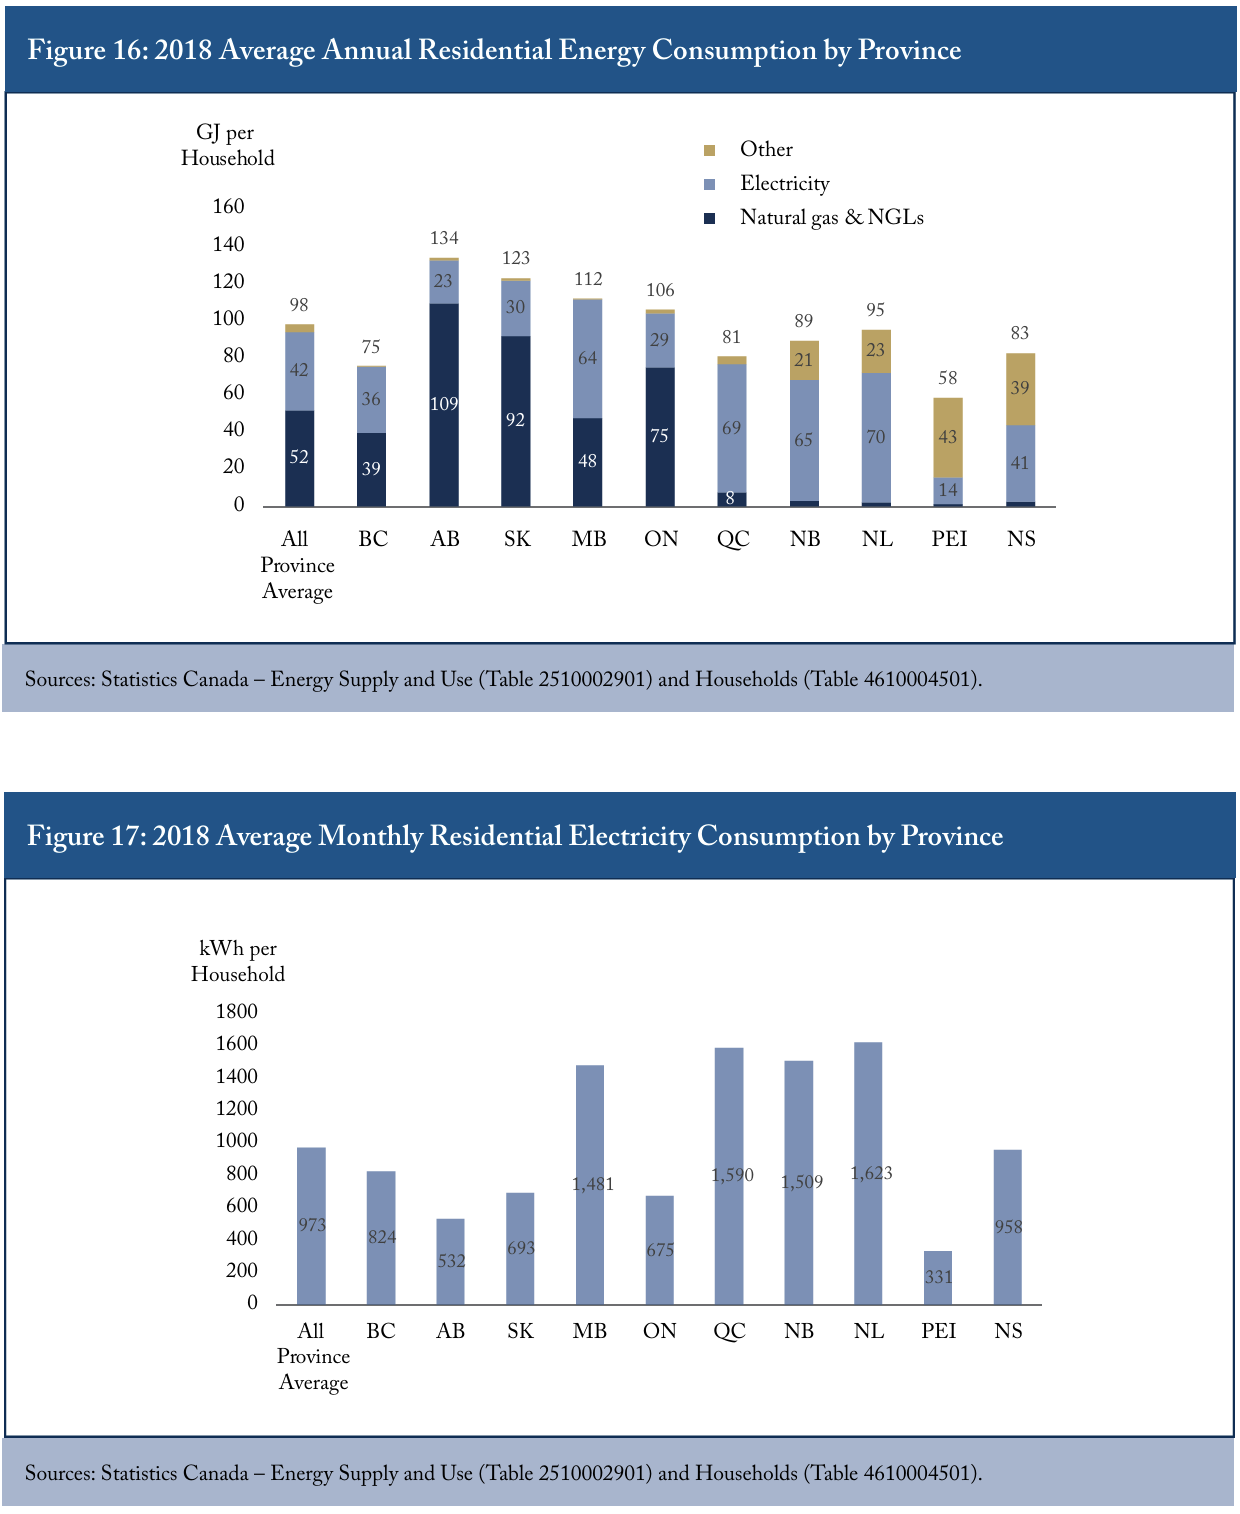
Residential consumers differ markedly in their energy use and electricity consumption across provinces. Figure 16 exhibits average residential energy consumption across provinces in 2018. This shows a significantly higher energy consumption per household in the prairie provinces than the all-province average. However, relative to other provinces, a much greater share of household energy use is supplied by natural gas (rather than electricity) in Alberta and Saskatchewan, while Manitoba households rely on electricity to a comparatively greater degree. In contrast, relatively little natural gas is used for household energy consumption in Quebec and the East Coast provinces. Finally, Ontario households have greater average energy consumption than the all-province average but consume proportionately more natural gas.
These differences in residential consumption across provinces follow from differing natural resource endowment and infrastructure for providing different energy sources (e.g., natural transmission and distribution) and relative prices (e.g., lower residential electricity prices in Manitoba), as well as climatic differences (e.g., greater heating degree days in prairie provinces). These differences in extent and composition of energy use complicate comparisons for electricity between provinces. For example, Figure 17 exhibits average monthly residential electricity consumption by province, illustrating the wide variation across provinces. Average Alberta and Ontario households use much less electricity than the all-province average while average households in Manitoba, Quebec, New Brunswick and Newfoundland and Labrador use much more.
An additional complication for comparing power prices across consumer classes – and, indeed, establishing “average” profiles for consumers – is that definitions for consumer types differ by province and provider. Tariffs for electricity rates and reporting of consumption are often based on the characteristics for a given consumer’s electricity usage (e.g., thresholds for monthly consumption or demand), rather than the type of consumer (e.g., industrial or commercial).
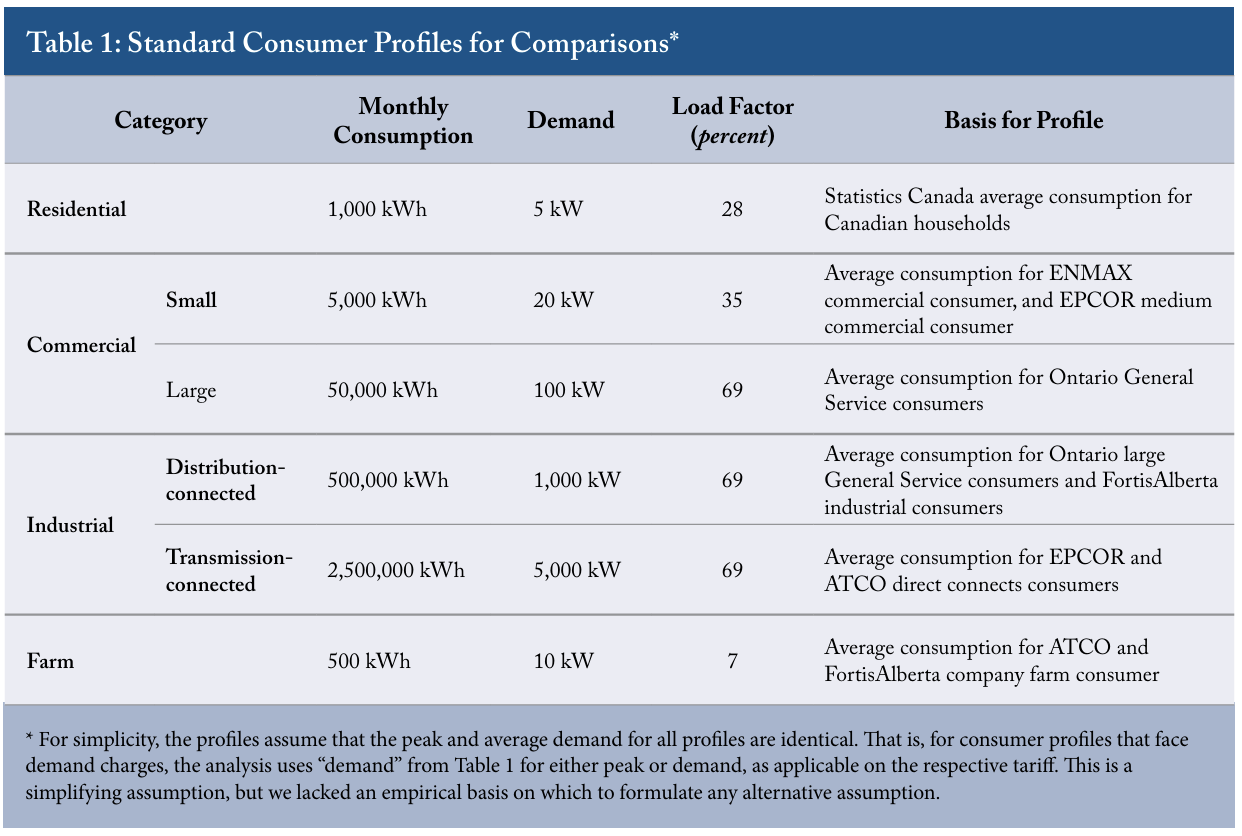
For this reason, this paper adopts standard residential, commercial, industrial and farm profiles to make “apples-to-apples” comparisons across provinces. For each of these consumer classes, Table 1 provides the standard profile of consumption and demand, as well as the load factor1919 Load factor is calculated as the monthly consumption for the given profile divided by the product of peak demand and the hours in a month. The load factor is provided here as a check for the reasonableness of the peak demand assumed for the given consumer. and empirical basis for the respective profile. Recognizing that businesses differ in size, this paper defines and analyzes both small and large commercial profiles. As well, this paper distinguishes between those industrial consumers that are supplied power by a distributor and those which are directly connected to transmission infrastructure (i.e., the consumer maintains on-site transformation of high voltage power).
Again, these standard profiles are assumed for the purpose of meaningfully analyzing relative electricity prices between provinces. However, the profiles do not match reported average consumption in every province.
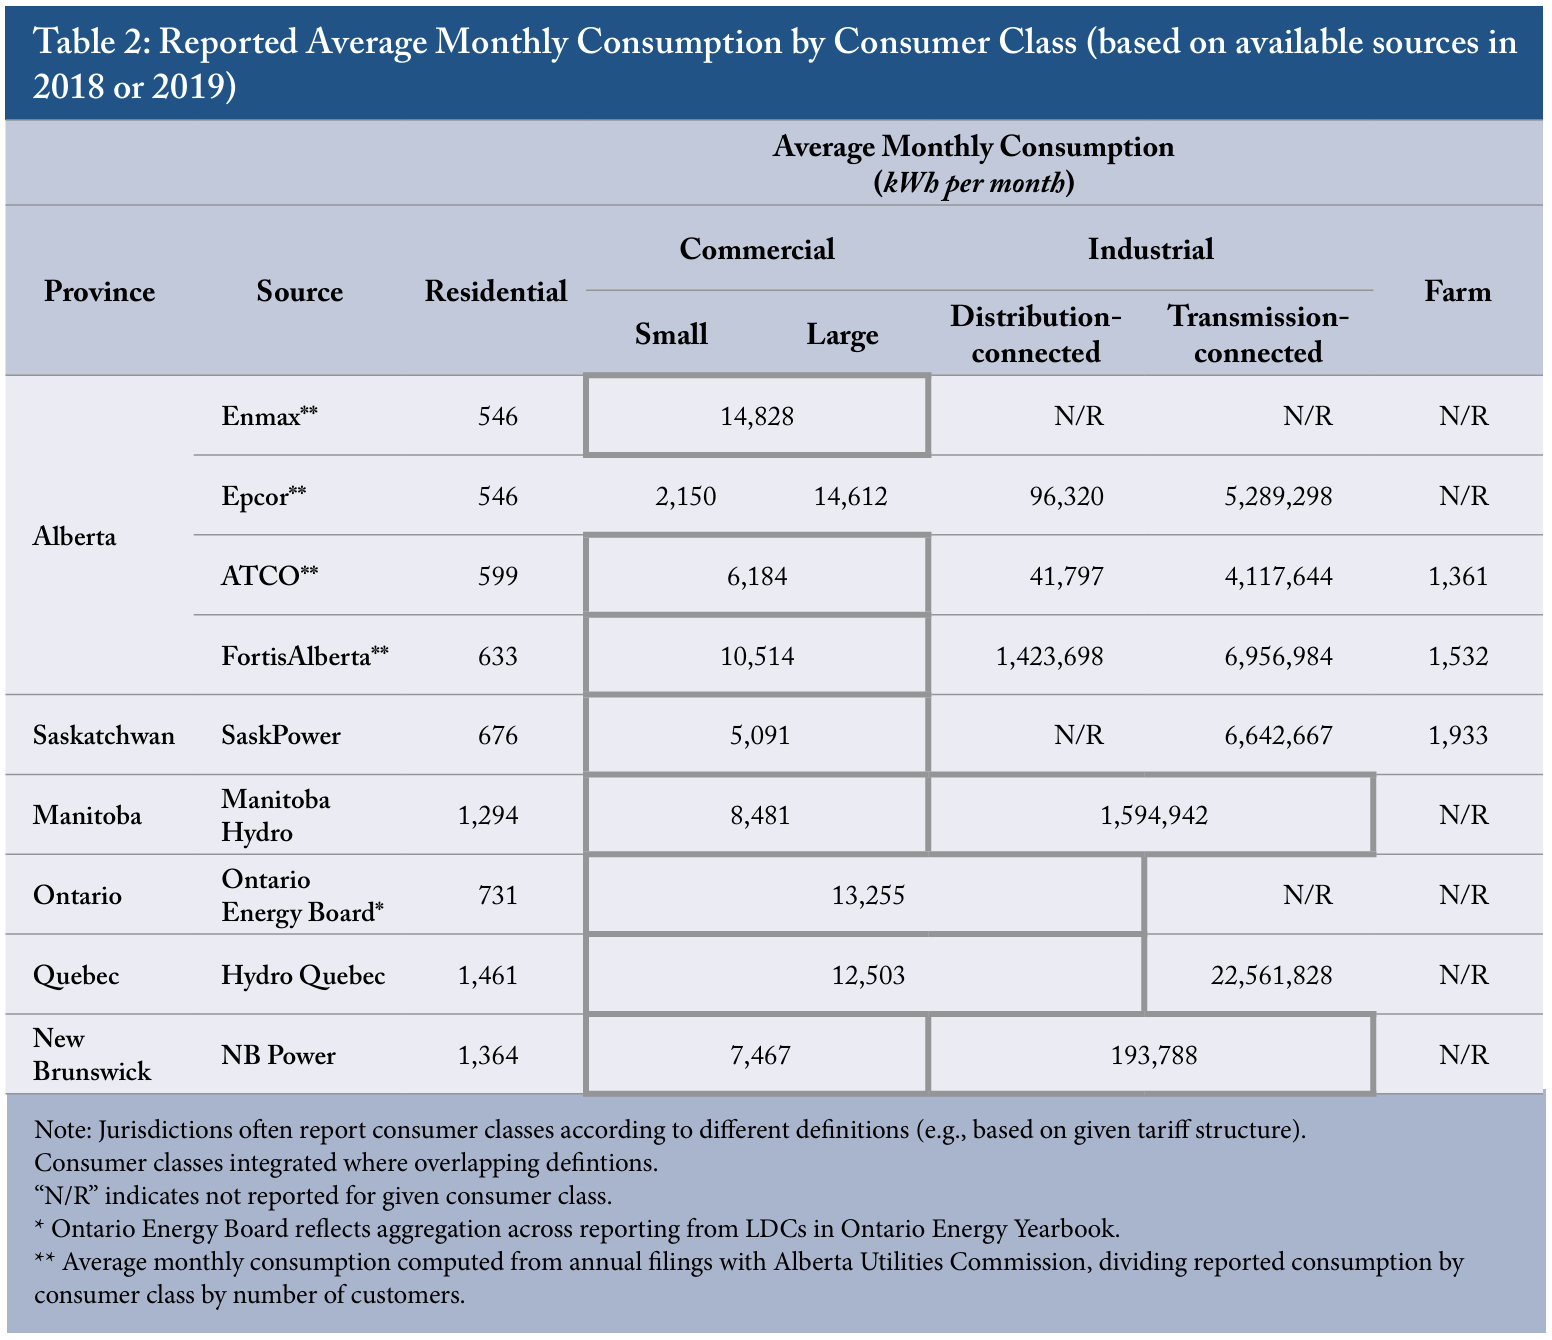
Table 2 provides a survey of average power consumption, calculated based on reporting from different electricity providers across those provinces where data are available. For many provinces, data are not reported for a given consumer class or reported using a different scope than the consumer class defined for this paper. Nonetheless, Table 2 exhibits that average monthly consumption by residential,2020 The estimates given in Table 2 for average residential consumption in respective provinces (based on reporting by electricity providers) generally align with those from data published by Statistics Canada, shown in Figure 17. commercial, industrial and farm consumers differs widely across provinces.
Structure of electricity rates across consumer classes and provinces
Table 3 provides an overview of the structure of electricity rates across consumer classes and provinces. This shows the complexity of rate structure and differences within and across provinces. For each consumer class, Table 3 also indicates the applicable tariff in the respective jurisdiction, highlighting that classes are not consistently defined across provinces.
In Table 3, rate components are classified as energy (for Alberta and Ontario), variable, fixed or demand. In Alberta and Ontario, generation, transmission and distribution are unbundled and charges for the electricity are separate from the charges for transmission and distribution services. Therefore, for Ontario and Alberta, “energy” reflects charges in ₵/kWh or $/MWh terms for the specific cost of electricity. For these provinces, “variable” rates are also priced in ₵/kWh or $/MWh terms but, unlike the “energy” component, reflect payments for distribution, transmission or other services, rather than the cost of electricity. However, in provinces other than Alberta and Ontario, where an integrated monopoly provides electricity, there is no distinction between energy and variable charges (i.e., charges that depend on kWh of consumption are categorized as “energy” charges).2121 For provinces with vertically integrated electricity providers, revenues from other rate components (i.e., fixed and demand charges) may also fund recovery for the costs of generation. An analysis of the revenues from each rate component relative to the operating and capital costs for generation, transmission and distribution in each province is beyond the scope of this paper. “Fixed” charges reflect daily or monthly charges that are incurred by a consumer, regardless of the amount of electricity consumed or a consumer’s peak demand.2222 Notably, tariffs in most provinces apply based on a given consumer’s peak demand and a tariff that applies above a demand threshold may involve a different “fixed” monthly or daily charge. For example, a different tariff might apply if a consumer’s peak demand exceeds 3,000 kVA in one province or 1,500 kW in another province. Nonetheless, “fixed” charges (i.e., which accrue on a daily or monthly basis) are distinct from “demand” charges (i.e., which directly vary in proportion to a consumer’s demand in $/kVA or $/kW terms). Finally, “demand” charges vary in proportion to a consumer’s peak demand over a given period and are charged per kVA or per kW.
Table 3 also shows whether the given rate component for the respective consumer class in the respective province is uniform, tiered or timevarying. “Uniform” rates are unchanging for the given billing period – that is, these do not vary based on when electricity is consumed, how much electricity is consumed, or the consumer’s peak or average demand.2323 If the consumer’s consumption or demand exceeds the threshold for the given tariff, a different tariff would apply and attract a different set of rates.
In contrast, “tiered” rates apply in certain provinces for certain consumers – for example, applying higher or lower rates to electricity consumption or peak demand that rise above stated thresholds. Imposing a higher rate beyond a given threshold of consumption or demand may encourage conservation among larger consumers. For example, in British Columbia and Quebec, residential consumers face higher rates for electricity consumption above 675 kWh per month and 1,200 kWh per month, respectively.
Alternatively, the aim of a tiered rate that decreases above a certain threshold may be to encourage electricity-intensive activities (e.g., attract industrial production) or more efficiently allocate fixed system costs between consumers. For example, Manitoba’s rate structures for commercial and distribution-connected industrial consumers involve a three-tier energy rate with declining ₵/kWh costs with consumption above 11,000 kWh per month and 19,500 kWh per month. As another example, demand charges for transmission-connected industrial consumers in Alberta are structured based on the consumer’s share of the substation and involve $/kW demand charges, which decline at specified thresholds of substation billing capacity.2424 More specifically: for 2019, a $3,669/MW charge applies to the first 7.5 MW of the substation’s billing capacity; a $2,298/ MW charge applies to the next 9.5 MW (i.e., to 17 MW billing capacity); a $1,603/MW charge applies to the next 23 MW (i.e., to 40 MW billing capacity); and all remaining MW of billing capacity face a $1,038/MW charge. The cost to the consumer will be its share of its substation’s billing capacity. To calculate costs for transmission-connected industrial consumers, this paper assumes a 25 MW substation.
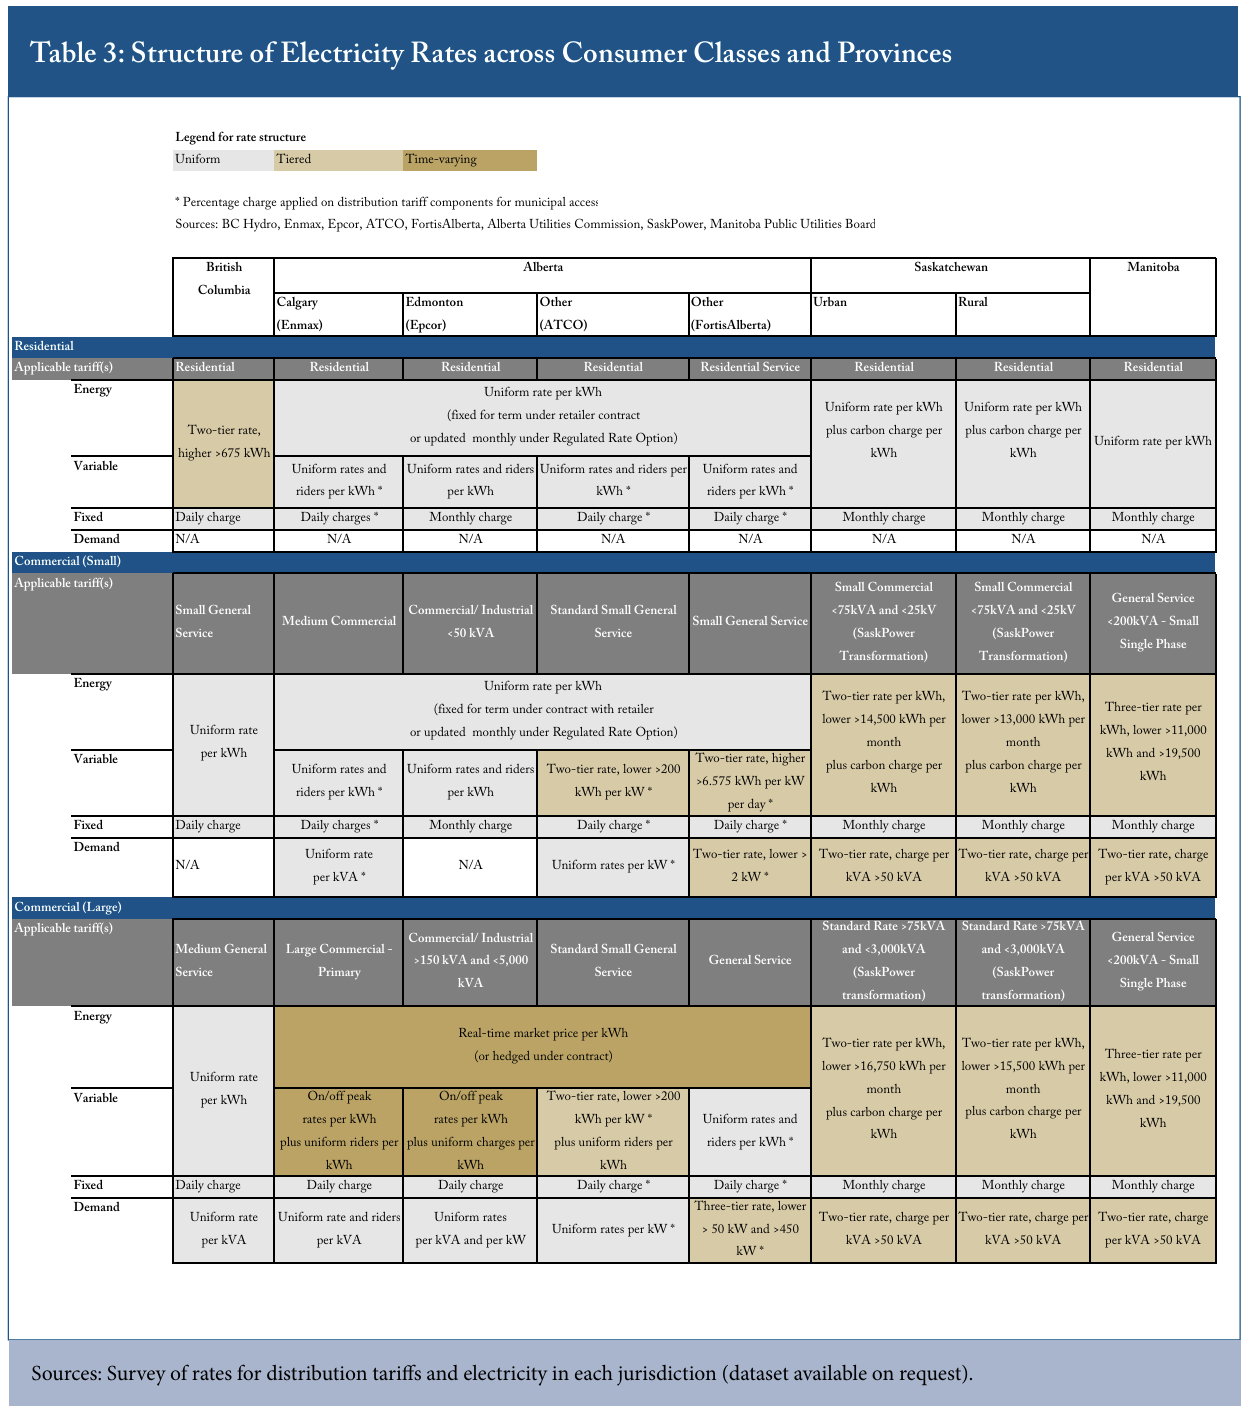
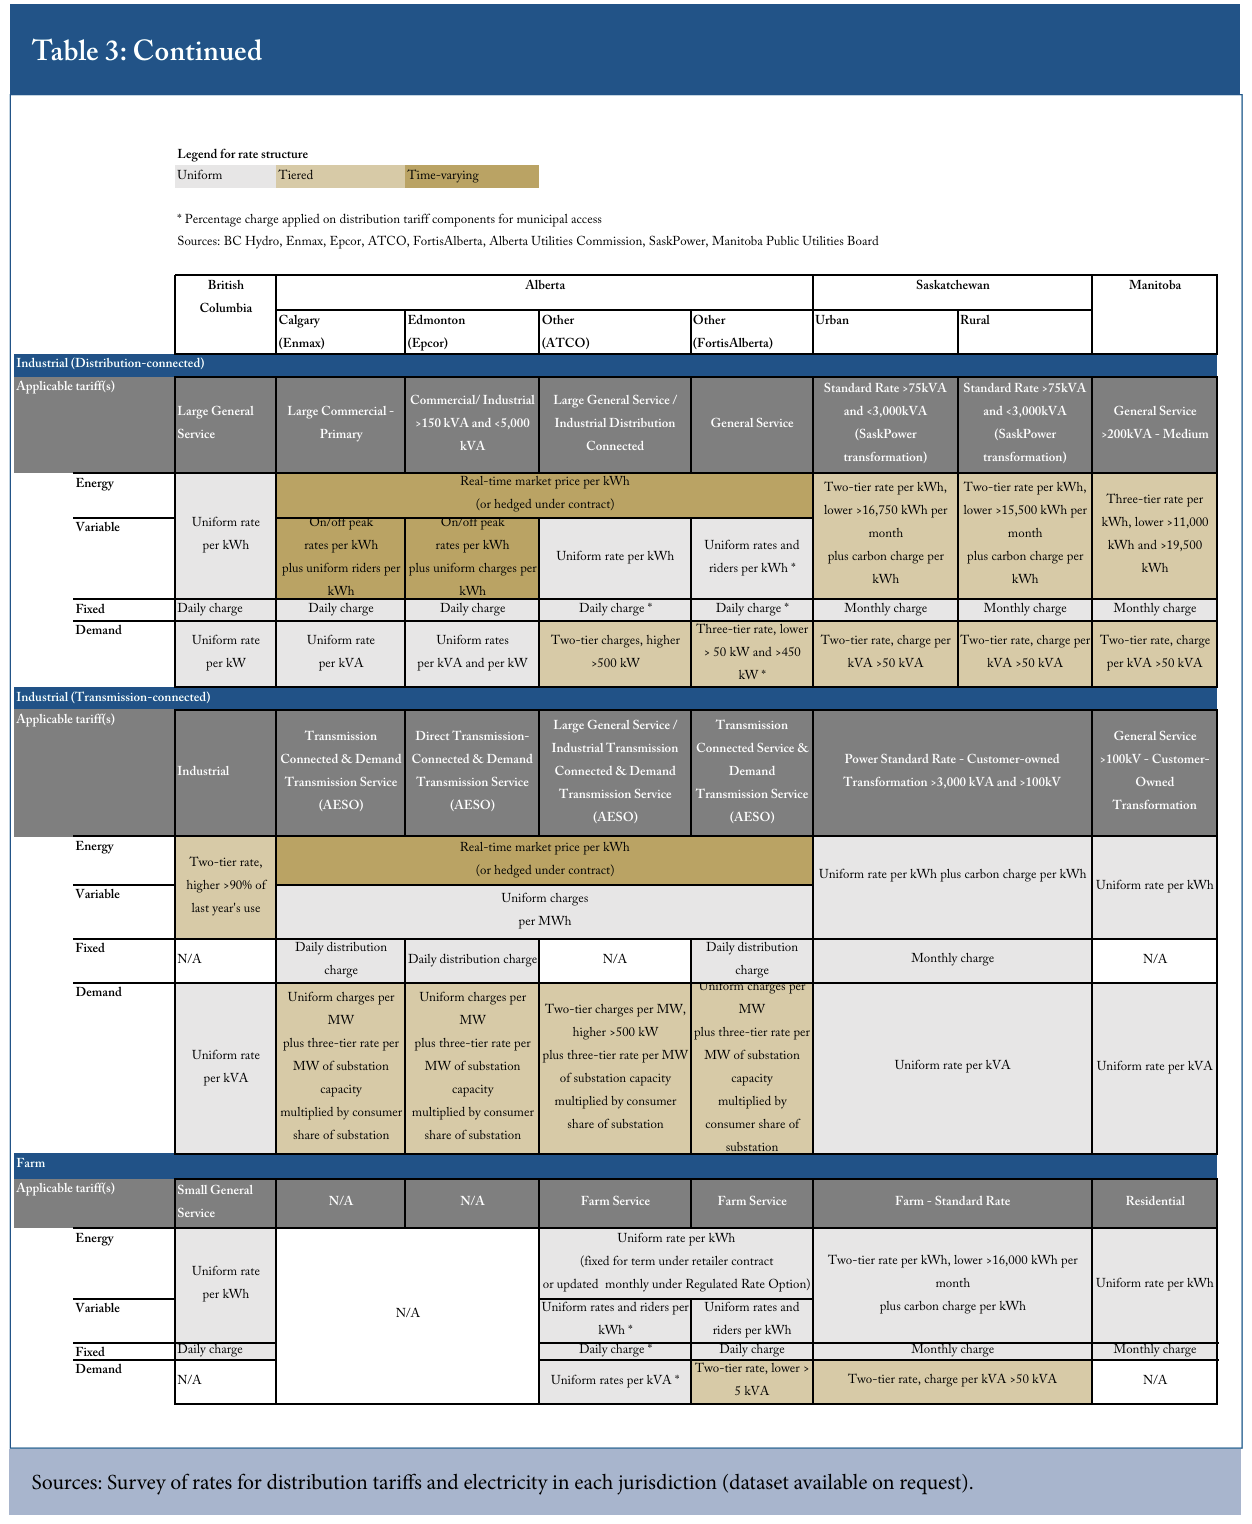
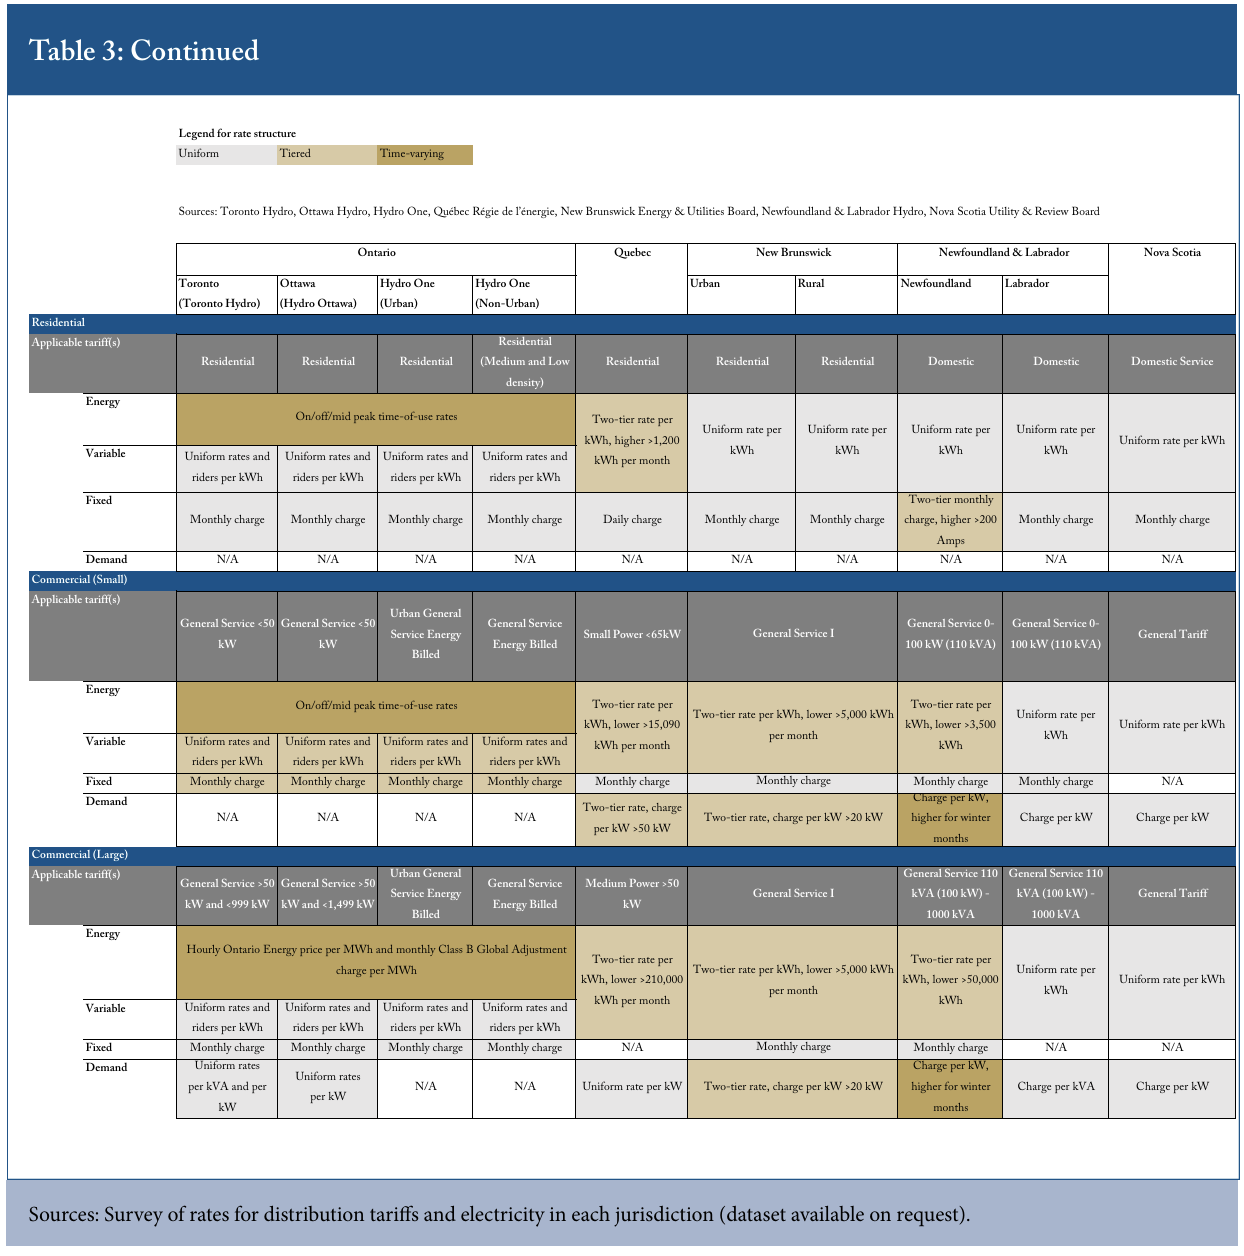
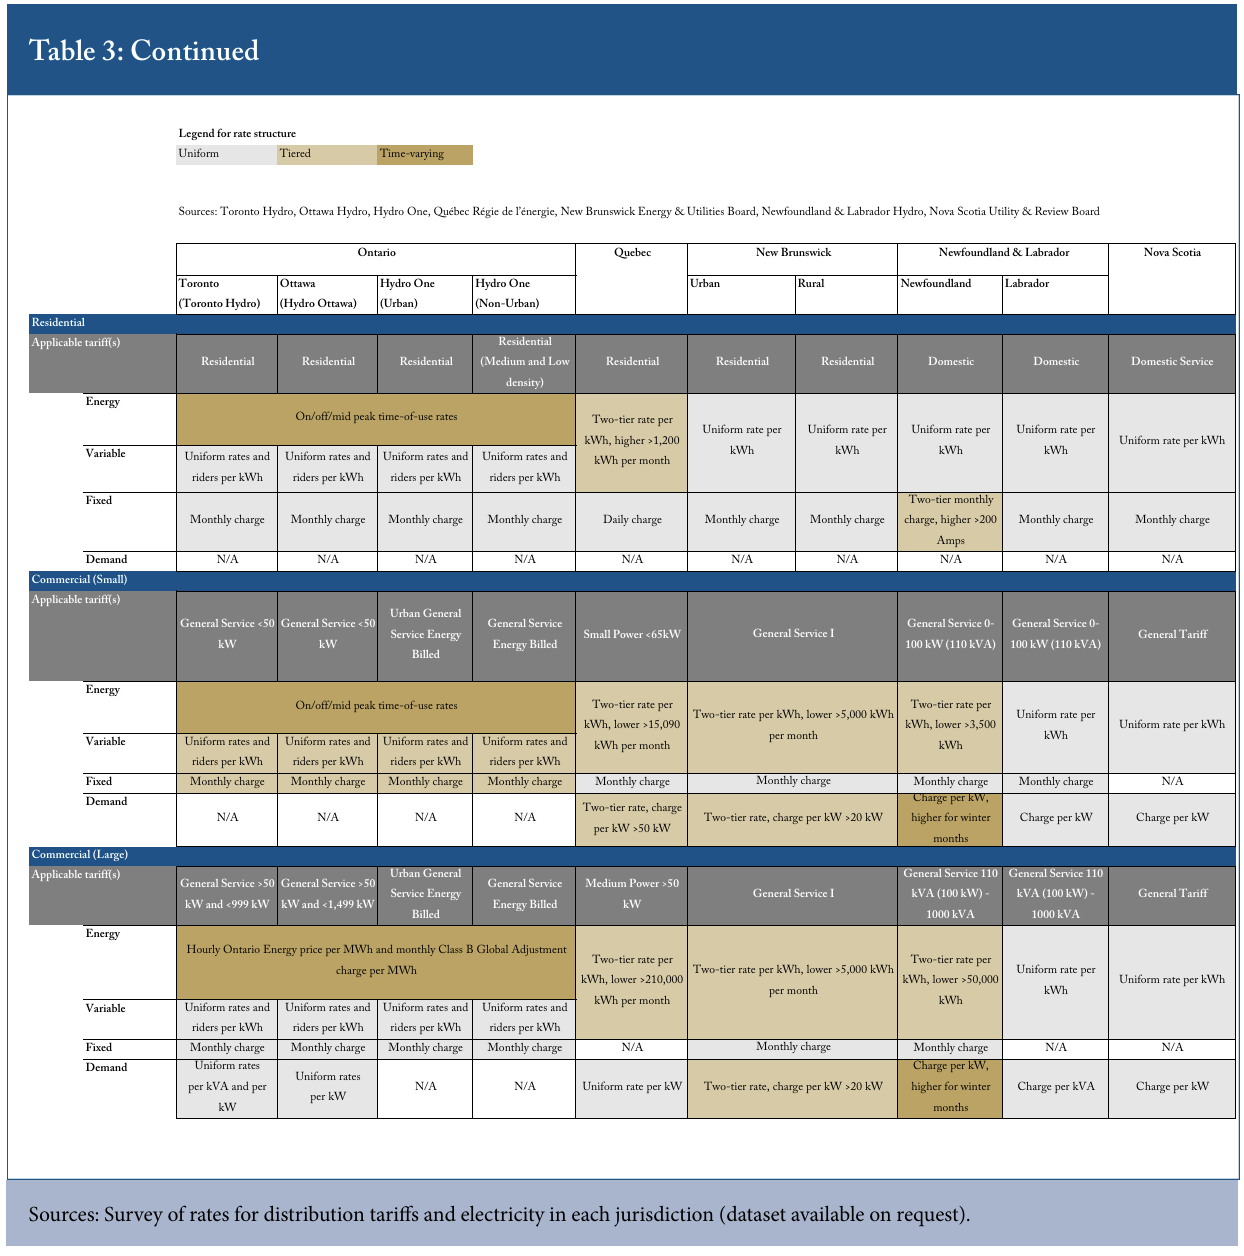
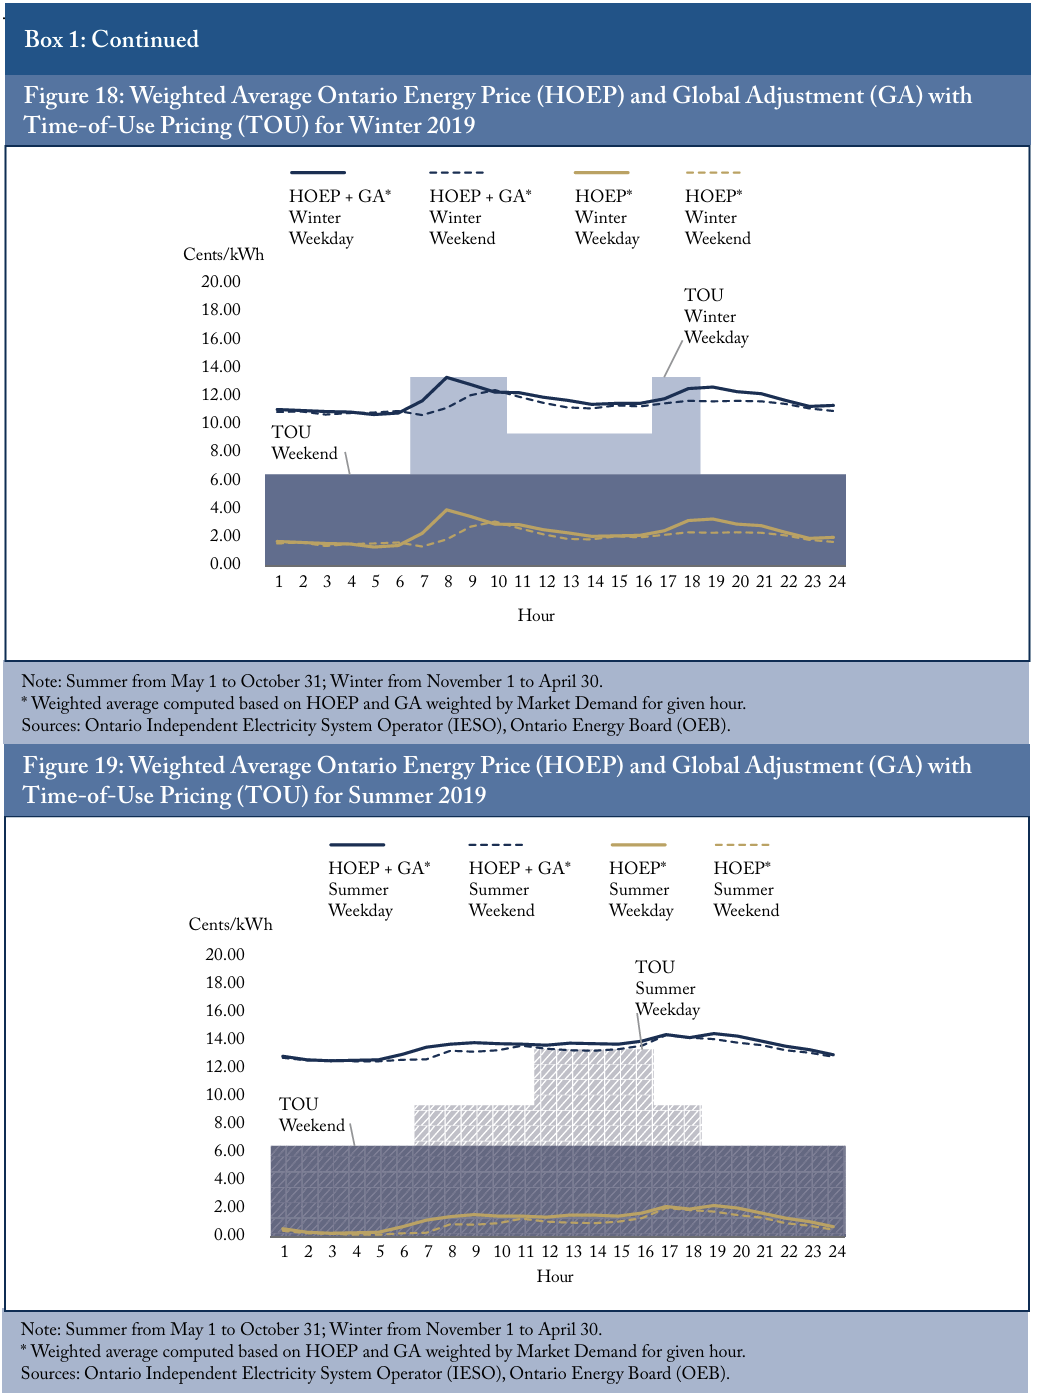
Finally, “time-varying” rates vary with the time at which power is consumed. Such time-varying charges may aim to align the price for consumption with the cost for generating the electricity and/or the capacity to deliver it. For example, in Ontario and Alberta, energy rates for large commercial and industrial consumers vary based on prices in each province’s real-time energy market.2525 As elaborated below, commercial and industrial consumers in Ontario also face a Global Adjustment charge. This charge is applied at a uniform $/MWh rate for a given month based on the total Global Adjustment costs for that month. As detailed in Box 3, participation in the Industrial Conservation Initiative (ICI) allows commercial and industrial consumers to reduce their monthly Global Adjustment charges. A consumer is enrolled in the ICI as a “Class A” if (i) the consumer’s monthly peak demand exceeds 5 MW; (ii) the consumer has monthly peak demand greater than 1 MW and opts into the ICI; or (iii) the consumer has monthly peak demand greater than 500 kW, is in one of a prescribed list of manufacturing or industrial sub-sectors and opts into the ICI. For the consumer profiles in Table 1, the transmission-connected industrial consumer is therefore assumed to be a Class A consumer (i.e., based on its 5 MW demand) while the distributionconnected industrial consumer is assumed to be a Class B consumer (i.e., based on its 1 MW demand). Table 3 reflects these assumptions but should not be read to imply that the Class A/B distinction depends on whether a consumer is transmission- or distribution-connected. Ontario also applies time-of-use pricing for residential and small commercial consumers according to a schedule of rates that varies according to whether consumption occurs at specified on/off/mid peak times, on weekends or during the winter/summer season (see Box 1).2626 Contracts at fixed rates are also available to Ontario residential and small business consumers. Such fixed rates are provided by an energy retailer based on rates set out in the given contract, and these contracts are not regulated by the Ontario Energy Board. The analysis in this paper assumes that the fixed rate under any contract with a retailer would reflect the average costs for consumption under the regulated time-of-use rates. As well, for large commercial and distribution-connected industrial consumers in Alberta, Enmax and Epcor apply on/off peak variable distribution and transmission charges. These are higher during daytime hours (i.e., when system capacity is in greater demand) and lower during the nighttime (i.e., when usage is lower).

PART III Inter-provincial Comparison of Power Costs for Consumer Classes
In order to compare costs for given consumer classes across provinces, we have surveyed tariffs and rates schedules in each jurisdiction and compiled a comprehensive dataset with all rate components in effect as of April 1, 2019. These tariffs and rate schedules are then applied to each of the consumer profiles defined in Table 1.
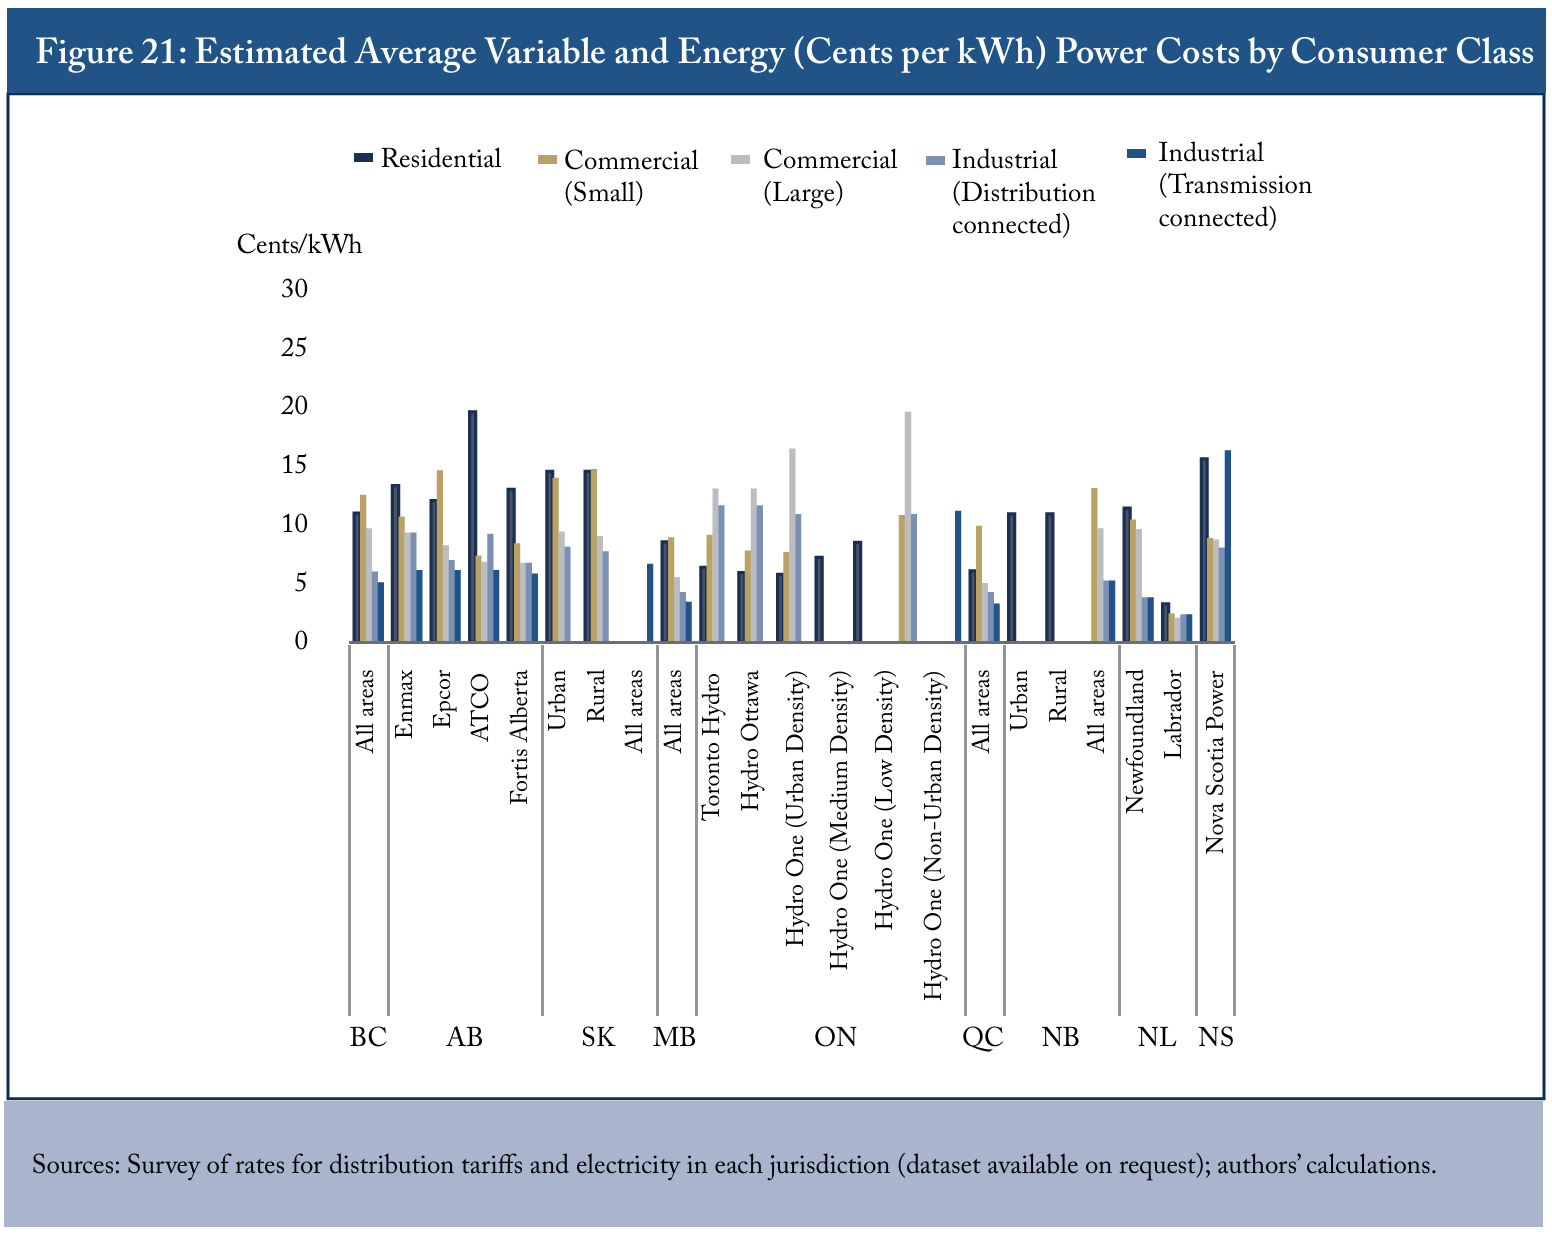
To summarize the results, Figure 20 exhibits the average unit (i.e., cents per kWh) electricity costs for each consumer class across provinces in 2019.2727 Note that this “average unit” comparison is calculated by dividing the estimated monthly costs by the electricity consumption assumed in each consumer profile (i.e., in Table 1 above). This is distinct from the marginal electricity price faced by a given consumer. In contrast with the average unit costs in Figure 20 (which includes the fixed and demand), Figure 21 exhibits the average variable and energy electricity costs (i.e., only those rate components that are priced in ₵/ kWh and vary with consumption) for each consumer class across provinces. Notably, the trends for just the average variable and energy costs are qualitatively similar for the average unit costs. This illustrates that, for non-residential consumers in most provinces, average unit electricity costs declined for consumers with increasing consumption. That is, transmission-connected industrial consumers faced relatively lower average unit costs than distribution-connected industrial consumers and, in turn, large and then small commercial consumers. As well, in most provinces, residential consumers tended to face the highest average unit costs or face only slightly lower costs than small commercial consumers.
Ontario is the notable exception to this trend across provinces. In Ontario, average unit costs for residential consumers in urban areas and small commercial consumers were significantly lower than for large commercial and industrial consumers. As elaborated below, this reversal from the general trend across provinces results from generous taxpayer-funded rebates for residential and small commercial consumers. Indeed, only Quebec, Manitoba and Labrador had average unit costs for residential consumers that are less than those in Ontario. As illustrated above (see Figure 1), Quebec, Manitoba and Newfoundland and Labrador have much lower normalized system costs than Ontario (indeed, which has the highest normalized system costs of any province).
Finally, average unit costs were generally higher for residential consumers in rural areas. This is shown by the high relative average unit costs for residential consumers served by ATCO in Alberta and served by Hydro One in low-density territory in Ontario. Rural residential consumers also faced higher average unit costs than their urban counterparts in Saskatchewan and New Brunswick.
The break down of electricity costs into energy, variable, fixed and demand components also provides insight into how system costs are allocated and how incentives are aligned for each consumer class.
Figure 22 exhibits this decomposition for residential consumers, illustrating that fixed costs represented a small share of residential electricity costs across all provinces in 2019. Most of residential consumers’ electricity costs were billed through energy and, where applicable, variable components.2828 As discussed above and documented in Table 3, since electricity in provinces other than Ontario and Alberta is provided by integrated Crown corporations, those provinces do not distinguish between the energy and variable components of electricity rates. In Ontario and Alberta, separate variable rates are charged for transmission and distribution, and the energy charge is distinct, reflecting the cost of energy alone. Figure 22 shows that a residential consumer faced significantly higher energy costs in Ontario relative to those in Alberta. However, the generous taxpayerfunded “Global Adjustment Rebate” in Ontario offsets much of a residential consumer’s costs. As elaborated in Box 2, Ontario taxpayers have incurred a large and rising cost to fund this rebate.

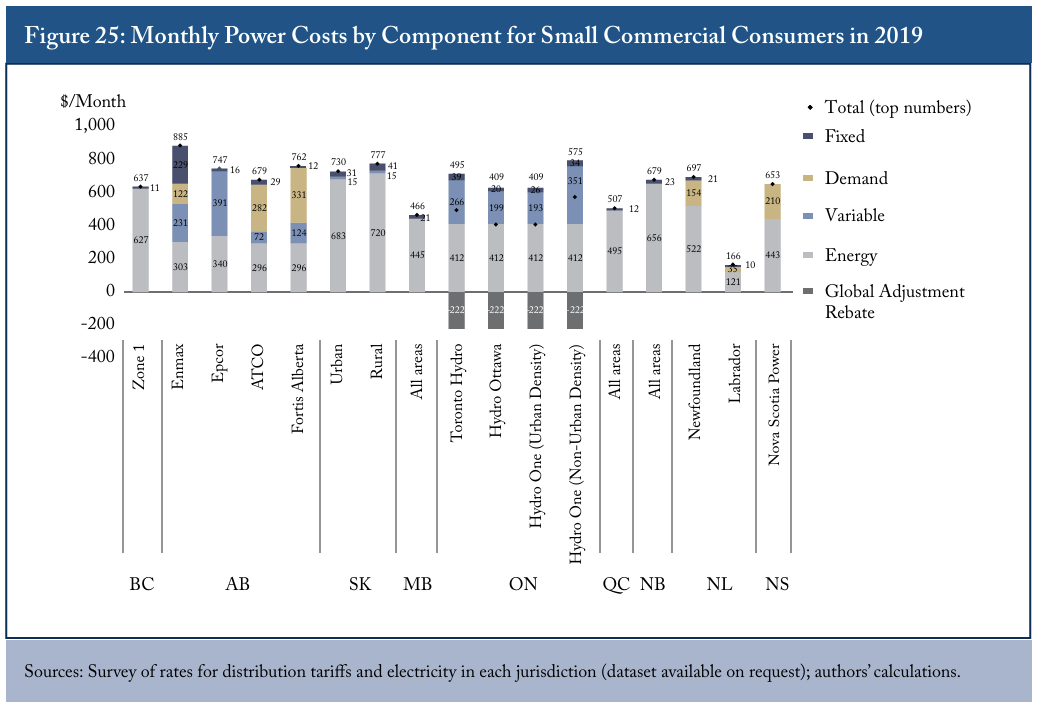
For small commercial consumers, Figure 25 shows the relative monthly costs for electricity across provinces in 2019. In most provinces, the rate for energy (as well as variable rates in Ontario and Alberta) comprised the majority of electricity costs for small commercial consumers. However, demand charges applied in a variety of provinces represented a particularly significant proportion of small commercial consumers’ costs for territory in Alberta served by ATCO and FortisAlberta, as well as for Newfoundland and Nova Scotia. Similar to residential consumers, Ontario’s generous taxpayerfunded Global Adjustment Rebate substantially offsets the costs for small commercial consumers, resulting in lower net monthly costs for this profile than in most other provinces.
For large commercial consumers, Figure 26 shows the relative monthly costs for electricity across provinces in 2019. Energy rates (and variable rates in Ontario and Alberta) comprised the greatest share of electricity costs; however, demand charges also comprised significant shares in all provinces. Unlike small business consumers, such large commercial consumers do not benefit from Ontario’s Global Adjustment Rebate. Relative to other provinces, electricity costs for this profile were highest in Ontario in 2019. As shown in Figure 26, the costs from Ontario’s energy rates – propelled by the per MWh charges for Ontario’s Global Adjustment – were the cause of Ontario’s higher relative electricity costs for large commercial consumers compared to other provinces.2929 Note that these large commercial consumers (defined for this analysis to have 100 kW peak demand) cannot leverage Ontario’s Industrial Conservation Initiative (ICI) to reduce their monthly electricity costs because participation in ICI requires a minimum 1 MW average monthly peak demand (or minimum 500 kW demand for certain prescribed manufacturing and industrial activities). See discussion of ICI in Box 3. Energy costs in Ontario for large commercial consumers exceeded those in any other province.


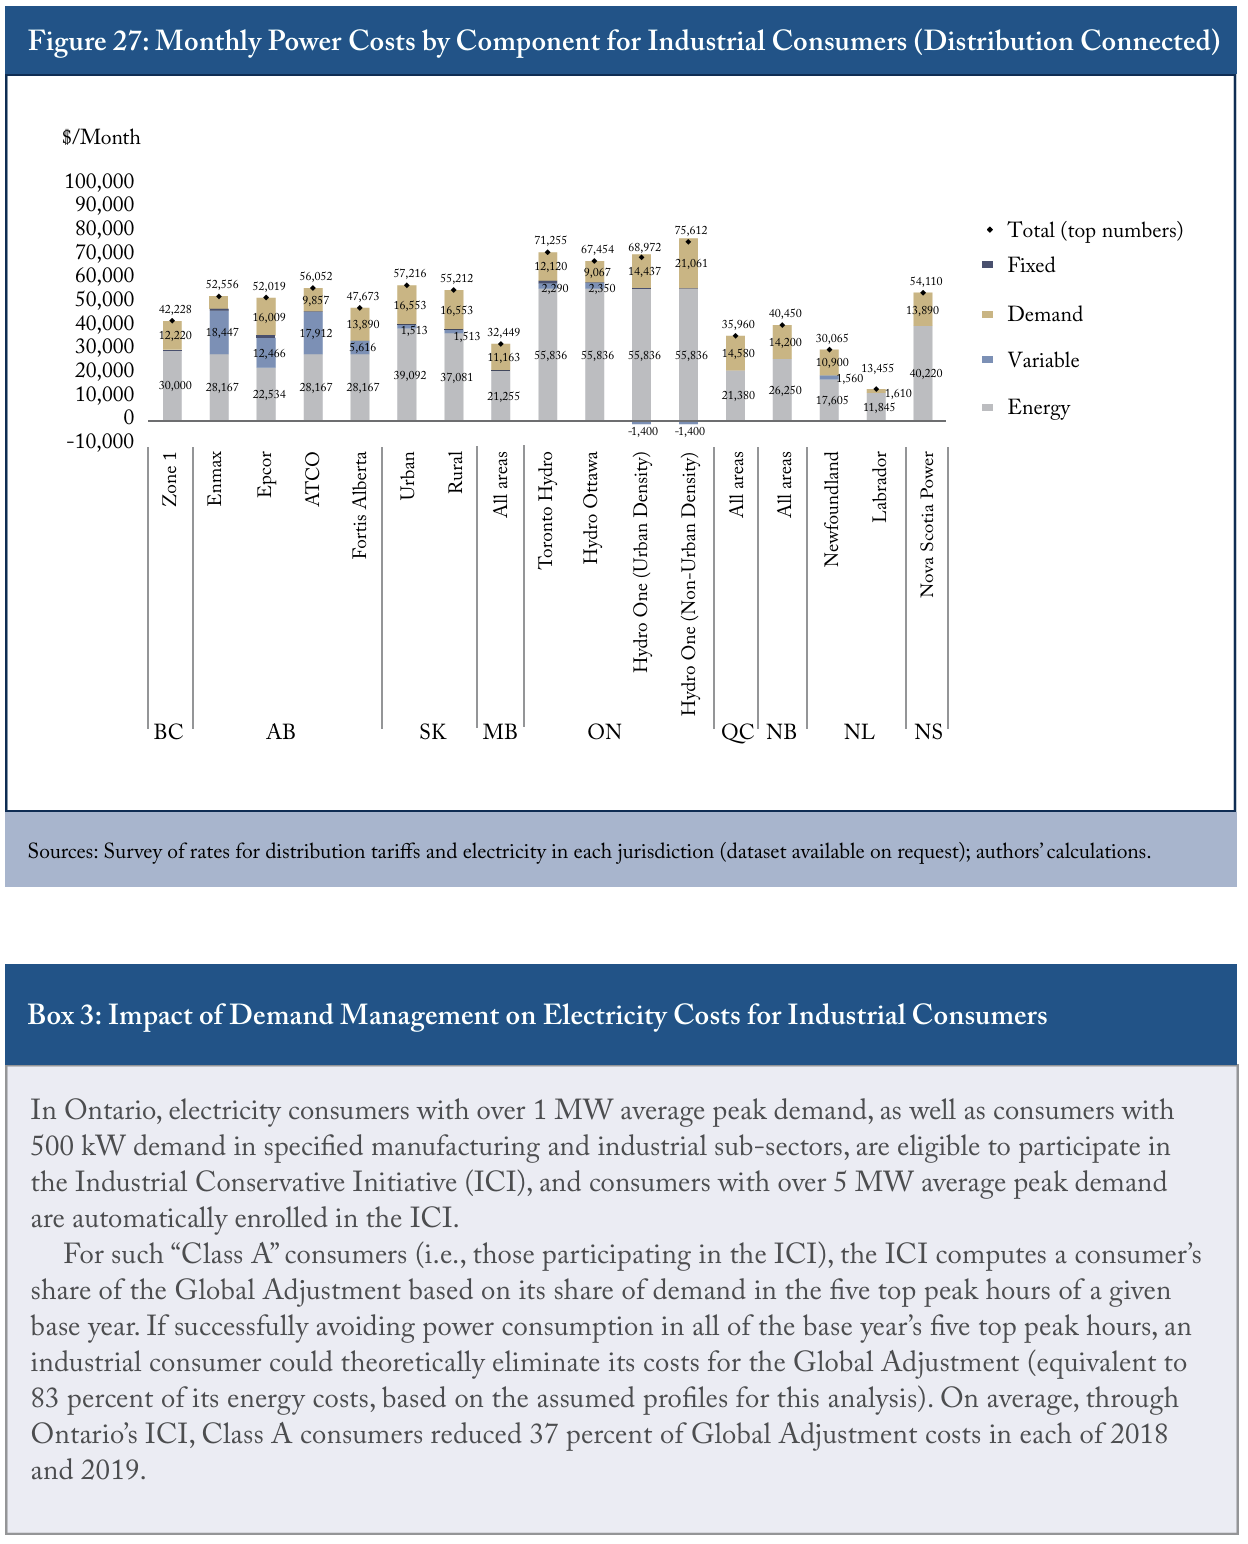
For distribution-connected industrial consumers, Figure 27 exhibits the relative monthly costs for electricity across provinces in 2019. Although the energy component comprised the majority of electricity costs in all provinces, demand charges were also prevalent across provinces. This consumer profile faced the highest electricity costs in Ontario.3030 The net negative costs for the variable component of costs for Hydro One distribution-connected industrial consumers, shown in Figure 27, results from the negative rate rider for “disposition of the Global Adjustment Account” applicable to this consumer profile. However, by reducing demand during peak hours, industrial consumers in Ontario can leverage the Industrial Conservation Initiative (ICI) to offset their costs from the Global Adjustment and thereby significantly reduce their electricity costs.3131 The monthly electricity costs for distribution-connected consumers in Ontario presented in Figure 27 do not include potential savings that might be achieved under the ICI. For the potential impact of the ICI, see discussion in Box 3.
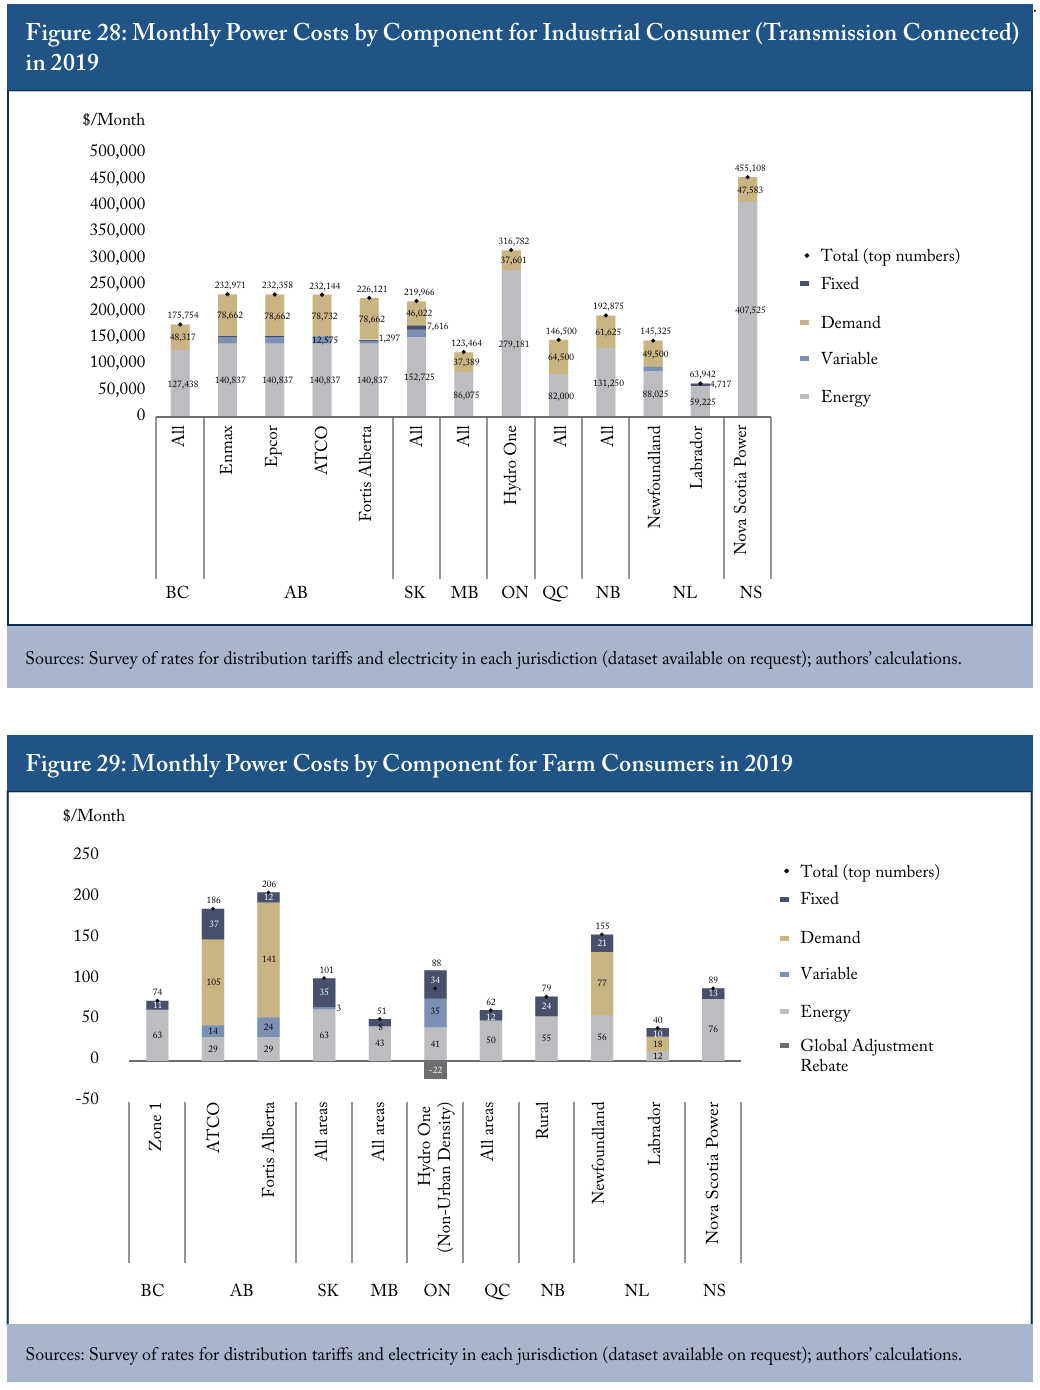
For transmission-connected industrial consumers, Figure 28 shows the relative monthly costs for electricity across provinces in 2019. For such consumers, Labrador boasts the lowest costs, and Manitoba and Quebec also achieve low rates. Notably, costs in Nova Scotia are significantly greater than in any other province. Transmissionconnected industrial consumers also face elevated monthly costs in Ontario, driven by large relative energy costs (defined to include the wholesale cost of energy and the Global Adjustment charge). As discussed in Box 3, a Class A consumer can partially or fully eliminate the Global Adjustment charge under Ontario’s ICI.3232 It would be inaccurate to present the potential reduction of the GA charges under the ICI as automatic since any such savings are contingent on coincident peak demand (i.e., the specific consumer avoiding the High-5 hours).

Finally, for farm consumers, Figure 29 shows the relative monthly costs for electricity across provinces in 2019. Relative to other provinces, electricity costs for farm consumers were particularly elevated for territory in Alberta serviced by ATCO and FortisAlberta. Energy and variable costs are relatively low in Alberta, but demand charges for distribution and transmission drove the province’s heightened electricity costs for farm consumers. Farm consumers in Newfoundland also faced relatively high demand charges and overall electricity costs. Costs for farm consumers are lowest in Manitoba, followed by Labrador, Quebec and British Columbia.
PART IV Changes in Ontario and Alberta Electricity Costs since 2014
Given the high relative costs of power in Ontario and Alberta, this paper provides a deeper dive into changes in electricity costs for consumers in these provinces since 2014. Again, Figure 1 exhibits the relatively high system costs in Ontario and Alberta compared to other provinces. For Ontario, normalized system costs grew by approximately 6.4 percent from 2014 to 2018 (see Figure 5 above). For Alberta, normalized system costs grew by approximately 16 percent over the same interval (see Figure 9 above) – albeit with a notable decline from 2014 to 2016 before a renewed period of rapid growth.
These rising system costs have impacted each consumer class differently. As well, at a significant fiscal cost, Ontario’s taxpayer-funded rebates for residential and small business consumers have also significantly reduced these consumers’ electricity costs (see Box 2 above). For insight on the impacts for each consumer profile, this paper compares electricity costs in 2014 against those in 2019 for Ontario and Alberta. As discussed in Box 4, these estimates using the assumed consumer profiles are directionally consistent (although not matching the magnitudes) with the changes over the interval for indexed electricity prices produced by Statistics Canada for households and non-residential (i.e., commercial or industrial) consumers.
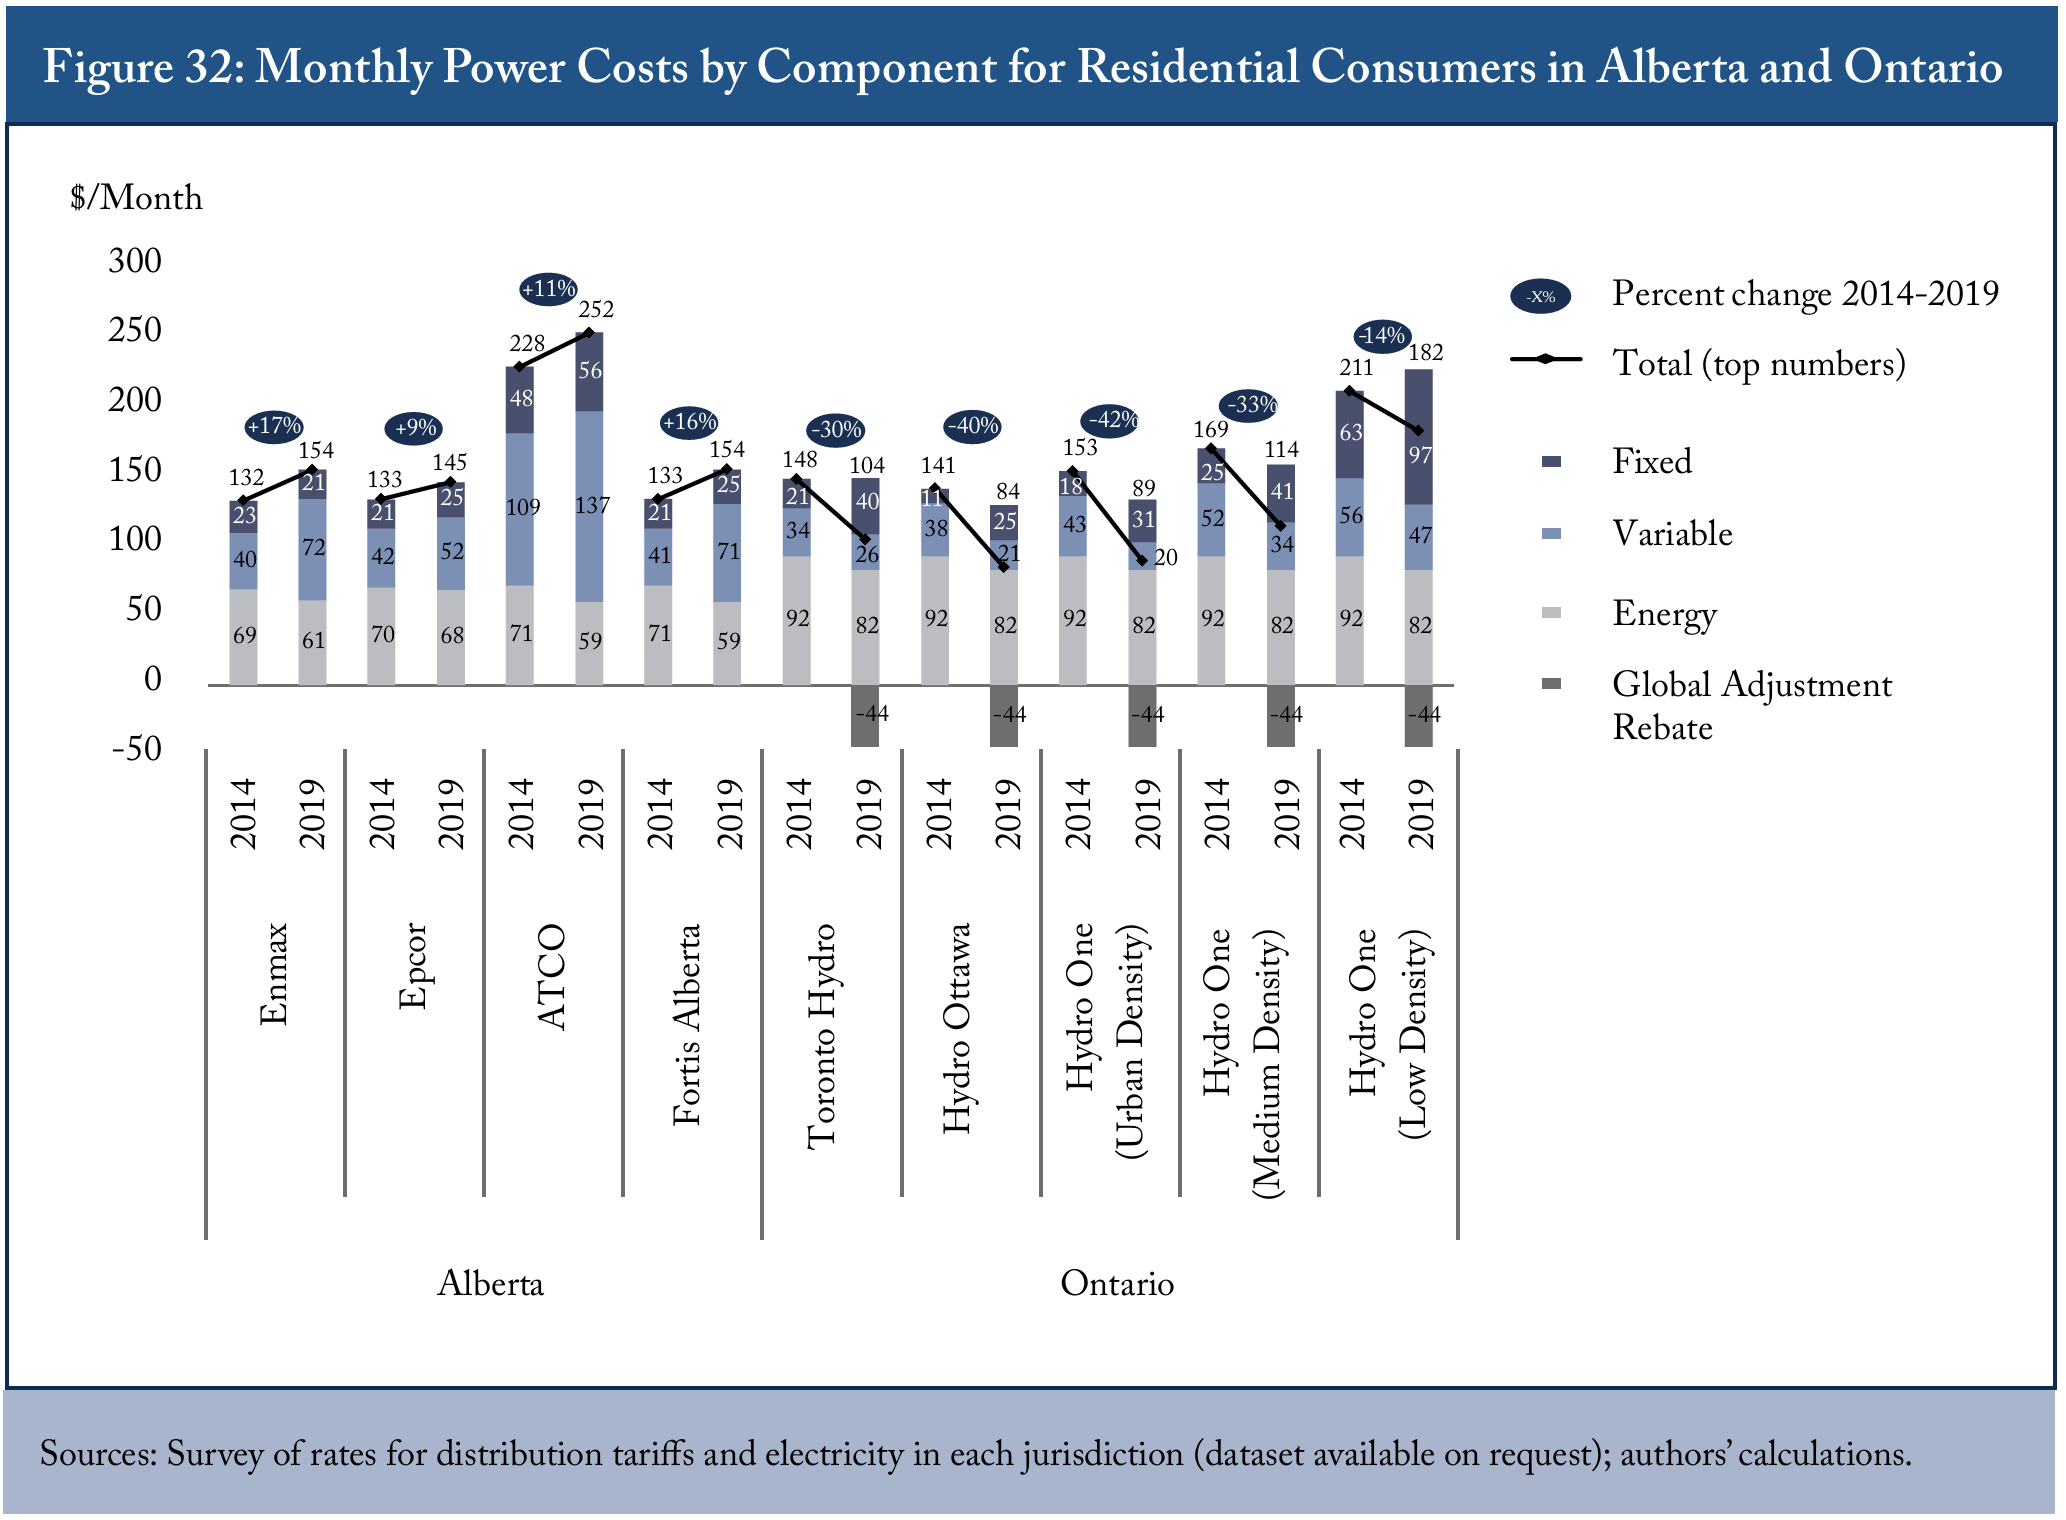
Based on the assumed consumer profile, Figure 32 exhibits the change in monthly costs for residential consumers between 2014 and 2019 in Alberta and Ontario. Over this interval, the Alberta all-item consumer price index increased by 8 percent while that in Ontario increased by 9 percent. For electricity prices, based on the assumed profile, such a residential consumer in Alberta would have experienced cost growth of between 9 percent and 17 percent during the period, depending on the distribution territory. In all Alberta service territories, energy costs declined over the period but growth of the variable and fixed rate components (i.e., associated with distribution and transmission services, as well as allocations for the Balancing Pool) drove the overall increases.
In contrast, costs for residential consumers in the Ontario areas analyzed declined by between 30 percent to 40 percent , except in low-density areas serviced by Hydro One where the decline was more muted. These declines were primarily due to the introduction of the Global Adjustment rebate. Interestingly, the energy costs facing households appear to have declined over the period.3333 This is a mechanical result of the assumption that 65 percent of household consumption occurs during off-peak time-ofuse hours (i.e., between 7pm and 7am in summer) and 17 percent at mid-peak hours (i.e., 7am to noon and 5pm to 7pm in Summer). While Ontario’s on-peak time-of-use prices increased since 2014, both mid-peak and off-peak prices declined. This assumption is supported by the Table 1 (p.2) of the Ontario Energy Board (2018) report “Regulated Price Plan Prices and the Global Adjustment Modifier for the Period May 1, 2018 to April 30, 2019” (Available online: https://www.oeb.ca/sites/default/files/RPP-GA-Modifier-Report-20180419.pdf). As well, fixed costs grew significantly while variable costs declined for residential consumers in the service territories analyzed. This appears to reflect a shift in how costs are recovered under distribution tariffs from Ontario residential consumers.
For the small commercial consumer profile, Figure 33 exhibits the changes in monthly electricity costs between 2014 and 2019. For Alberta, costs for this profile increased by an estimated 15 percent to 18 percent in Enmax, Epcor and FortisAlberta territories and by a more muted 6 percent in territory serviced by ATCO. Throughout Alberta, energy costs for such consumers decreased over the interval, and cost growth was driven by non-energy components – that is, increased demand, variable and fixed rates for distribution and transmission services, as well as allocations for the Balancing Pool.


In Ontario, electricity costs for this profile decreased by between 29 percent and 35 percent in the analyzed urban areas and by 26 percent for non-urban areas serviced by Hydro One. This decline was primarily a result of the introduction of taxpayer-funded rebates for the Global Adjustment, which also apply to small business consumers.
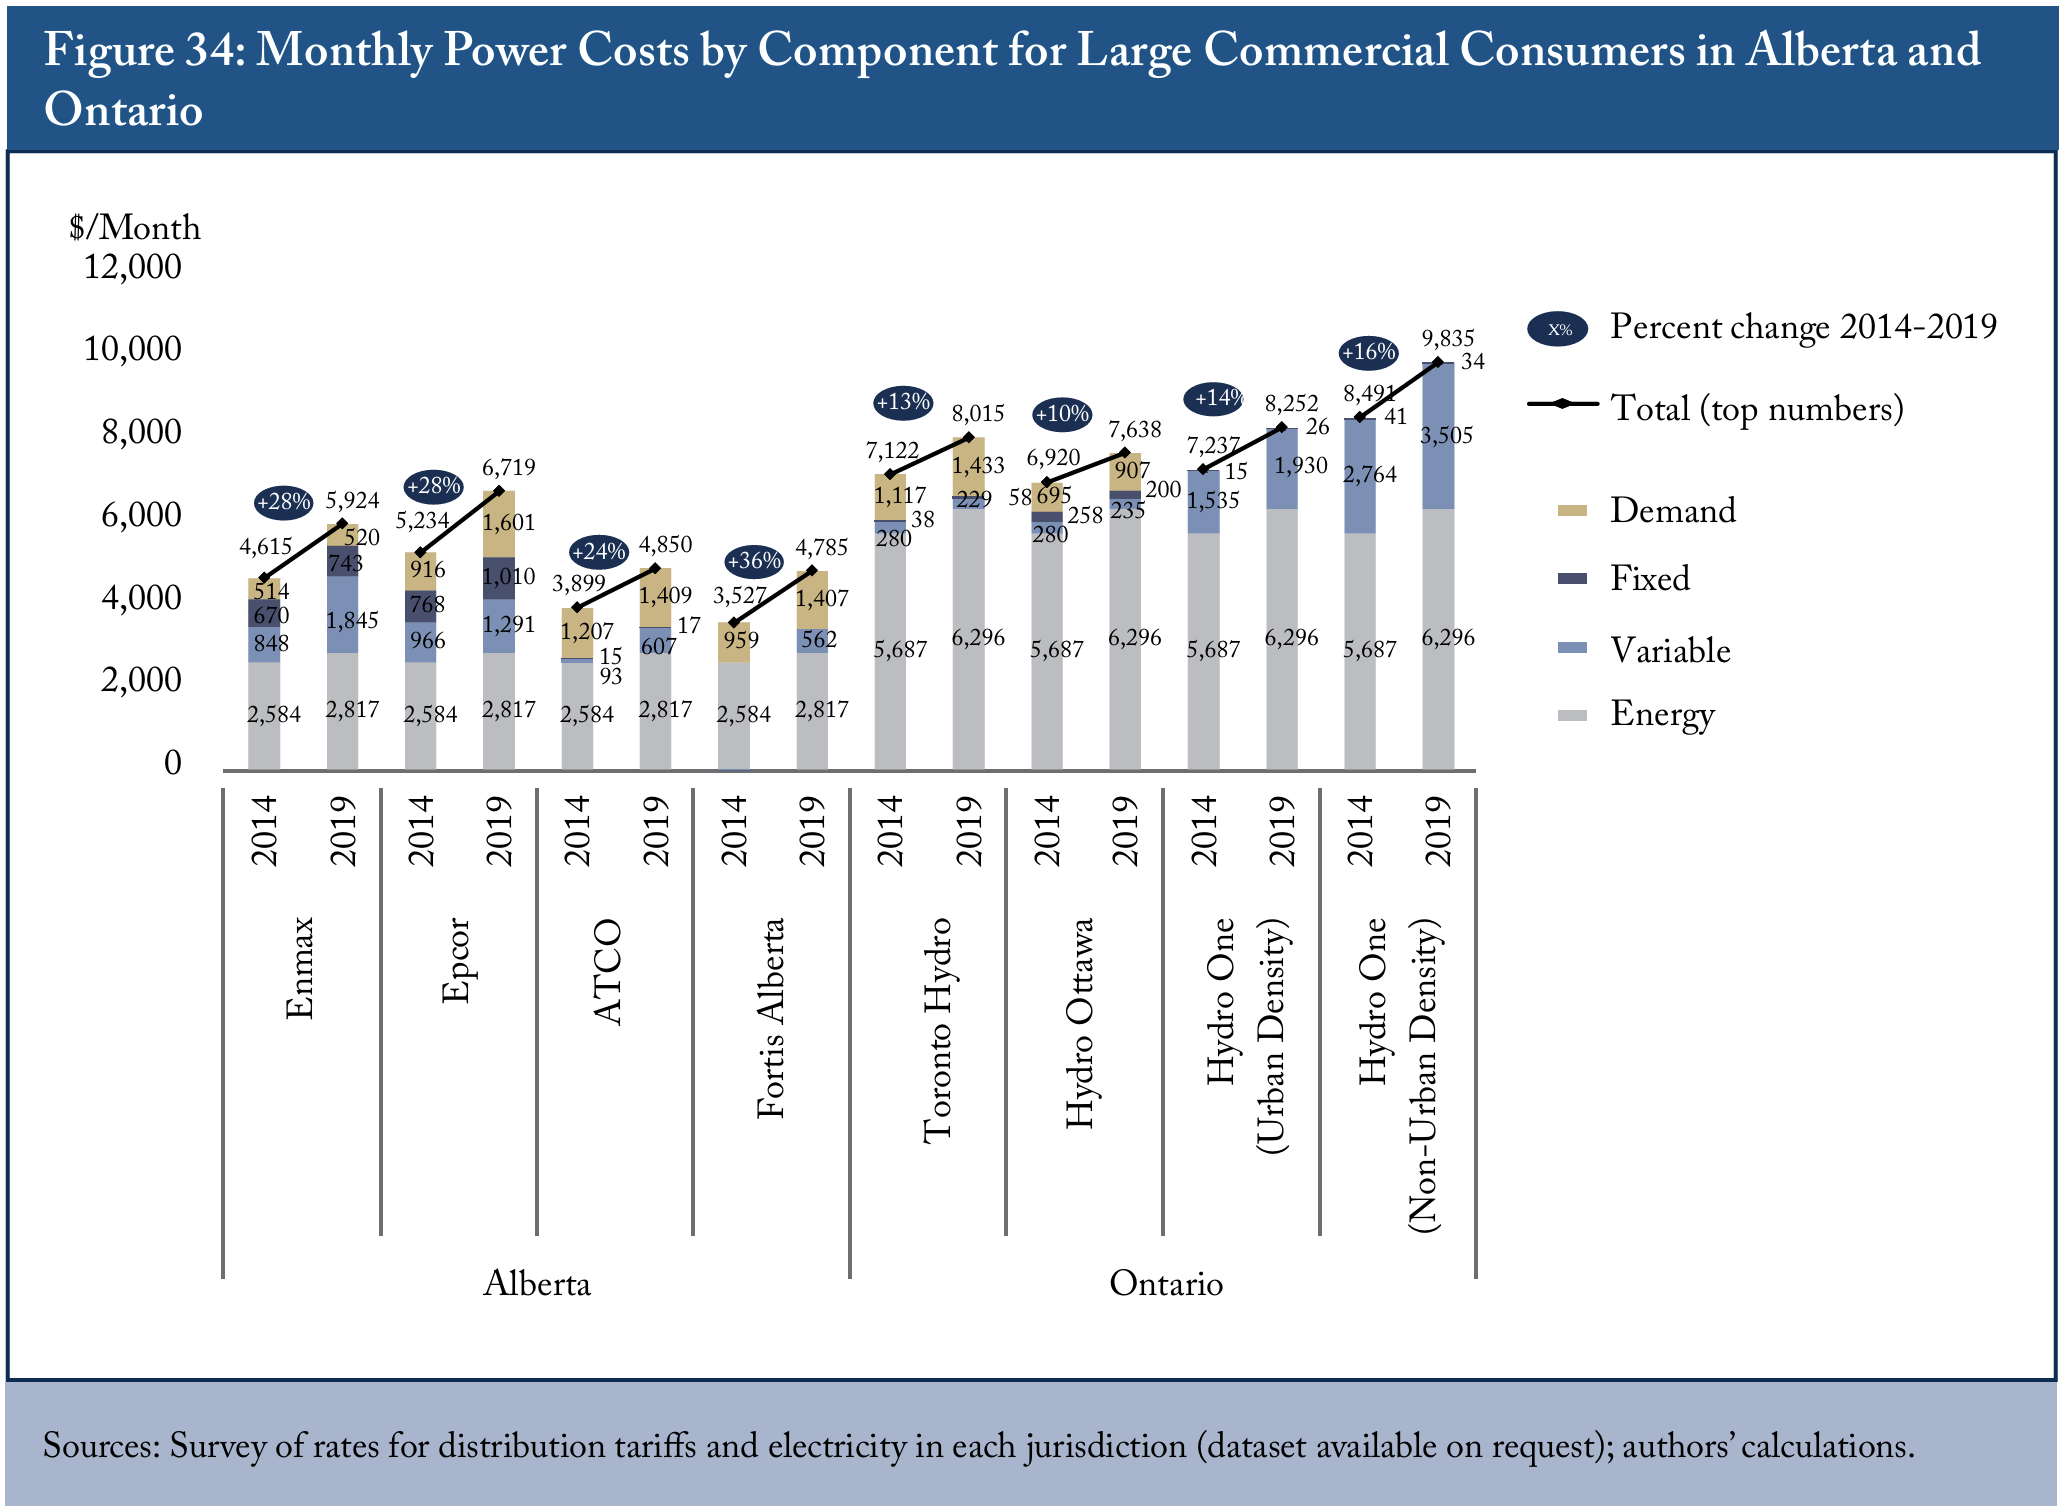
For the large commercial consumer profile, Figure 34 exhibits the changes in monthly electricity costs between 2014 and 2019. For Alberta, electricity costs for this profile increased by between 24 percent and 36 percent over the interval, depending on the distribution territory. Similar to changes observed for small commercial consumers, electricity cost growth was driven by increases in non-energy components – that is, increased demand, variable and fixed rates for distribution and transmission services, as well as allocations for the Balancing Pool.
In Ontario, the large commercial consumer profile faced electricity cost growth of 10 percent to 16 percent across the interval. Growth of 11 percent in estimated energy costs for this consumer profile contributed to this increase. However, for areas serviced by Hydro One, increased non-energy costs (i.e., for distribution and transmission services) were the driver of the overall cost increase.
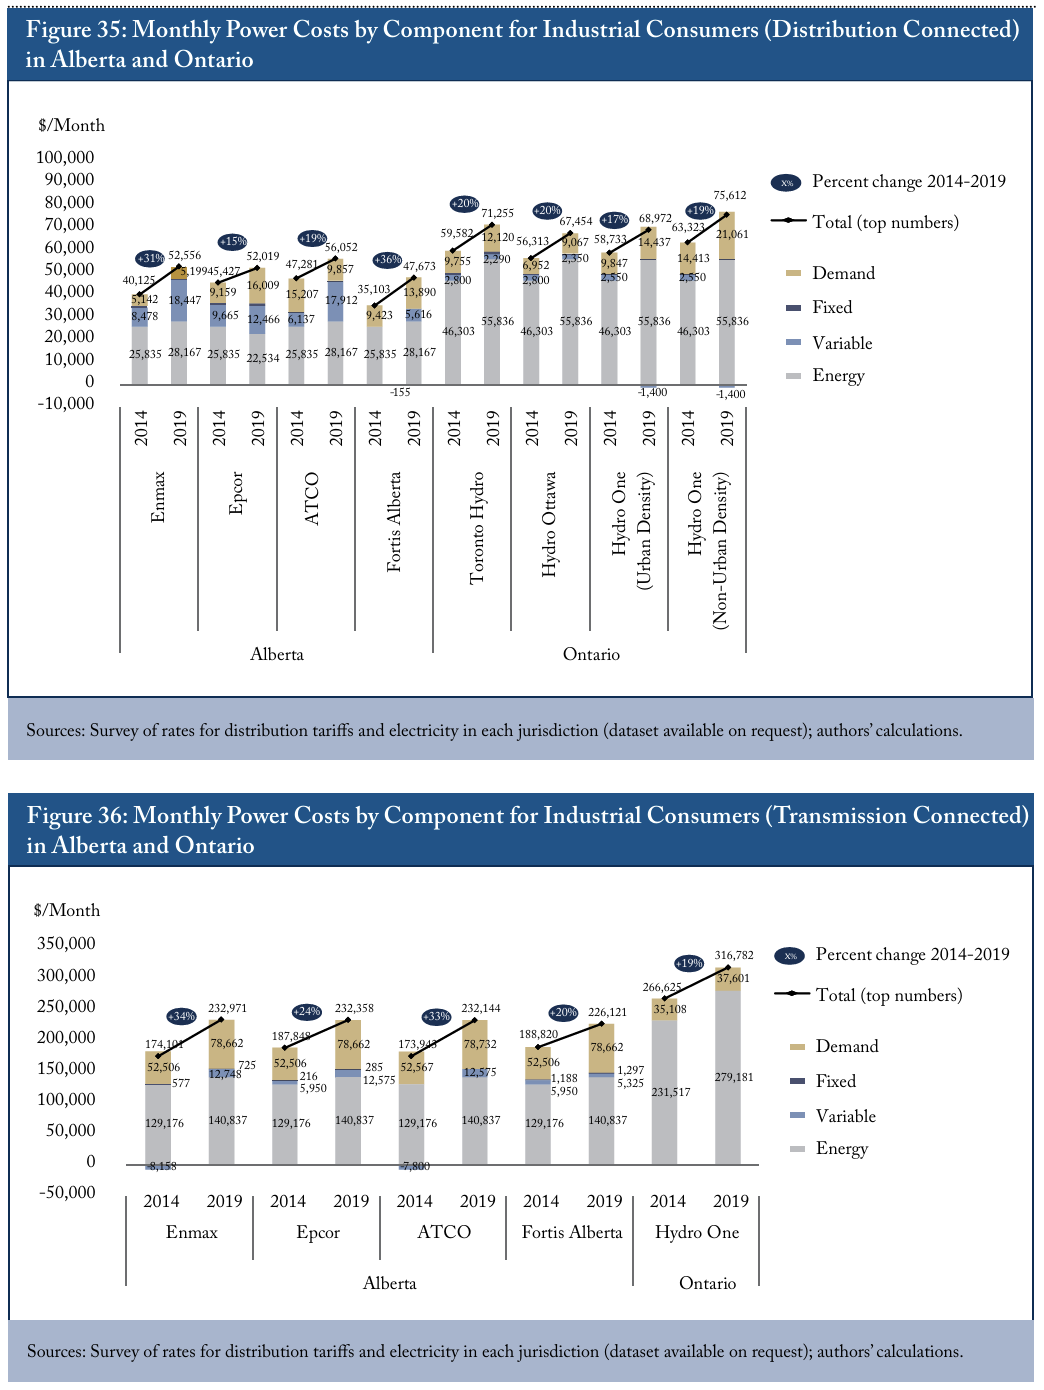
For the distribution-connected industrial consumer profile, Figure 35 exhibits the changes in monthly electricity costs between 2014 and 2019. In Alberta, this consumer profile faced cost increases of 31 percent and 36 percent in Enmax and FortisAlberta territories, respectively, and 15 percent and 19 percent in Epcor and ATCO territories, respectively. Across these distributors, cost growth was primarily driven by growth in variable and demand components for transmission and distribution services, as well as allocations for Alberta’s Balancing Pool.
In Ontario, electricity costs for this consumer profile increased by between 17 percent and 20 percent in the analyzed service areas over the interval. Growth of 21 percent in energy costs, complemented by significant increases in demand charges, propelled this overall increase.
For the transmission-connected industrial consumer profile, Figure 36 exhibits the changes in monthly electricity costs between 2014 and 2019. In Alberta, this consumer profile faced cost increases of 34 percent and 33 percent in Enmax and ATCO territories, respectively, and 24 percent and 20 percent in Epcor and FortisAlberta territories, respectively. Similarly to commercial consumers, cost growth was primarily driven by growth in variable and demand components for transmission and distribution services, as well as allocations for Alberta’s Balancing Pool.

In Ontario, electricity costs for this consumer profile increased by 19 percent over the interval, based on the Hydro One uniform transmission rates, IESO tariff and energy costs for HOEP and the Global Adjustment. Growth of 21 percent in energy costs and 7 percent growth of demand charges propelled this overall increase in electricity costs for transmission-connected industrial consumers in Ontario.
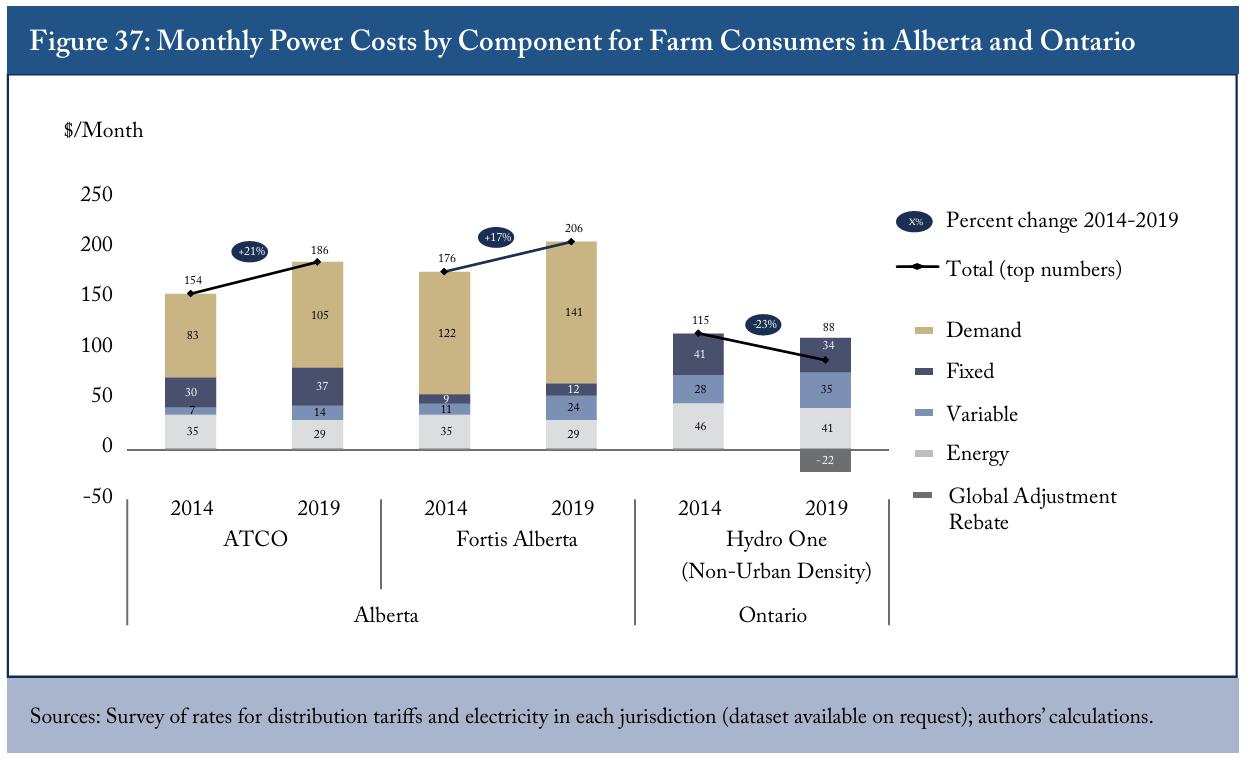
For the farm consumer profile, Figure 37 shows the changes in monthly electricity costs between 2014 and 2019. In Alberta, this consumer profile faced cost increases of 21 percent and 17 percent in ATCO territories and FortisAlberta territories, respectively. Similarly to commercial and industrial consumers, cost growth was primarily driven by growth in demand, fixed and variable components for transmission and distribution services, as well as allocations for Alberta’s Balancing Pool. Energy costs declined over the interval.
In Ontario, electricity costs for farms were assessed based on general service (energy-billed) rates for non-urban distribution in Hydro One service areas. Based on the farm profile, time-of-use rates would apply to this consumer in Ontario, and such a farm would receive the Global Adjustment rebate. Electricity costs for this profile declined by 23 percent over the interval, driven by the impact from the rebate introduction.
PART V Policy Considerations for Enhancing Efficiency of Electricity Pricing
This analysis of electricity prices underscores several important policy considerations. These are particularly relevant as policy-makers contemplate changes to the design of markets and structure of electricity rates. First is the alignment of the marginal prices facing different classes of consumers with marginal costs for providing electricity. Second is the efficient allocation of fixed system costs (e.g., the infrastructure for transmission and distribution, as well as the costs of generation). Third is the competitiveness of the overall system costs.
Aligning Consumer Prices with Marginal Costs
Firstly, aligning consumer prices with the costs of providing electricity ensures an efficient allocation based on supply and demand. If certain consumers face prices below the marginal cost of generating and delivering electricity, they will lack incentive to limit their consumption to the level that is optimal for the overall system. Aligning prices with marginal costs is difficult because of at least three features of electricity systems: (1) demand fluctuates constantly, electricity is not storable, and costs for generating electricity typically increase with greater demand;3434 Systems often use sources for generation that differ in the costs of dispatch. For example, the merit order for Alberta’s power pool (see Figure 7) reflects the increasing cost of dispatching blocks of power at higher levels of demand. Since demand varies over the course of an average day (notwithstanding impacts of weather and other idiosyncratic variation in market demand), the marginal cost will vary with the cost for dispatching generation that satisfies demand at any point in time. As well, the availability of different sources for generation will also vary at any point in time – for example, renewable forms of generation face intermittency issues (e.g., wind or solar depend on weather conditions), combustion sources (e.g., natural gas) may require down-time for maintenance, and hydroelectric resources face constraints from hydrological conditions (i.e., available water in a reservoir). (2) consumers value reliability of electricity, which requires covering the costs for adequate standby capacity; and (3) distribution and transmission infrastructure involve significant economies of scale.3535 A discussion of these challenges is provided by Borenstein, Severin and James B Bushnell. 2019. Do Two Electricity Pricing Wrongs Make a Right? Cost Recovery, Externalities, and Efficiency. Haas Energy Institute Working Paper. Available online: https://haas.berkeley.edu/wp-content/uploads/WP294.pdf. These authors note an additional distortion facing many electricity systems: since pollution is not priced, producers do not internalize such negative externalities in their costs of generation, and consumers similarly do not bear the cost of the pollution from the electricity they consume. However, while the adequacy of pollution charges in Canada is a matter of active current debate, a price applies to greenhouse gas emissions across Canadian provinces (whether levied by the province or the federal government under its “backstop”).
The first feature has been a particular challenge historically because of the availability of information around market conditions and the impracticality for many consumers to respond to hour-to-hour variation in price changes. Dynamically varying consumer pricing to match the changing market prices would not improve on the economic efficiency of consumers’ use if consumers cannot observe and respond to those changing prices. However, electricity systems may be able to reflect marginal costs in consumer prices – if only for certain consumers – as technologies emerge to enable more rapid and automated response of demand to market conditions.
Time-of-use pricing, as applicable in Ontario for residential and small commercial consumers, as discussed above, reflects an attempt to approximate hourly variation in the market price of energy. Typically, the prices for specified periods are fixed in advance so consumers subject to time-ofuse rates can plan their behaviour accordingly.3636 Time-of-use rates may also face some challenges with consumer sentiment. For example, even with predictable rate schedules, certain consumers find it cognitively costly to plan their behaviour around the changes in pricing. However, since it is fixed based on the expected average cost of electricity for specified periods (e.g., particular hours on weekdays or weekends and during summer/winter months), such timeof-use pricing will be an imperfect approximation of actual market conditions and will not reflect the costs of generation during high-stress periods (e.g., when low-cost generation is unavailable or demand spikes, owing to climatic conditions).
To more closely align prices with marginal costs, alternatives (or supplements) for forms of dynamic or time-of-use pricing are critical peak pricing and direct load control. Critical peak pricing imposes higher charges during peak events.3737 The ICI (discussed at greater length in Box 3 above) is not an efficient or consistent means of imposing critical peak pricing. The ICI is not a charge itself but functions as a reduction in the Global Adjustment charge. As a consequence, the benefit under the ICI for avoiding consumption during the “High-5” hours is neither linked to the costs of dispatching power during those hours nor to savings of reserve capacity for such peak events. Again, Bishop and Dachis (2020) calculate the savings from avoiding consumption during those High-5 hours as roughly $110,000/MWh in 2019. Such savings for a given consumer would presumably far exceed the cost of capacity to match demand, even during those peak hours. That is, during high stress market conditions, a higher charge encourages an economically efficient reduction in consumption by aligning consumer incentives with costs for dispatching more expensive sources of generation and maintaining reserve capacity. Again, in order for this pricing to improve efficiency, infrastructure must exist to alert consumers to peaks and enable them to alter their consumption (e.g., a “smart” meter that monitors market conditions and consumption in real-time).
Direct load control or interruptible rates offer further options for aligning consumer prices with system costs. For example, consumers may accept curtailment of their power consumption in exchange for a reduced rate or rebate during periods of curtailment.
Efficient Allocation of Fixed System Costs
Secondly, the value of reliability and economies of scale in electricity systems are relevant to the efficient allocation of fixed costs. Specifically, once constructed, the transmission and distribution infrastructure used to deliver electricity is a fixed cost from which all connected consumers benefit regardless of how much electricity is consumed across the system or by a particular consumer. With respect to generation, most consumers place a value on reliable electricity supply – most will pay some premium (e.g., atop the marginal cost of generation at a particular time) in order to have electricity available at any point in time.3838 Reliability involves both in-reserve capacity for generating power and the capacity of transmission and distribution infrastructure to deliver electricity to the given consumer at particular locations on the grid. However, while consumers value reliability, rules within many electricity markets (e.g., caps on wholesale offers and randomized curtailments) result in no individual consumer bearing the full cost of inadequate system capacity. The issues around such “reliability externalities”, as well as the challenges designing mechanics that both ensure long-run resource adequacy while aligning short-term incentives in electricity markets, is discussed in detail by Wolak, Frank. 2019. Wholesale Electricity Market Design. Available online: https://web.stanford.edu/group/fwolak/cgi-bin/sites/default/files/wolak_November_2019.pdf.
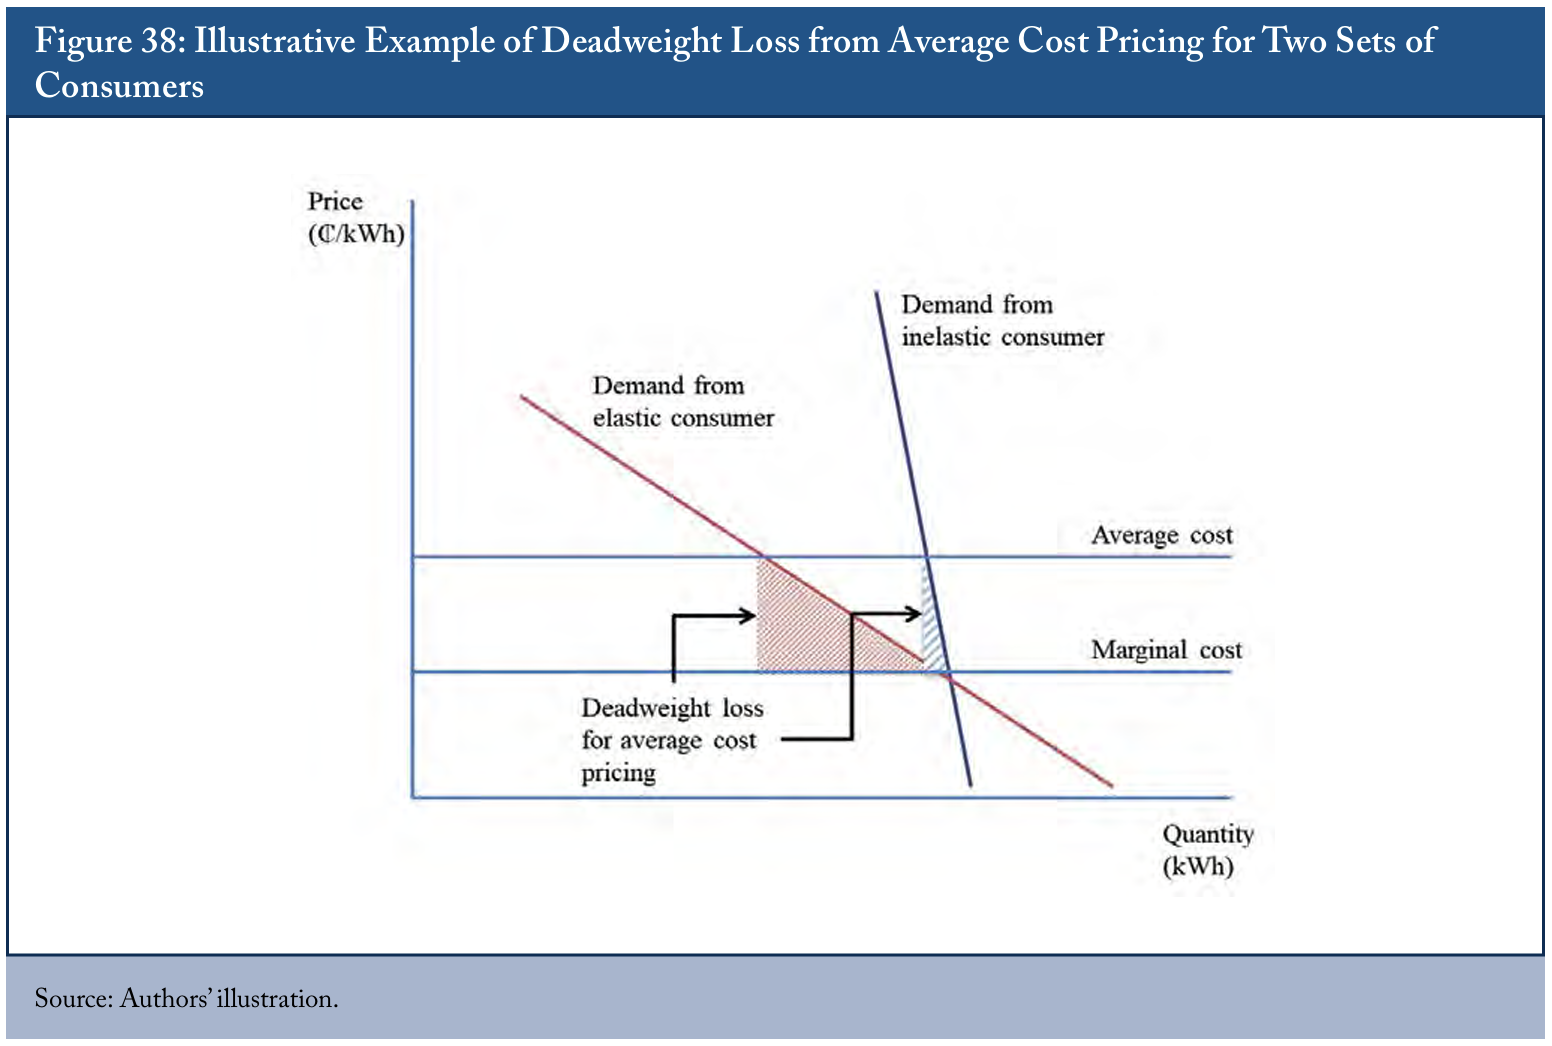
The challenge for the electricity system operators, regulators and providers is to structure rates to efficiently and equitably allocate the recovery of these fixed costs. Specifically, different consumers (whether by class or individually) differ in the price-responsiveness of their demand for electricity. Demand from certain consumers is relatively insensitive (in economic terminology, “inelastic”) to higher prices for electricity while other “elastic” consumers will respond to higher prices with greater relative reductions in electricity consumption. If a system allocates fixed costs with uniform prices equal to the average cost for delivering electricity (i.e., the fixed cost divided by the total consumption as a uniform variable charge in ₵ per kWh), this is likely to cause more elastic consumers to reduce consumption, resulting in deadweight loss.
For example, an industrial consumer (particularly in a trade-exposed sector) will be highly attuned to the price for electricity when deciding where and how much to produce. If facing high prices for power in a particular jurisdiction (and assuming all other factors equal), the producer would rationally reduce production accordingly and instead shift production elsewhere.
An illustrative example is given in Figure 38, exhibiting the deadweight loss from pricing at average cost rather than marginal cost.
Nonetheless, the fixed costs of the system must be recovered from consumers. The challenge is to do so while minimizing deadweight loss within an acceptable distributional outcome.
Borenstein (2016) suggests two options for optimally recovering fixed costs: (a) “Ramsey” pricing that discriminates pricing between consumers based on their relative elasticity of demand; and (b) fixed charges that are independent of the amount of electricity that is consumed.3939 Borenstein, Severin. 2016. The Economics of Fixed Cost Recovery by Utilities. Haas Working Paper 272R. Available online: https://haas.berkeley.edu/wp-content/uploads/WP272.pdf.
Under Ramsey pricing, more elastic consumers will face a relatively lower price than less elastic consumers. This reduces deadweight loss while recovering fixed costs – that is, Ramsey pricing allocates fixed costs with less distortion to overall consumption.
While loading fixed costs into variable charges can distort the consumption decision of consumers, fixed charges do not affect the consumption decision, except to the extent fixed charges induce consumers to defect from the system. The practical challenge of fixed charges is setting the charge for each class – particularly when members of a class vary widely in size (and derive different value from transmission, distribution and reliability services). For example, even while households differ in their electricity consumption, electricity consumption across commercial and industrial consumers varies to a much wider degree.4040 This is evident even from the differences of average consumption within classes across provinces shown in Figure 17 (average residential consumption by province) and Table 2 (reported consumption by consumer class) above.
Based on the analysis in this paper, average energy rates in most provinces (which, outside of Ontario and Alberta, imbed recovery of transmission and distribution costs) are highest for residential consumers, followed by small commercial consumers, among the consumer profiles. This is shown in Figure 21 above. Assuming that large commercial and industrial consumers are more elastic,4141 This is a reasonable assumption given that, compared with households and small businesses, much large commercial and industrial activity is more mobile – at least in the sense that production can be shifted to, or faces competition from producers in, lower cost jurisdictions. As well, with the lower costs to install distributed energy resources, demand across consumer classes may become more responsive to prices. That is, by installing distributed energy resources like rooftop solar generation, a consumer can reduce its variable charges and, possibly, its demand charges. On-site battery storage allows consumers to reduce consumption from the grid during high-priced periods. However, distributed energy resources are available across all consumer classes, and economies of scale presumably favour installation by larger (i.e., commercial and industrial) consumers. this generally fits with the Ramsey pricing prescription of lower rates for more elastic consumers.
Notably, as shown in Figure 34 to Figure 36, much of the electricity costs for large commercial and industrial consumers are composed of demand charges. However, Borenstein (2016) argues against demand charges, regarding these as an economically inefficient approach to allocating system costs. A usual rationale given for demand charges is to internalize the fixed costs for maintaining the capacity to serve a particular consumer. Nonetheless, Borenstein (2016) observes that a given consumer’s peak demand may not be coincident with the system peak. In that case, demand charges will create an inefficient incentive for consumers to reduce their peak or average demand. That is, the consumer will reduce its private cost by reducing its demand even though this reduction does not conserve any system capacity.
Finally, demand management programs like Ontario’s ICI (discussed above in Box 3) attempt to associate a price with the peak in system demand. However, as discussed by Bishop & Dachis (2020), the ICI structure provides an inefficiently large incentive to reduce consumption during the top five hours of consumption. The private benefit from reducing consumption in these particular hours likely far exceeds any savings for the electricity system (i.e., the incremental need for capacity to meet demand in those hours).4242 Specifically, because the ICI allows an industrial facility to reduce its share of the Global Adjustment based on its share of power during the five hours with the greatest demand during a given year, consuming power during those peak hours represented a cost of approximately $110,000/MWh in 2019. With such excessive costs around peaks, the ICI contributes to increased volatility for directly connected industrial loads as certain consumers chase the same peaks. See: Bishop, Grant and Benjamin Dachis. 2020. “Ontario Industrial Power Prices are Set to Spike: A Four-part Reform,” C.D. Howe Institute Intelligence Memo. Available online: https://www.cdhowe.org/intelligence-memos/bishop-dachis-%E2%80%93-ontarioindustrial-power-prices-are-set-spike-four-part-reform.
Competitive System Costs
By comparing both costs facing different consumer profiles and normalized system costs across provinces, this analysis provides insight into the competitiveness of each province’s electricity costs. Electricity is only one consideration for where a business might locate activities. However, if all else is equal, a producer – particularly in a trade-exposed, electricity-intensive industry – will rationally locate production in the jurisdiction where the producer minimizes its electricity costs.
Practically, provinces face different resource endowments and geographic constraints. In particular, the comparative costs of generating electricity can be an important source of comparative advantage for a given province – for example, the access to relatively low-cost hydroelectric resources in Quebec or Manitoba.
However, as evident from the decomposition of system costs for Ontario and Alberta (shown in Figure 3 and Figure 6, respectively), fixed costs for distribution and transmission also contribute significantly to the overall costs of electricity. As well, the market structure and procurement of generation capacity influence the energy costs for a system. For example, as shown in Figure 24, Ontario has experienced growth in energy costs (i.e., the sum of the HOEP and Global Adjustment) of roughly 80 percent over the past decade. As well, Ontario’s energy costs for large commercial consumers (Figure 34) and distribution-connected industrial consumers (Figure 27) exceed those in all other provinces.
Benchmarking all components of system costs across provinces is beyond the scope of this paper. However, based on Alberta’s normalized system costs between 2014 and 2018 (provided in Figure 9), growth in non-energy costs – particularly of transmission and distribution costs – drove overall cost growth over the interval.
In contrast, Ontario saw a significantly lower growth rate for distribution and transmission costs over the same interval. As shown in Figure 5, growth of Ontario’s normalized system costs from 2014 to 2018 was driven by growth in energy costs per MWh – particularly of the costs of contracts and regulated rates aggregated into the Global Adjustment.
Finally, large differences between provinces’ costs for generating electricity point to the potential for reducing consumer costs by increasing the trade of electricity between provinces. Increasing such interprovincial trade is dependent both on market rules and the necessary transmission infrastructure.4343 Carr (2010) discusses the differing market structures across provinces as an obstacle to increased inter-provincial trade in electricity. See: Carr, Jan. 2010. Power Sharing: Developing Inter-provincial Electricity Trade. C.D. Howe Institute. Available online: https://www.cdhowe.org/public-policy-research/power-sharing-developing-inter-provincial-electricity-trade. Any price advantage of importing electricity generated in another province will be offset by the amortized cost of the transmission infrastructure for accessing that electricity. The fixed costs of that infrastructure will also need to be recovered.
PART VI Conclusion
This paper has provided a comparison of the costs of electricity across provinces – for provincial systems overall, as well as for representative profiles across residential, commercial, industrial and farm consumers. The analysis showed the significant variation in normalized system costs overall – from an estimated $70/MWh in Quebec and Newfoundland & Labrador to $143/MWh in Ontario for the 2018 year.
The analysis of components of systems’ costs and consumers’ rates revealed that growth in Alberta’s system costs and consumer rates was primarily driven by increases in transmission and distribution costs while heightened energy costs (through the growing Global Adjustment) drove increased costs in Ontario.
A comparison of average unit electricity costs exhibited that transmission-connected industrial consumers face the lowest costs in most provinces. The exception is Ontario where generous taxpayerfunded rebates have reduced costs for residential and small commercial consumers.
The analysis also broke down the proportion of each consumer classes’ electricity costs across energy, variable, fixed and demand charges. This exhibited the degree to which these components contribute to cost differences between provinces. For example, Ontario’s large commercial and distribution-connected industrial consumers face higher electricity costs than in any other province, and Ontario’s outsized costs for these consumers in turn result from energy costs that exceed those in all other provinces. As well, compared with other provinces, Ontario residential consumers face relatively low electricity costs as a result of taxpayerfunded rebates.
Finally, this paper has highlighted policy considerations around electricity rates – specifically, the alignment of consumer prices with marginal costs, the efficient allocation of fixed costs, and the competitive implications of inter-provincial differences in the costs of electricity.
References
Reports
Bishop, Grant, and Benjamin Dachis. 2020. “Ontario Industrial Power Prices are Set to Spike: A Fourpart Reform.” C.D. Howe Institute Intelligence Memo. Available online: https://www.cdhowe.org/intelligence-memos/bishop-dachis-%E2%80%93ontario-industrial-power-prices-are-set-spike-fourpart-reform
Borenstein, Severin. 2016. The Economics of Fixed Cost Recovery by Utilities. Haas Working Paper 272R. Available online: https://haas.berkeley.edu/wp-content/uploads/WP272.pdf
Borenstein, Severin, and James B Bushnell. 2019. Do Two Electricity Pricing Wrongs Make a Right? Cost Recovery, Externalities, and Efficiency. Haas Energy Institute Working Paper. Available online: https://haas.berkeley.edu/wp-content/uploads/WP294.pdf
Carr, Jan. 2010. Power Sharing: Developing Interprovincial Electricity Trade. C.D. Howe Institute. Available online: https://www.cdhowe.org/publicpolicy-research/power-sharing-developing-interprovincial-electricity-trade
Market Surveillance Panel. 2018. The Industrial Conservation Initiative: Evaluating its Impact and Potential Alternative Approaches. Ontario Energy Board. Available online: https://www.oeb.ca/sites/default/files/msp-ICI-report-20181218.pdf
Ontario Energy Board. 2019. Regulated Price Plan Supply Cost Report May 1, 2019 to April 30, 2020. Available online: https://www.oeb.ca/sites/default/files/RPPSupply-Cost-Report-20190501-20200430.pdf
Sen, Anindya. 2015. “Peak Power Problems: How Ontario’s Industrial Electricity Pricing System Impacts Consumers.” E-Brief. Toronto: C.D. Howe Institute. Available online: https://www.cdhowe.org/public-policy-research/peak-power-problems-howontario%E2%80%99s-industrial-electricity-pricingsystem-impacts-consumers
Wolak, Frank. 2019. Wholesale Electricity Market Design. Available online: https://web.stanford.edu/group/fwolak/cgi-bin/sites/default/files/wolak_November_2019.pdf
_______________. 2012. Direct Energy Regulated Services 2012-2014 Default Rate Tariff and Regulated Rate Tariff (Decision 2012-343). Available online: https://www.auc.ab.ca/regulatory_documents/ProceedingDocuments/2012/2012-343.pdf
ATCO Electric. 2019. Price Schedule Index. Available online: https://www.atco.com/content/dam/atcodam-folder/electricity/rates/2019-01-01_atco_price_schedules-updated.pdf
B.C. Hydro. 2019. 2018/19 Annual Service Plan Report. Available online: https://www.bchydro.com/content/dam/BCHydro/customer-portal/documents/corporate/accountability-reports/financial-reports/annual-reports/BCHydro-Annual-Service-PlanReport-2018-2019.pdf
_______________. 2017. Electric Tariff (Effective April 1, 2019). Available online: https://www.bchydro.com/content/dam/BCHydro/customer-portal/documents/corporate/tariff-filings/electric-tariff/bchydro-electric-tariff.pdf
City of Edmonton. 2018. 2019 Electric Power Franchise Fee Rate Notification. Available online: https://www.epcor.com/products-services/power/rates-tariffs-fees/Documents2/LocalAccessFeeRetailersNotice-2019-01.pdf
ENMAX Power Corporation. 2019. Distribution Tariff Rate Schedule (Rates in effect as of April 1, 2019). Available online: https://www.enmax.com/ForYourHomeSite/Documents/2019-04-01-DTTariff-Rate-Schedule.pdf
_______________. 2014. Distribution Tariff Rate Schedule (Rates in effect as of April 1, 2014). Available online: https://www.enmax.com/ForYourBusinessSite/Documents/DT_Rate_Schedule_April_1%2C_2014.pdf
EPCOR Distribution & Transmission Inc. 2019. Distribution Access Service Tariff (Effective January 1, 2019). Available online: https://www.epcor.com/products-services/power/rates-tariffs-fees/Documents2/DistributionAccessServiceTariffJanuary-2019.pdf
_______________. Global Adjustment. Available online: http://www.ieso.ca/en/Power-Data/PriceOverview/Global-Adjustment
_______________. Yearly Hourly HOEP OR Predispatch Report. Available online: http://reports.ieso.ca/public/PriceHOEPPredispOR/
Manitoba Hydro. 2019. Annual Report for the year ended March 31, 2019. Available online: https://www.hydro.mb.ca/corporate/ar/pdf/annual_report_2018_19.pdf
Nalcor Energy. 2019. 2018 Annual Report. Available online: https://nalcorenergy.com/wp-content/uploads/2019/04/2018-19-Annual-Report-FINALApr-4-web-1.pdf
Newfoundland and Labrador Hydro. 2019. Schedule of Rates, Rules and Regulations (Updated January 1, 2019). Available online: https://nlhydro.com/wpcontent/uploads/2019/02/2019-01-01-Complete. pdf
New Brunswick Energy & Utilities Board. Application by New Brunswick Power Corporation for approval of the schedules of rates for the fiscal year commencing April 1, 2018 (Matter No. 375). Available online: https://filemaker.nbeub.ca/fmi/webd/NBEUB%20ToolKit13
Nova Scotia Utility and Review Board. 2019. Nova Scotia Power Tariffs (January 1, 2019). Available online: https://nsuarb.novascotia.ca/sites/default/files/Rates%20and%20Regulations%202019.pdf
Ontario Energy Board. Historical Electricity Rates. Available online: https://www.oeb.ca/rates-andyour-bill/electricity-rates/historical-electricity-rates
_______________. 2020. Ontario’s System-Wide Electricity Supply Mix: 2019 Data. Available online: https://www.oeb.ca/sites/default/files/2019-supplymix-data-update.pdf
_______________. 2019. 2018 Electricity Distributor Yearbook. Available online: https://www.oeb.ca/utility-performance-and-monitoring/natural-gasand-electricity-utility-yearbooks
_______________. 2013. Rate Order (Hydro One Networks Inc.) EB-2013-0141. Dec 19. Available online: http://www.rds.oeb.ca/HPECMWebDrawer/Record/419581/File/document
_______________. 2013. Decision and Rate Order (Ottawa Hydro Limited) EB-2013-0143. Dec 5. Available online: http://www.rds.oeb.ca/HPECMWebDrawer/Record/419581/File/document
_______________. 2013. Decision and Rate Order (Toronto Hydro-Electric System Limited) EB2012-0064. May 9. Available online: http://www.rds.oeb.ca/HPECMWebDrawer/Record/395943/File/document
Public Utilities Board. 2018. Final Order Approving June 1, 2018 Electricity Rates for Manitoba Hydro (Order No. 68/18). Available online: http://www.pubmanitoba.ca/v1/proceedings-decisions/orders/pubs/2018%20orders/68-18%20%20with%20appendix%20a.pdf
New Brunswick Power Corporation. 2019. 2018/19 Annual Report. Available online: https://www.nbpower.com/media/1489396/2018-19_annualreport-en.pdf?2
SaskPower. Power Supply Rates. Available online: https://www.saskpower.com/Accounts-andServices/Billing/Power-Rates/Power-Supply-Rates
SaskPower. 2019. Annual Report 201-19. Available online: https://www.saskpower.com/-/media/SaskPower/About-Us/Reports/Past-Reports/Report-AnnualReport-2018-19.ashx
Data Sources
Alberta Balancing Pool. Consumer Allocation 20012019. Available online: http://www.balancingpool.ca/consumer-allocation-2001-2019/
Alberta Electric System Operator. Energy Trading System. Available online: http://ets.aeso.ca/
_______________. 2020. 2019 Annual Market Statistics. Available online: https://www.aeso.ca/market/market-and-system-reporting/annualmarket-statistic-reports/
_______________. 2019. ISO Tariff (Effective 201901-01). Available online: https://www.aeso.ca/rules-standards-and-tariff/tariff/iso-tariff/download/AESO-2019-ISO-Tariff-2020-01-2.pdf
_______________. 2013. ISO Tariff (Effective 201310-01). Available online: https://www.aeso.ca/rules-standards-and-tariff/tariff/iso-tariff/download/AESO-2013-ISO-Tariff-2015-01-01.pdf
Alberta Utilities Consumer Advocate. Historic Rates. Available online: https://ucahelps.alberta.ca/historic-rates.aspx
Alberta Utilities Commission. Annual Distribution Filings (ENMAX Power, EPCOR Distribution, FortisAlberta, ATCO Electric). Available online: https://www2.auc.ab.ca/sitepages/FilingFindControl.aspx
_______________. 2018. Direct Energy Regulated Services 2019 Interim Default Rate Tariff and Regulated Rate Tariff (Decision 23989-D012018). Available online: https://www2.auc.ab.ca/Proceeding23989/ProceedingDocuments/23989_X[]_23989-D01-2018DERS2019InterimDRTandRRT_0009.pdf
_______________. 2013. ATCO Electric 2014 Annual PBR Rate Adjustment Filing (Decision 2013-461). Available online: https://www.auc.ab.ca/regulatory_documents/ProceedingDocuments/2013/2013-461.pdf
_______________. 2014. Distribution Access Service Tariff (Effective January 1, 2014). Available online: https://www.epcor.com/productsservices/power/rates-tariffs-fees/Documents2/DistributionAccessServiceTariff-2014-01.pdf
EPCOR. 2013. Local Access Fee rate. Available online: https://www.epcor.com/products-services/power/rates-tariffs-fees/Documents2/LocalAccessFeeRetailersNotice-2014-01.pdf
Emera. 2020. 2019 Annual Report. Available online: http://investors.emera.com/Cache/IRCache/16fd44b55271-1326-c0b1-0c4d0d22af13.PDF?O=PDF&T=&Y=&D=&FID=16fd44b55271-1326-c0b1-0c4d0d22af13&iid=4072693
Fortis Alberta. 2019. Updated 2019 Annual Rate Adjustment Filing (April 1, 2019). Available online: https://www.fortisalberta.com/docs/default-source/default-document-library/2019-april-rates-optionsriders.pdf?sfvrsn=ab359f1b_4
Fortis Alberta. 2014. 2014 Annual Rates Filing (March 31, 2014). Available online: https://www.fortisalberta.com/docs/default-source/defaultdocument-library/2014-mar-rates-options-riders.pdf?sfvrsn=8175811b_12
Hydro One. 2019. Financial Report 2019. Available online: https://www.hydroone.com/investorrelations/Documents/AR2019/Hydro%20One%20Limited%20Annual%20Report%202019%20Financial%20Statements.pdf
Hydro Quebec. 2020. Annual Report 2019. Available online: https://www.hydroquebec.com/data/documents-donnees/pdf/annual-report-2019-hydroquebec.pdf
Hydro Quebec. 2019. Electricity Rates effective April 1, 2019 (R-4057-20187). Available online: http://publicsde.regie-energie.qc.ca/projets/469/DocPrj/R4057-2018-B-0190-Demande-Piece-2019_03_14.pdf
Independent Electricity System Operator. 2019. 2018 Annual Report. Available online: http://ieso.ca/-/media/Files/IESO/Document-Library/annualreports/IESO-2018-annual-report.pdf?la=en
_______________. 2019. Decision and Rate Order (Hydro One Networks Inc.) EB-2017-0049. June 11. Available online: http://www.rds.oeb.ca/HPECMWebDrawer/Record/644655/File/document
_______________. 2018. Regulated Price Plan Prices and the Global Adjustment Modifier for the Period May 1, 2018 to April 30, 2019. Available online: https://www.oeb.ca/sites/default/files/RPP-GA-ModifierReport-20180419.pdf
_______________. 2018. Decision and Rate Order (Hydro Ottawa Limited) EB-2018-0044. Dec 13. Available online: http://www.rds.oeb.ca/HPECMWebDrawer/Record/628921/File/document
_______________ 2018. Decision and Rate Order (Toronto Hydro-Electric System Limited) EB2018-0071. Dec 13. Available online: http://www.rds.oeb.ca/HPECMWebDrawer/Record/628953/File/document
_______________. 2018. Decision and Rate Order (IESO 2019 Interim Fees) EB-2019-0002. Dec 18. Available online: http://www.rds.oeb.ca/HPECMWebDrawer/Record/629357/File/document
_______________. 2018. Decision and Rate Order (Uniform Transmission Rates) EB-2018-0326. Dec 20. Available online: http://www.rds.oeb.ca/HPECMWebDrawer/Record/629718/File/document
_______________. 2014. Decision and Rate Order (IESO 2014 Fees) EB-2013-0002. May 22. Available online: http://www.rds.oeb.ca/HPECMWebDrawer/Record/438630/File/document
__________________. 2014. Decision and Rate Order (Uniform Transmission Rates) EB-20120031. Jan 9. Available online: http://www.rds.oeb.ca/HPECMWebDrawer/Record/422440/File/document
Statistics Canada. Table 18-10-0004-01 (Consumer Price Index, monthly, not seasonally adjusted). Available online: https://www150.statcan.gc.ca/t1/tbl1/en/cv.action?pid=1810000401
_______________. Table 18-10-0204-01 (Electric power selling price index, monthly). Available online: https://www150.statcan.gc.ca/t1/tbl1/en/tv.action?pid=1810020401
_______________. Table 25-10-0015-01 (Electric power generation, monthly generation by type of electricity). Available online: https://www150.statcan.gc.ca/t1/tbl1/en/tv.action?pid=2510001501
_______________. Table 25-10-0029-01 (Supply and demand of primary and secondary energy in terajoules, annual). Available online: https://www150.statcan.gc.ca/t1/tbl1/en/tv.action?pid=2510002901
_______________. Table 25-10-0030-01 (Supply and demand of primary and secondary energy in natural units). Available online: https://www150.statcan.gc.ca/t1/tbl1/en/cv.action?pid=2510003001
_______________. Table 25-10-0021-01 (Electric power, electric utilities and industry, annual supply and disposition). Available online: https://www150.statcan.gc.ca/t1/tbl1/en/tv.action?pid=2510002101