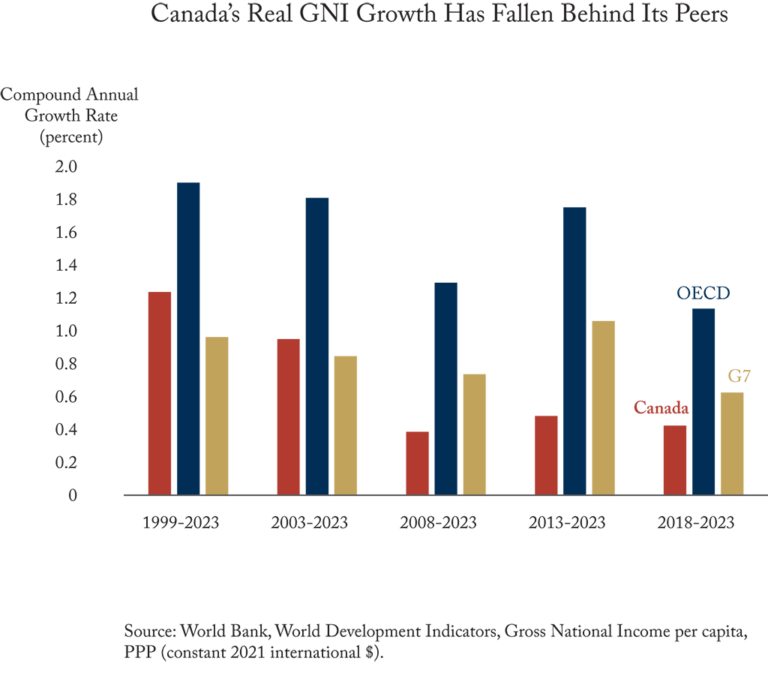
Canada’s household saving picture is splitting in two. Since 2021, the top fifth has lifted its average net saving to over $75,000 a year, while the lowest has sunk deeper into dissaving, spending nearly $39,000 more than its disposable income. The middle and second fifths have also slipped further into the red. Higher earners are pulling away as lower earners draw down savings and borrow to keep spending. For more on the health of Canada’s economy, see this C.D. Howe Institute memo.
Note: Negative values denote dissaving (consumption exceeds disposable income). Quintiles averaged the following income: Lowest quintile $33,000, second quintile $62,000, third quintile $88,000, fourth quintile $120,000, fifth quintile $219,000.
Source: Statistics Canada, Distributions of Household Economic Accounts (Table 36-10-0587-01). Figures are average net saving per household.