






Study in Brief
Canada’s municipalities deliver services that are critical to quality of life, and require major commitments of resources in taxes, fees and intergovernmental transfers. But their budgeting practices, and people’s ability to measure their municipality’s performance against its budget commitments, are nowhere near the level appropriate to this importance.
This report looks at the annual projections for spending and the bottom line (revenues minus expenses) in the budgets of 31 of Canada’s largest municipalities over the period from 2010 to 2018, and the results reported in those municipalities’ year-end financial statements. It asks what a councillor, or taxpayer, or citizen – a person who is motivated and numerate, but non-expert – would infer from each budget, and would conclude when comparing the budget to the results.
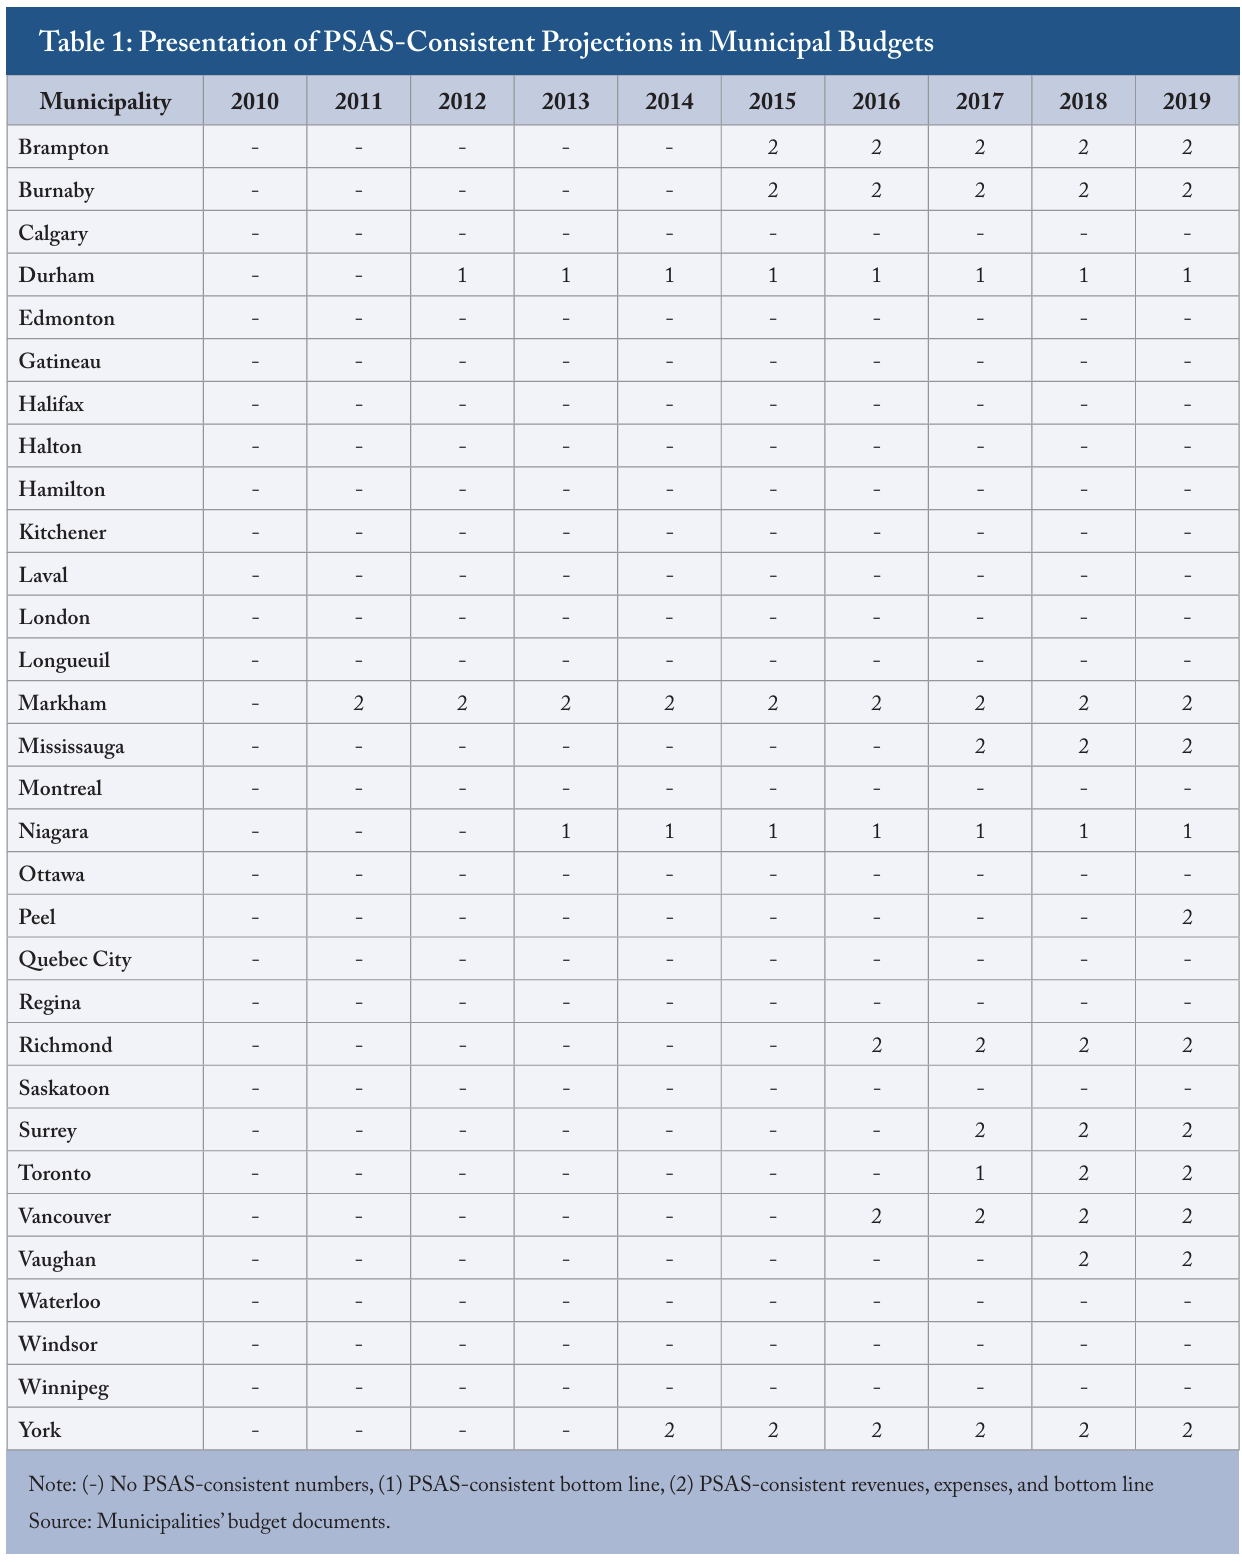
In most of the municipalities we look at, simply finding informative numbers about spending plans in budgets is a challenge: less than one-third of their budget documents contain numbers using the same public sector accounting standards (PSAS) used in the year-end financial statements. Users who do put the time and effort into finding numbers describing their municipality’s operating and capital spending plans, and compare them to the expenses reported after year end, would typically conclude that the municipality did a terrible job of hitting its budget projections. Comparing plans in cities’ budget documents to results in cities’ financial statements, users would find that the difference between spending growth as projected in budgets and expenses growth published after year-end averaged 8 percent annually. A key contributor to these discrepancies is the fact that cities typically budget using different accounting practices than the PSAS-consistent rules they follow in publishing their results. Critically, municipal budgets show investments in capital assets like buildings, sewers and transit on a cash, upfront basis while the financial statements amortize the cost over years. Comparing budgets on a PSAS basis to results yields an average annual gap between plans and outcomes of 4 percent, and suggests that cities have a tendency to undershoot their budgeted spending.
As for the bottom line, the budget debate in most municipalities, and the assumptions of most councillors, citizens and journalists, emphasize the need to “balance the operating budget,” and downplays the separate capital budget. PSAS do not separate “operating” and “capital” – accrual accounting writes capital down as it delivers its services (amortization), and produces a single statement of revenue and expense with a bottom line that represents a change in a government’s net worth and capacity to deliver services. A city’s “operating budget” balance is nevertheless typically the subject of serious anxiety, culminating in council voting a budget with a bottom line very close to zero. In these municipalities, the revelation of substantial surpluses in the year-end financial statements is completely at variance with peoples’ understanding, and the anxiety of the budget debate. Most Canadians would be amazed to learn that Canada’s cities routinely record large surpluses, and – in contrast to many senior governments – have positive net worth. The 31 municipalities we look at ran aggregate budget surpluses of $11 billion in 2018, $8 billion over budget expectations.
Improving this situation is partly a matter of presenting budgets using the same PSAS-consistent revenue, expense, and bottom-line numbers that municipalities already use in their financial statements. Ideally, provinces that mandate municipal budgets prepared in other ways – splitting operating and capital budgets, with the latter prepared on an antiquated cash basis – would stop doing so. Councillors, ratepayers, and voters should insist on better numbers from their municipalities, and on the improved fiscal accountability the better numbers will make possible.
Introduction
Control over public money is central to a democratic government at every level: national, provincial, and local.
Local governments are especially important for the services and infrastructure that affect most Canadians’ daily lives, such as transit, roads, and water management. Those services and infrastructure come at a cost: fees, property taxes, and transfers from other levels of government, for which Canadians pay one way or another.
Ideally, municipal governments in Canada would manage their finances commensurately with the importance of their expenses and revenues, and the bottom line that determines their ongoing capacity to deliver services. Sadly, however, most of Canada’s major cities are not up to this standard.
As the C.D. Howe Institute’s 2019 report card on Canada’s most populous municipalities (Robson and Omran 2019c) documents, most local governments present budget information that even experts find hard to reconcile with their financial results, and that would stump non-experts. Most users of municipal budgets can understand neither the upcoming year’s plans in relation to the recent past, nor how closely the city’s results after the year has ended resemble that year’s budget plans.
In this report, we show what a numerate but nonexpert reader of budgets in these 31 municipalities would anticipate with respect to spending and the bottom line over the past nine years, and compare that with the results published after yearend. This user would draw two conclusions. First, cities routinely miss their budget targets by large amounts. Over the past nine years, these cities missed their projections for spending growh, either over- or under-shooting, by 8 percent on average. Second, cities routinely record massive surpluses, notwithstanding the angst about achieving balance at budget time. In 2018, the cities in our sample ran aggregate budget surpluses of $11 billion, $8 billion above the amount a reader of municipal budget documents would have anticipated.
These figures overstate the variance between budget targets and results that users would calculate if cities presented their budgets using accounting consistent with their financial statements. But they are the figures that a person who is engaged and intelligent, but non-expert – a city councillor, for example – would likely calculate, and they have important implications. One is potential cynicism and disengagement on the part of taxpayers and voters who may dismiss municipal financial management as utterly inept. Another is that public perceptions of the relative fiscal health of municipalities on the one hand, and federal and provincial governments on the other, is badly out of line with reality. Cities are collecting more revenue, including transfers from other governments, than they need, and investing less in infrastructure than they could.
The most recent figures offer hope that municipal budgets will be more transparent and better guides to decision-making in the future. Almost onethird of the municipalities we look at now present budget information consistent with Public Sector Accounting Standards (PSAS), up from almost none a few years ago. As more municipalities follow their lead, councillors and taxpayers will be able to track results against budget commitments more closely. That should not only make budget projections more meaningful, it should help municipalities make better decisions about the building and financing of capital projects, and better match the costs they impose on their citizens with the critical services they provide.
Measuring Fiscal Accountability
Canadians who pay attention to debates in their municipal councils and engage with their local representatives might question our claim that control over public funds at the local level is weak. Councillors vote overall budgets and tax rates, and scrutinize specific expenses. Every fall features a debate over balancing the budget – typically featuring warnings about hikes in property taxes and cuts in services. Formal control is not the same as effective control, however. What matters is whether the votes of councillors – and, by extension, the votes of the people who elect them – prompt actions that correspond to their expectations, and whether councillors can understand why deviations occur, and correct problems when they find them.
The Fiscal Cycle: Budgets and Financial Statements
Our exploration of the effectiveness of control over municipal finances focuses on the two primary documents in a city’s annual fiscal cycle: the budgets municipal councils vote before or shortly after the beginning of the year; and the financial statements municipalities publish after the end of the year. Budgets are the core expression of a city’s fiscal priorities – as the annual fall debate over revenues, expenses, and the difference between them testifies. The audited financial statements are the definitive report of the city’s revenues and expenses, and the difference between them, prepared according to the same public sector accounting standards that apply to Canada’s federal, provincial and territorial governments. Those PSAS-consistent statements show consolidated totals for the city’s revenues and expenses, and the difference between them – the bottom line that indicates whether the city’s net worth rose or fell over the year.
Ideally, a reader would be able to compare the revenue, expense, and bottom-line projections in a given year’s budget to those year-end results. One key comparison is between the projections for the upcoming year and the counterpart figures for the fiscal year about to end. Another is between the budget projections and the results for that same year as revealed in the financial statements. In the case of the federal government and most provincial and territorial governments in Canada, a user can do these comparisons, and draw straightforward conclusions about whether revenues and expenses came in above or below budget, and how the bottom line compared to projections – a precondition for acting to correct large or persistent gaps between projections and results.
Obstacles to Understanding Municipal Budgets
The situation at the municipal level in Canada falls far short of this ideal. The most serious problem is that, while Canada’s cities report their year-end results on a PSAS-consistent basis, most cities do not present their budgets that way. PSAS, like the accounting standards that prevail in the private sector, mandate that the reporting entity record revenues and expenses during the period when the related services or other transactions take place, not when the cash itself changes hands: accrual rather than cash accounting. While municipal budgets follow accrual accounting in some areas, such as accounts payable, they follow cash accounting for capital projects – long-lived items such as buildings, roads and water pipes – recording the costs upfront rather than expensing them over the many years they will deliver services. Capital projects are an area where the difference between accrual and cash accounting matters a great deal.
Put simply, accrual accounting treats the purchase of a long-lived capital as an investment in an asset, and records the expense related to that asset over the period it is expected to deliver its services. The amortization period for assets such as a water pipe, bridge or municipal building may be decades long. That approach has many virtues. Matching the recorded expense to the services provided by the asset makes it easier to ensure that the people who benefit are paying for them at the same time. It also keeps tabs on the remaining life of the asset – ideally, its recorded value will drop to zero at the point when it wears out and needs replacing.
Cash accounting shows the entire outlay for anything, including long-lived capital, at the time it occurs. This approach was understandable a century ago, when municipal governments were smaller and simpler, when less sophisticated revenue and borrowing tools made cash on hand salient for a government’s ability to make payments, and when many concepts underlying modern accrual accounting had not yet been developed. It makes less sense today, when these things are no longer true. While PSAS do not support it, however, it continues to shape municipal budgets. Most municipalities present two budgets at the beginning of the year – an operating budget and a capital budget. And the capital budget uses cash accounting.
This practice creates a fundamental problem for a user who wants to compare intentions at the beginning of the year to year-end results. Municipal budgets typically do not have a single line in their budget documents for total revenues or expenses that is comparable to the consolidated revenue and expense totals in their financial statements. As a result, they also do not have a bottom line comparable to the surplus or deficit that appears in the financial statements.
The differences between how most municipalities present budget information and how their financial statements report their results mean that users seeking to compare projections to results face another fundamental challenge.11 The challenges include more than the two we list here. Key numbers are often buried deep in budget documents, and may be obscurely labelled. Budgets and financial statements often appear late. Robson and Omran (2019c) evaluates municipal budgets and financial statements by a number of criteria that affect their value to a user who is numerate but is not an expert in accounting. PSAS-based financial statements show consolidated revenues and expenses for the municipality using common definitions for its activities based on whether or not the municipality controls the activity in question. They therefore include the revenues and expenses of municipal enterprises, pulling together activities funded by fees as well as activities funded by taxes to present the municipality’s total claim on resources. Municipal budgets occasionally separate activities funded by taxes from activities funded by user fees and other non-tax revenues, and often net the revenues of the latter against the associated expenses, providing only a partial view of the municipality’s activities, and creating an additional discrepancy between the numbers that appear in budgets and those that appear in financial statements.
City Budgets: The Perspective of a Motivated Non-Expert
Except in the cases of cities that also provide PSAS-consistent budget numbers alongside their operating and cash-based capital budgets, these discrepancies – cash-based budgets versus PSAS-consistent financial statements, and budgets’ exclusion of activities that appear in consolidated financial statements – mean that even experts in accounting will have trouble assessing how close a municipal government’s results were to its budget projections. And most municipal councillors, ratepayers, and voters are not experts in accounting. The ones who will be interested in municipal finances will typically be motivated and numerate – able to understand numbers and do simple math. But they will not have the expertise, time and energy – or funds for professional accountants and consultants – to decode the numbers they find in a budget so as to make sense of the actual results.
The confusion will be most profound on the revenue side. “Capital financing” in municipal capital budgets includes all sources of funds: not only (i) taxes and other revenues that potentially increase the city’s net worth, such as fee income and grants from other levels of government, but also (ii) funds raised by issuing debt and transfers from reserves, which do not add to net worth. Even a numerate user who encountered this nonsensical mixture would likely give up, stymied in the attempt to calculate PSAS-consistent revenue projections from a typical city budget.
The spending side of a typical municipal budget also presents challenges. A motivated and numerate non-expert, however, could find information that is apparently relevant. An understandable approach by such a user would be to begin at the front of the city’s budget document, and flip pages until she or he finds a figure identified as total spending in the operating budget and a figure identified as total spending in the capital budget. Then, being motivated and numerate, but non-expert, the user would add the two, and assume the resulting total was the municipality’s planned spending for the year – and therefore should be the appropriate number to compare with total expenses reported in the municipality’s financial statements at the end of the year.22 A very astute user might notice that some municipal budgets show transfers of funds between their operating and capital budgets, which could result in some double counting of spending when adding the operating and capital totals together. We think adjusting for these flows is too much to ask of a non-expert, and in any event, these transfers are small relative to the totals. It is worth emphasizing that this is not an appropriate approach. What the user ought to be able to do is start at the front of the budget document, and flip pages until she or he finds a figure representing the total projected expenses for the year, calculated on a PSAS-consistent basis. In nearly all cities in the past, however, and in most cities to this day, no such number appears in budget documents. That is why our motivated non-expert adds the operating and capital spending totals.
What of the bottom line – the difference between revenues and expenses? The minority of cities that present PSAS-consistent numbers in their budgets provide users with a single figure comparable to the single bottom-line figure they publish in their financial statements. For the majority that don’t, our judgement is that the non-expert, unable to find a revenue number in the budget that corresponds to the spending number calculated by adding the operating and capital totals, would take her or his cue from the intense debate about balancing the city budget. As we have remarked already, balance – a number very close to zero – is the highlight of most debates over municipal budgets, and the signal of success when those debates conclude. The non-expert will not know, and most budget documents do not clearly state, that the term “balance” only applies to the operating budget. Most people’s interpretation of municipal budgets, unless they contain PSASconsistent numbers for the bottom line, are that they aim for balance: a bottom line of zero. This discussion of how motivated but non-expert people might interpret municipal budgets sets us up for a more detailed discussion of what conclusions they would draw from a comparison of the budgets and financial statements of some of Canada’s largest municipalities since 2010.
Budgets versus Results
The chief question we want to answer is: how helpful would a numerate but non-expert user find the projected figures for spending in the budget documents of Canada’s major cities as guides to what was going to happen? Ideally, we would look at both revenues and expenses. The C.D. Howe Institute’s examination (Robson and Omran 2019b) of the reliability of budget projections among Canada’s senior (federal, provincial and territorial) governments reveals persistent overshoots of both revenue and expense projections, with a tendency for in-year surprises on the revenue and expense sides to coincide. This pattern is suggestive: it is not consistent with traditional prescriptions for managing through the economic cycle, and raises suspicions that governments are engineering windfalls that they then spend, and may be guilty of other techniques to manage their bottom lines.
As explained in the previous section, however, the revenue side at the municipal level is confusing enough to stump a non-expert user at the outset. We therefore focus on the budget projections for spending versus the expenses reported in the financial statements. Then we turn to the bottom line, looking at budget projections versus financial statement results.
Choice of Municipalities and Years
Our choice of municipalities reflects their size, measured by population. We look at Canada’s 25 most populous municipalities, plus the six most populous regional municipalities in Ontario, for a total of 31.
Our choice of the starting year reflects the timing of municipalities’ adoption of PSAS in their financial statements. That happened in 2009. Because we need clean comparisons with prior years for our investigation, which are not possible for many cities in that first year due to the accounting change, we start with 2010. 2018 is the latest year for which year-end results are available. So we look at the nine years from 2010 to 2018.
The conclusions a user will draw from comparisons of budgets to results over this period will depend in large part on whether the municipality in question presented PSASconsistent projections in its budgets. Some of the 31 municipalities have begun showing some PSAS-consistent projections in their budgets: a few showing the bottom line only, and a growing number showing PSAS-consistent revenues and expenses as well. Table 1 shows whether a city presented a PSAS-consistent bottom line figure (1) or both revenues and expenses (2) in its budget each year (we show 2019 budgets for completeness).
Measuring Gaps between Budget and Actual Expenses
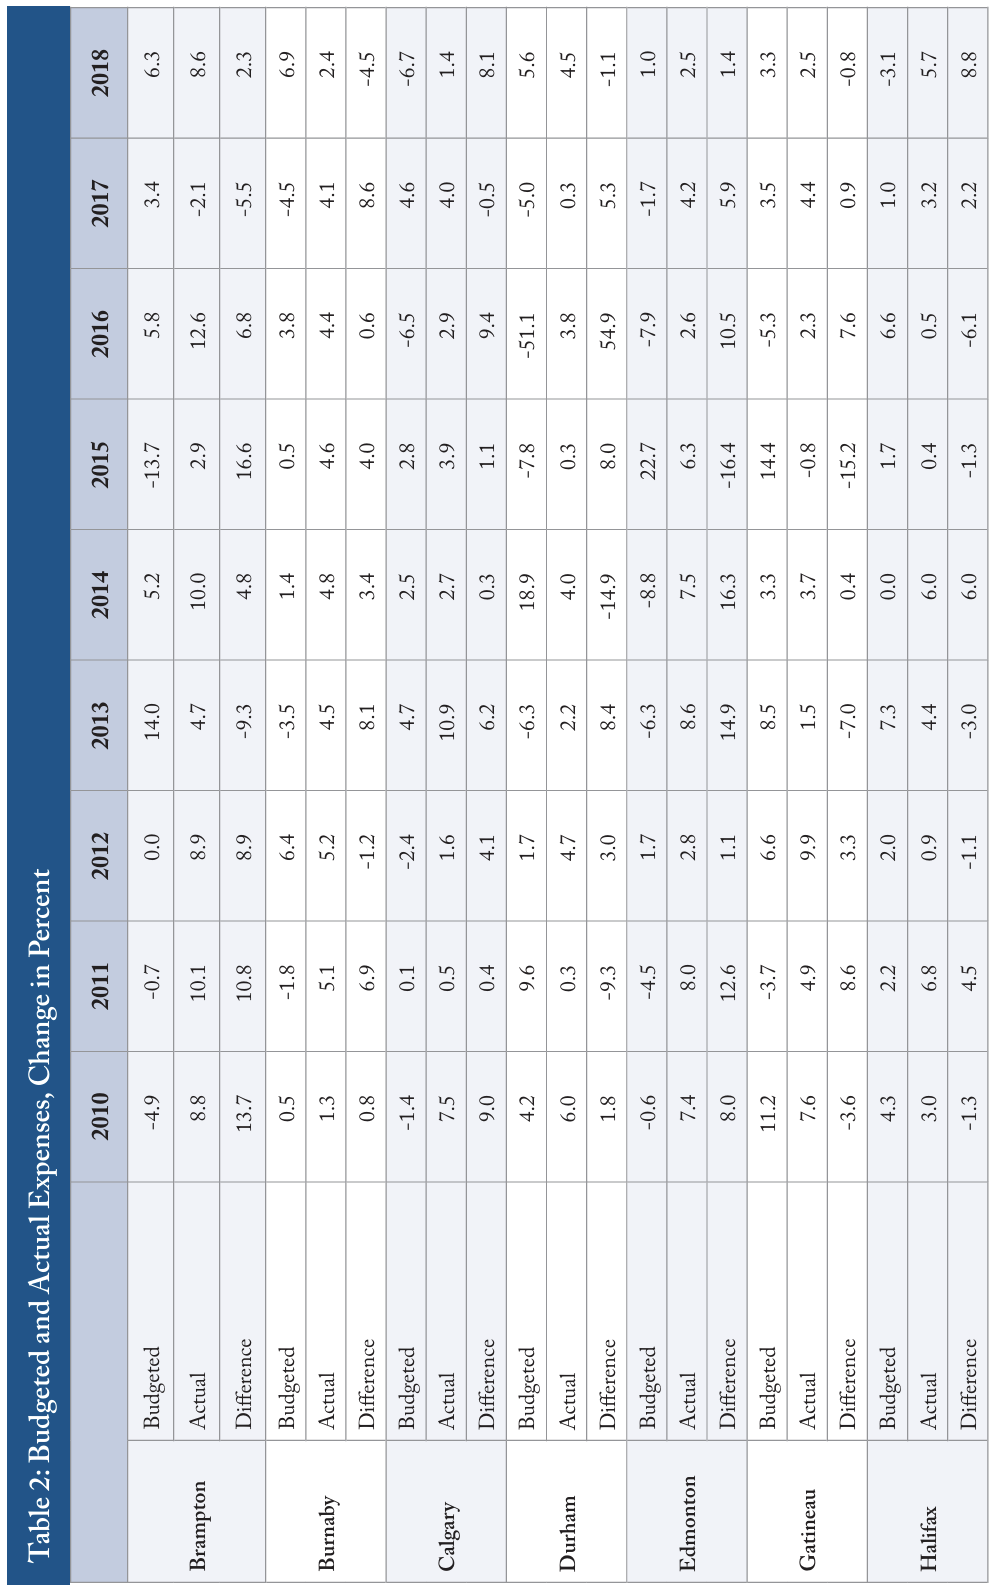
Comparing numbers from budgets and financial statements in dollars would be straightforward for a given city in a given year. But our cities are different in size and have grown over time. So we focus on year-over-year percentage changes. We look at percent increases or decreases from the previous year as projected in the budget documents, and the comparable percent increases or decreases from the previous year shown in the financial statements.33 To describe in more detail, we divide the difference between the current-year spending anticipated in a budget and the prior-year spending in the same document by the prior-year spending to get a percentage change. We do the same to get a percentage change from the expense figures in the financial statements. We are thus using restated numbers for preceding years when budgets or financial statements contain restated numbers. For cities that do not include their previous year’s projected capital outlays in their budgets, we presume our reader is motivated enough to refer to the capital outlays in the previous year’s budget in order to make the comparison.
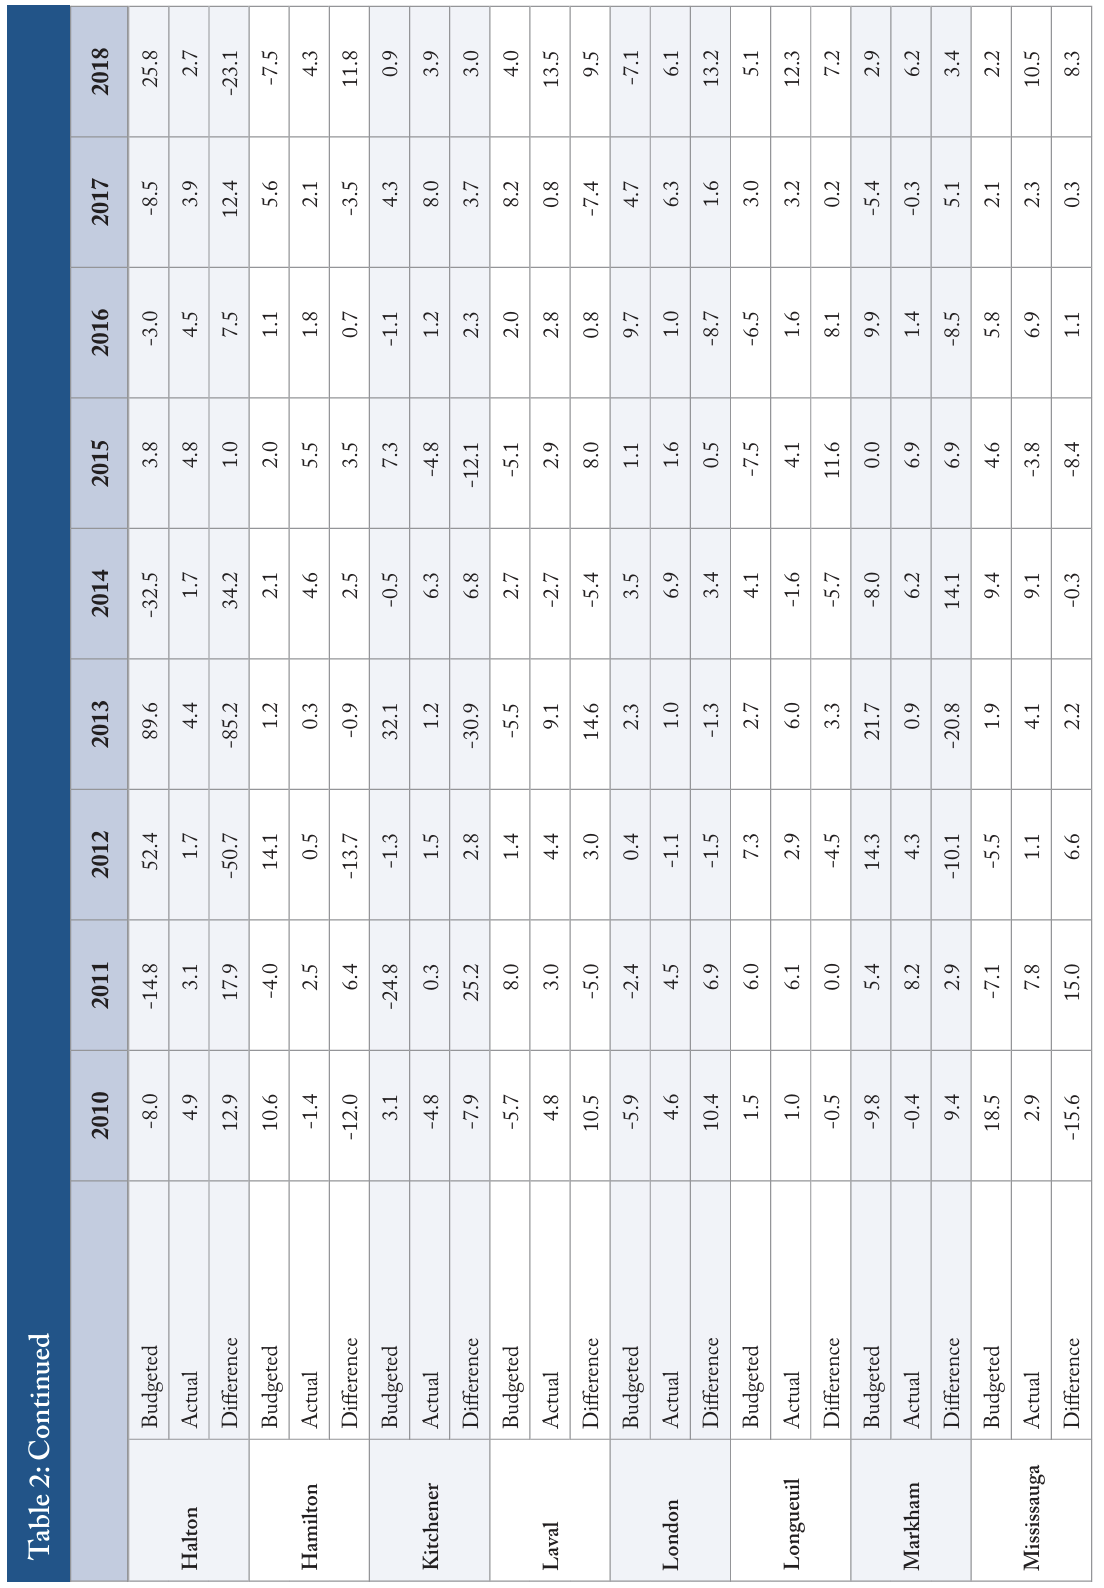
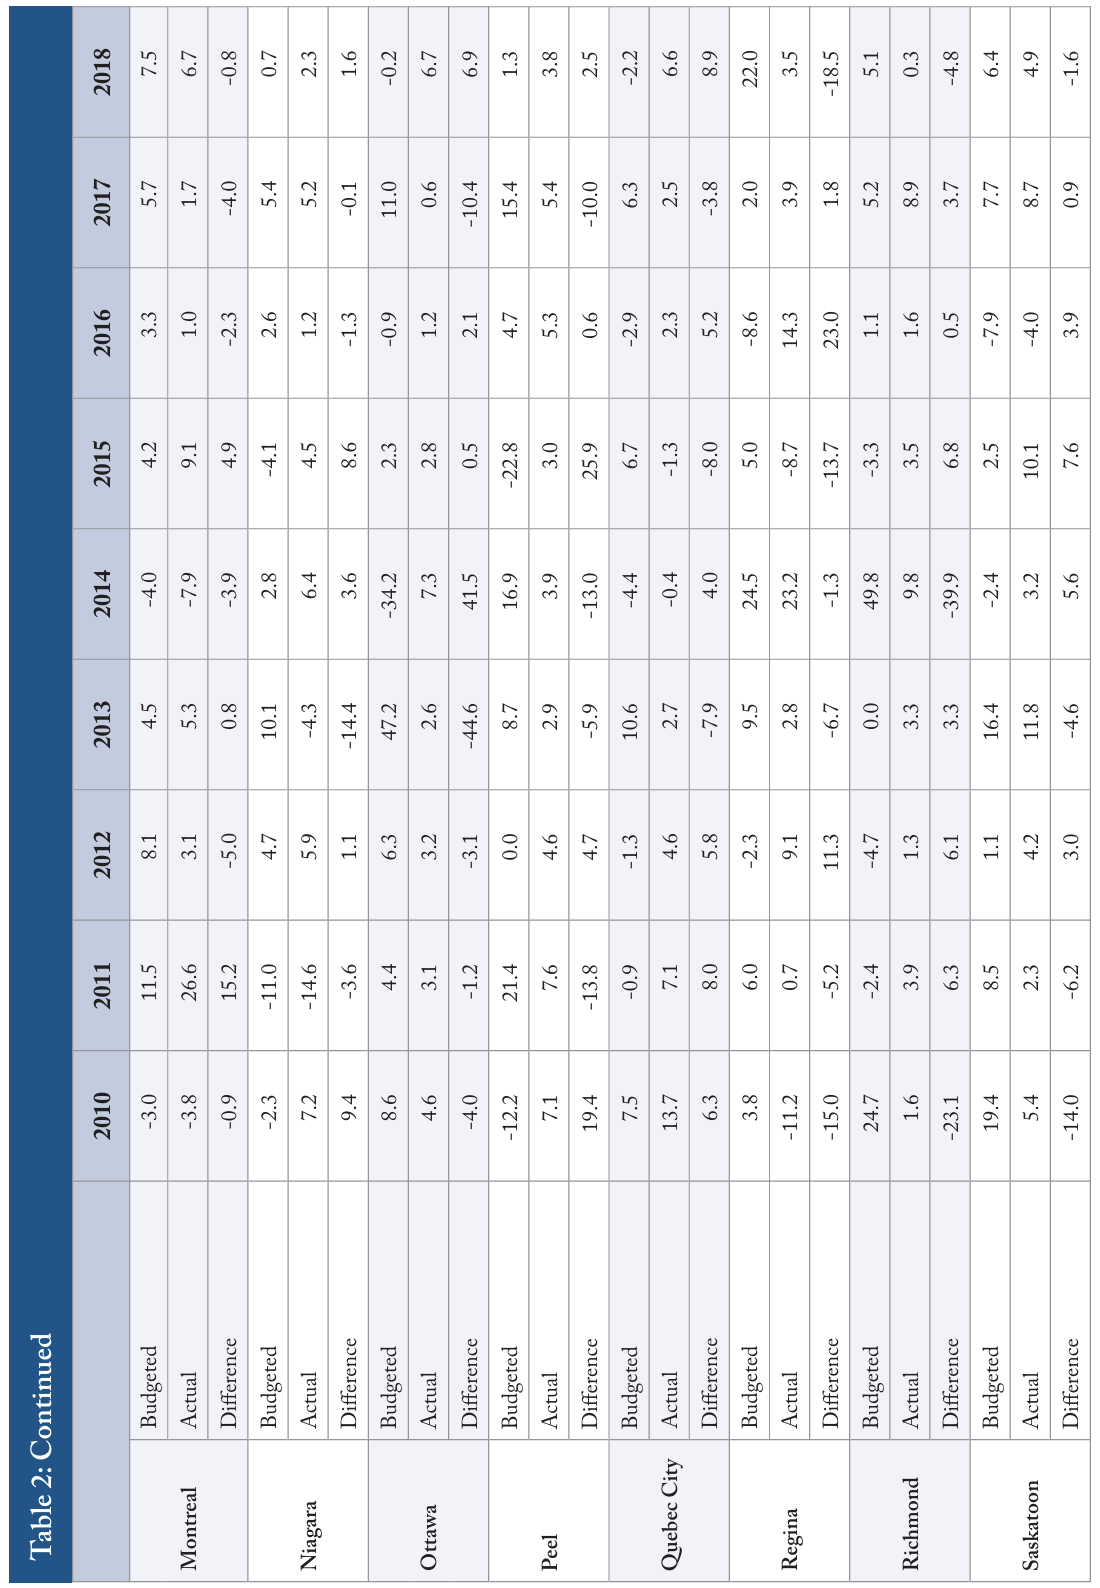
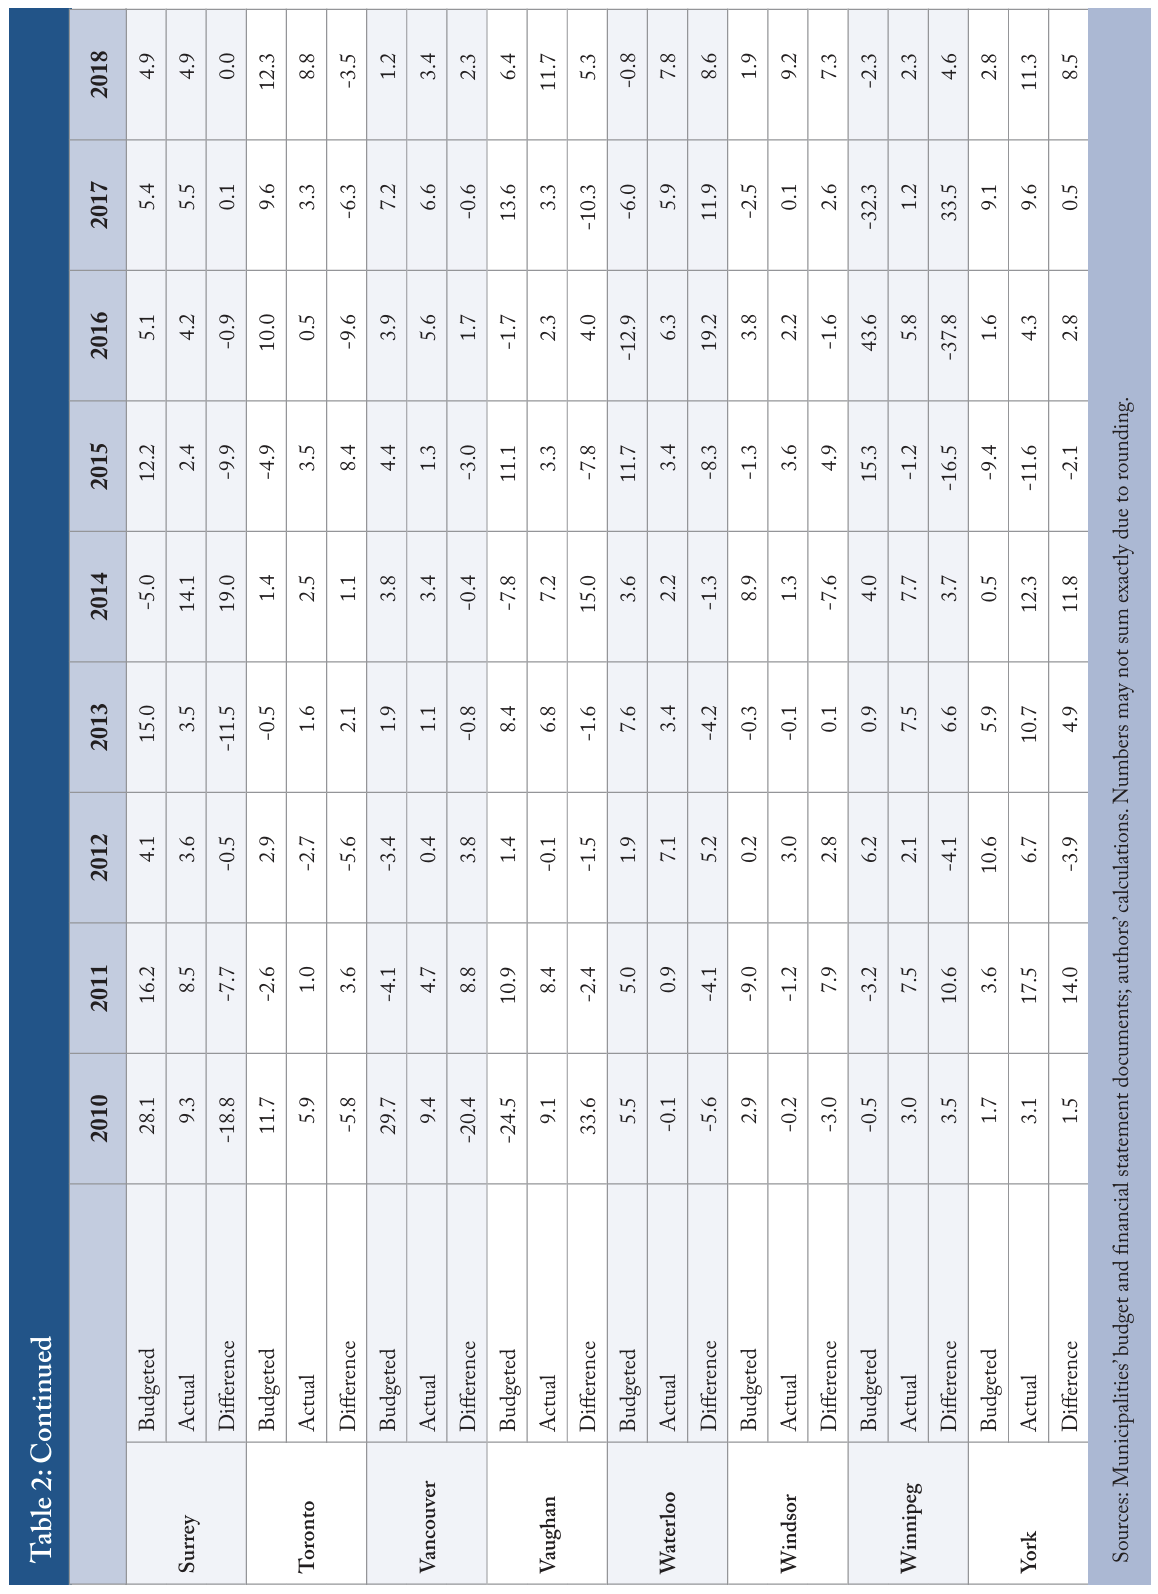
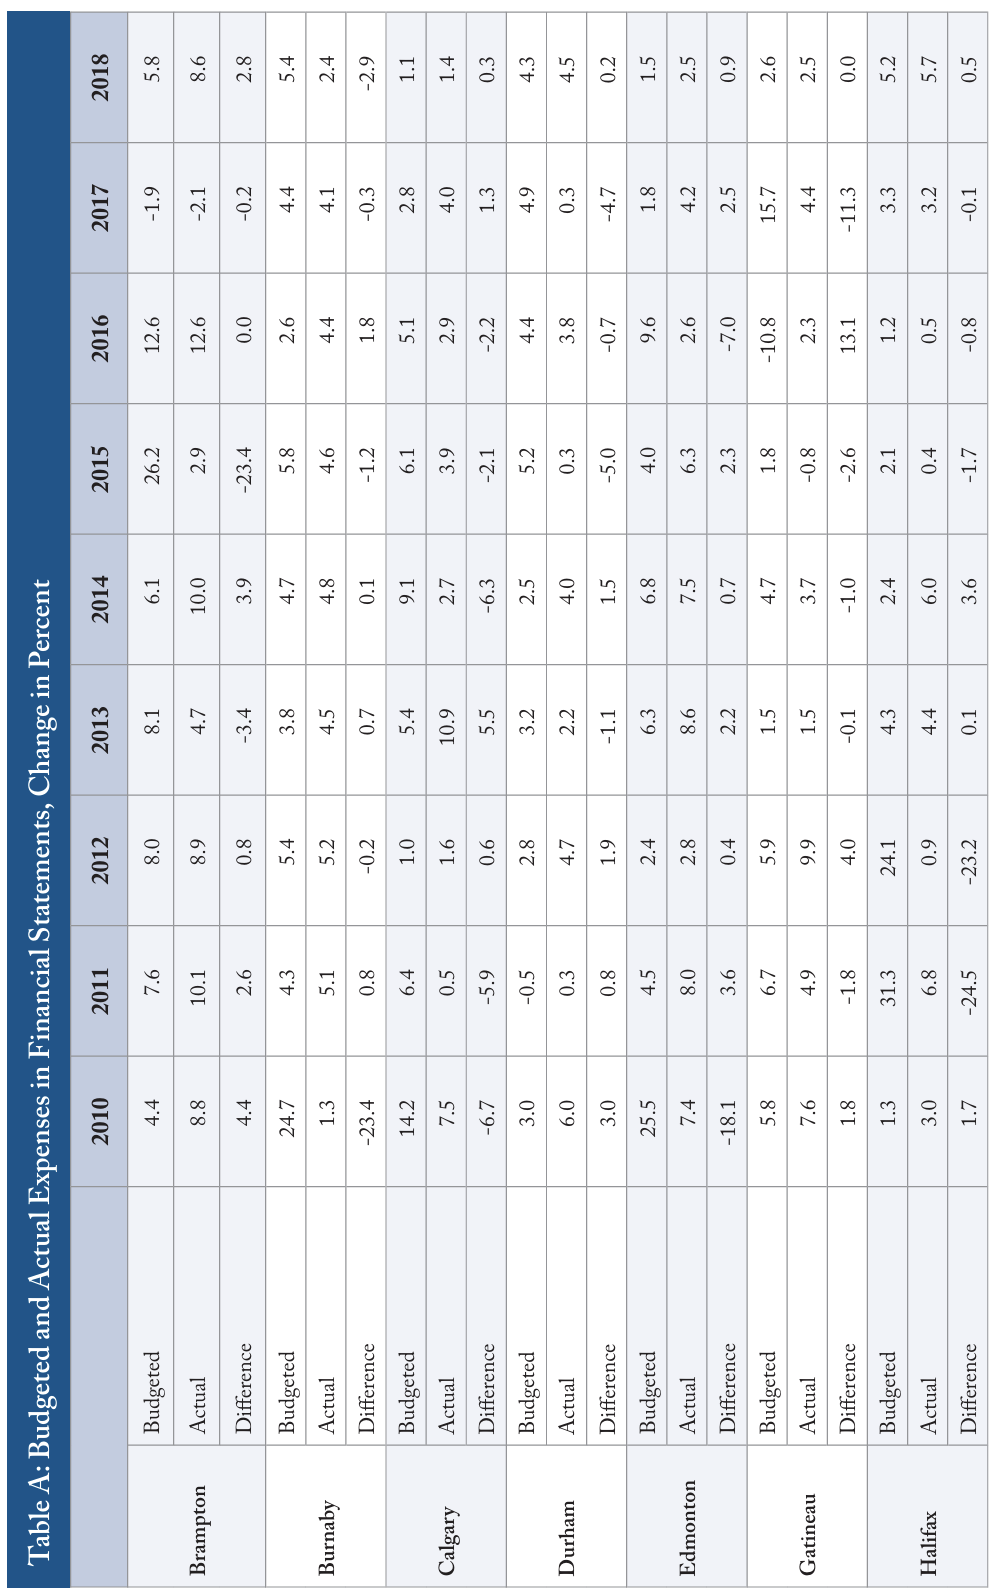
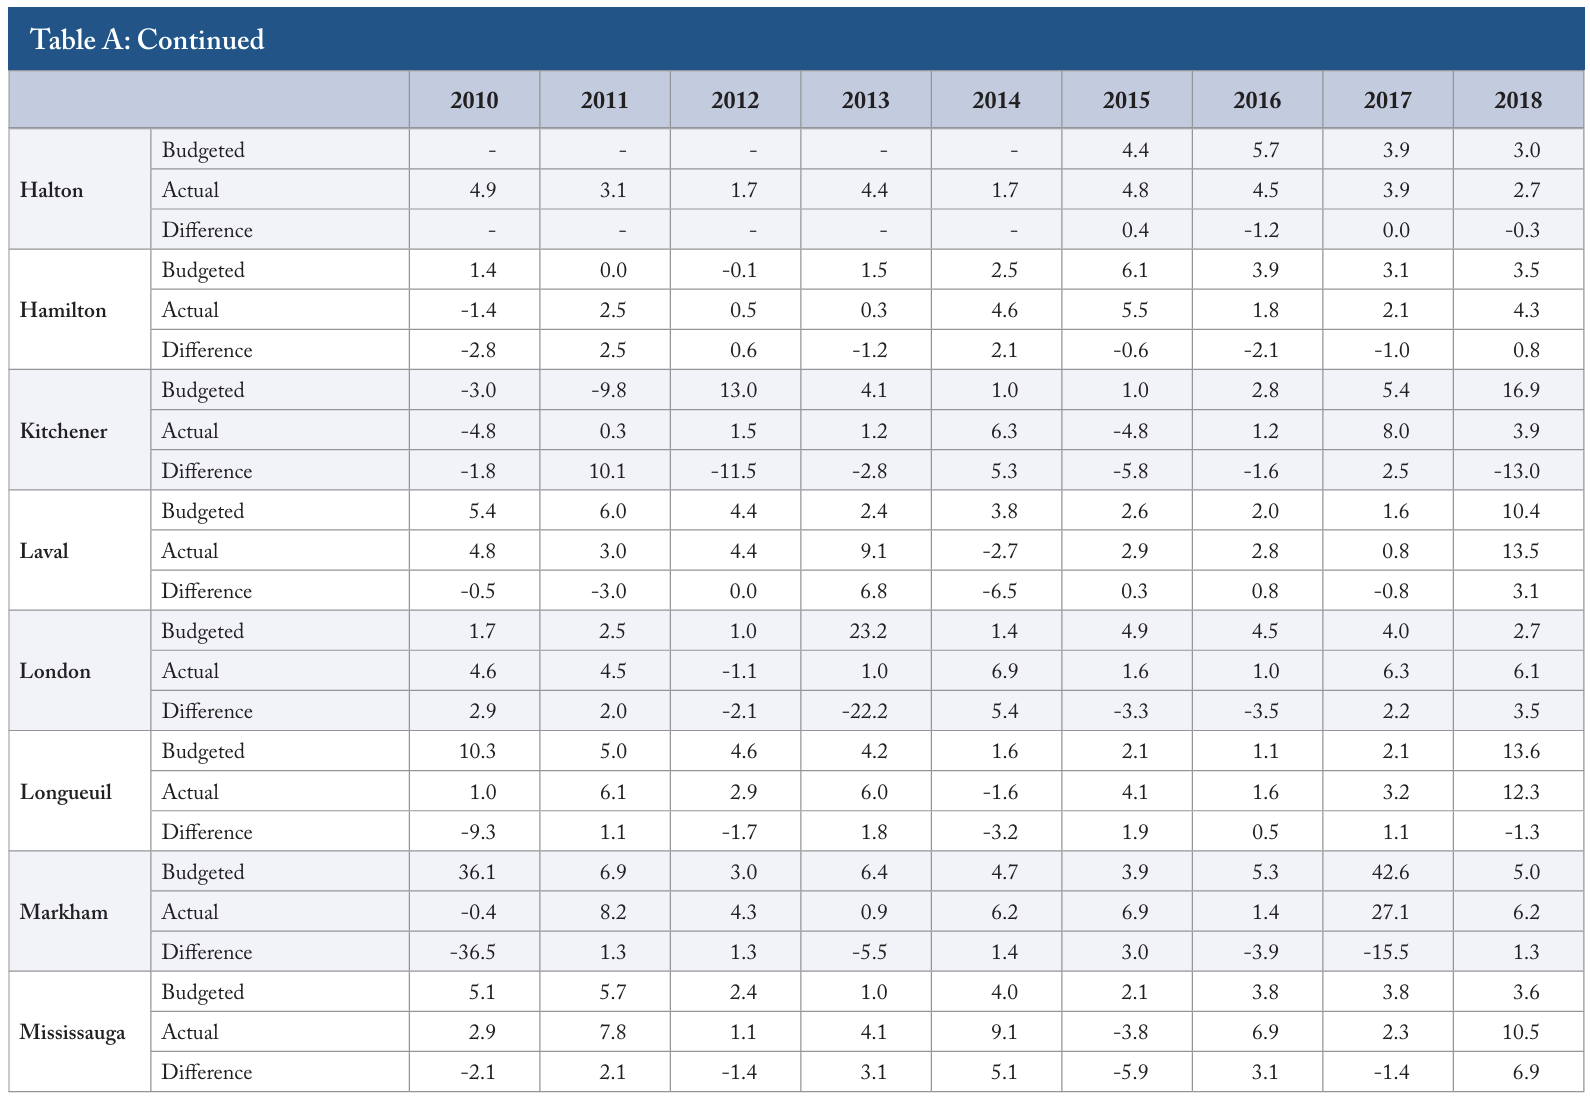
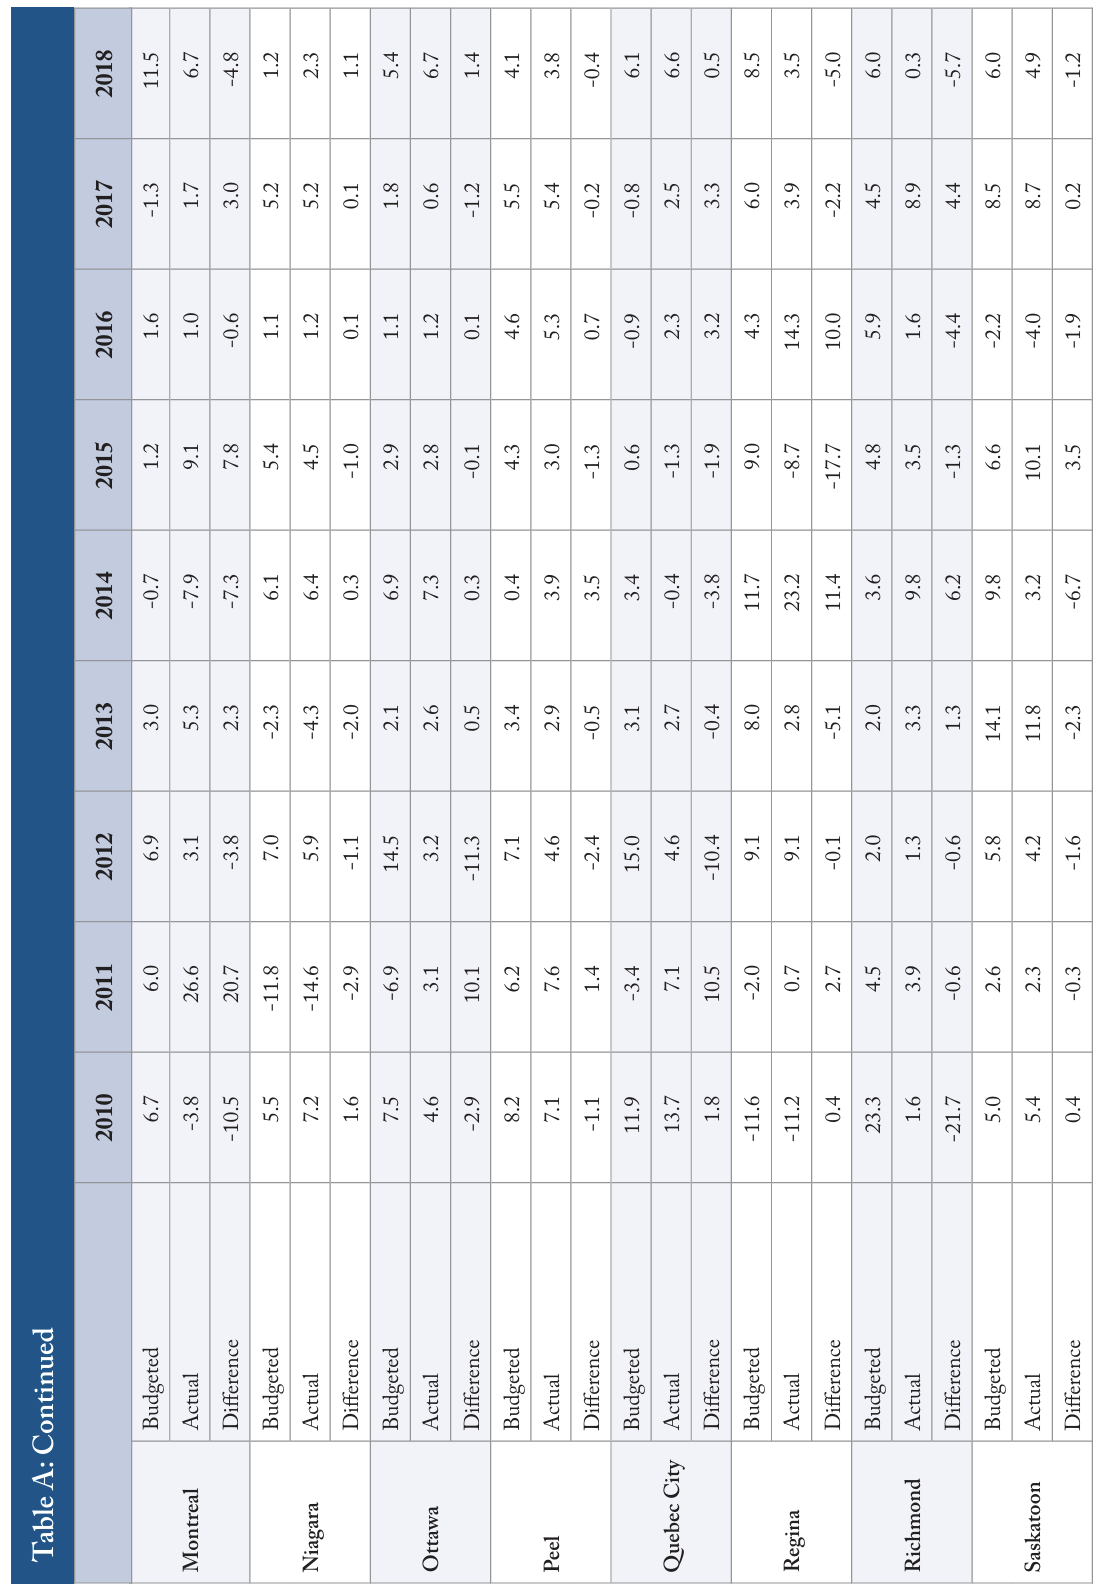
The annual results from our investigation for each of the municipalities appear in Table 2. For each city, projected changes in spending expenses – expenses on a PSAS basis if the budget presents such numbers; operating and capital added together otherwise – in each year’s budget are in the first row. Actual changes in expenses in the financial statements are in the second row. The differences between them are in the third row.
Using percentage changes not only facilitates comparisons of cities of different sizes and across time, it also reduces distortions arising from the differences between cash-based budgets and PSAS-consistent financial statements. Cash outlays for capital typically exceed amortization expenses. So the user who adds total spending in a city’s operating budget to total spending in the city’s capital budget will typically get a total that is larger than a PSAS-consistent expense would be. Cities that net fee-supported activities out of their operating budgets lower their spending totals. So the user of those numbers will typically get a number that is smaller than a PSAS-consistent consolidated expense will be. Expressing projected and actual changes in expenses in percentage terms reduces these distortions, which means our look at the reliability of budget projections produces less extreme and unflattering results than comparisons in dollars would. It does not eliminate them however: in the following section, we estimate how important the accounting differences are as contributors to the gaps between budgets and results.
Reliability of Expense Projections
Our key measure of inaccuracy is the average difference between projected and actual changes, regardless of the direction of the difference. Governments that missed by smaller amounts have lower average differences – a better result. Governments that missed by larger amounts have higher average differences – a worse result. We also measure bias, which is the average difference between projected and actual changes. We use this measure to find any persistent tendencies in cities’ over- or under-shooting their projections.
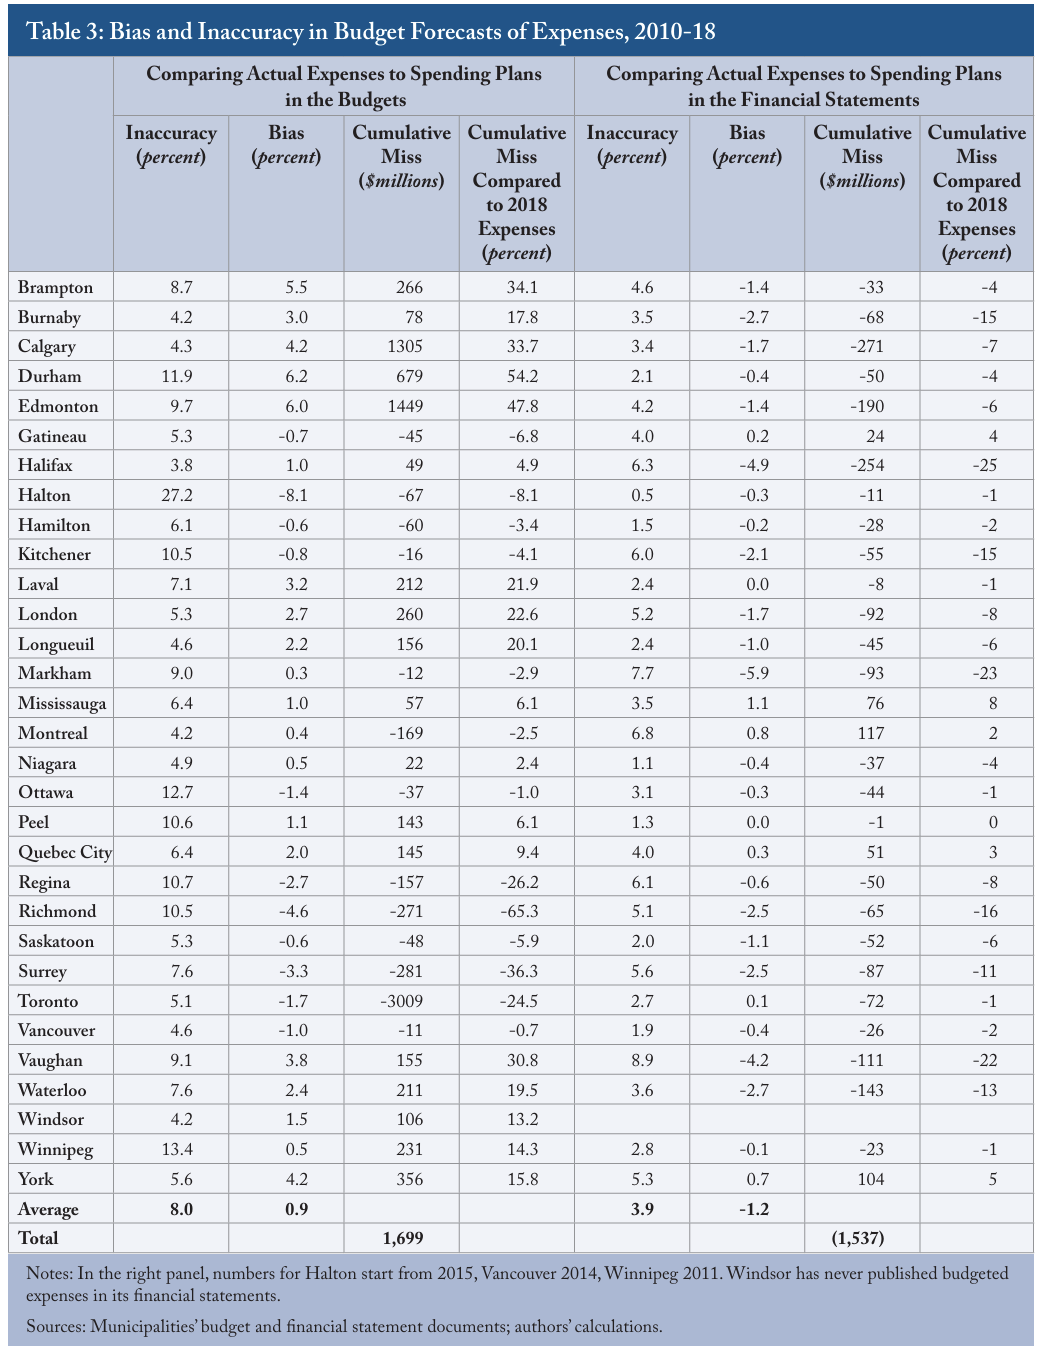
The left panel in Table 3 summarizes the inaccuracy and bias measures of the year-by-year projections and results shown in Table 2. Inaccuracy, or mean absolute error (regardless of the direction of the miss), is in the first column, and bias, or mean error, is in the second column. The third column shows the cumulative amounts by which cities missed their budget projections over the entire period, and the fourth column shows that amount as a percentage of 2018 expenses.
Looking at inaccuracy, our user would conclude that, on average, cities missed their targets one way or another by 8 percent. No household or business or not-for-profit hits its budget targets exactly, but this is an unimpressive number.44 To provide a sense of scale, Canada’s senior governments had an average inaccuracy score of 3.8 percent (Robson and Omran 2019b). It might lead our user to pay less attention to her or his city’s budgets in the future, on the grounds that they are unreliable guides to what will actually happen.55 Most cities’ bias measures are small compared to their inaccuracy measures – on average for all the cities, the bias measure is 0.9 percent, dwarfed by the 8.0 percent inaccuracy measure – which makes it hard to detect any signal or trends amid the noise.
That would be an unfortunate result. There are many reasons why cities might miss their budget targets, some benign, others less so. Fast-growing cities with larger capital projects are more exposed to problems with execution. Weather-related expenses such as snow removal, fire-fighting and floods vary from year to year. Cities might deliberately make misleading projections – overconservative revenue forecasts for example. But a non-expert user will not be able to distinguish between good and bad reasons for missing targets.
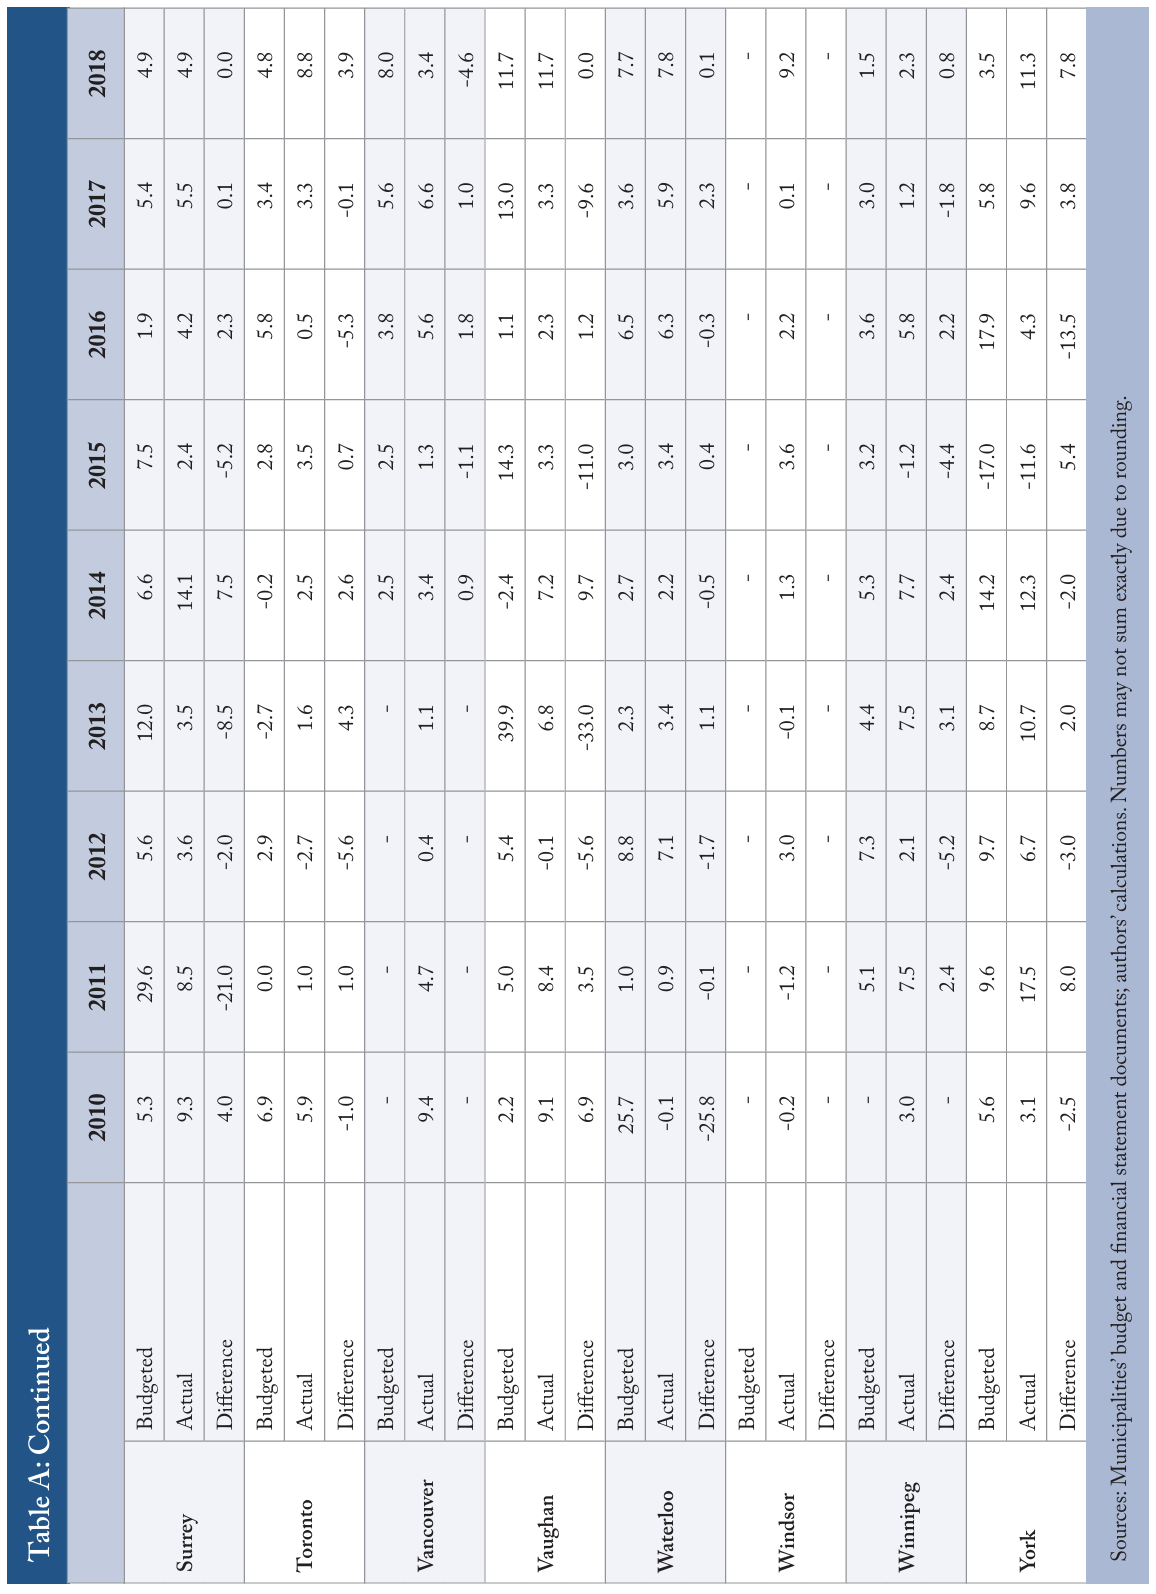
The inconsistent accounting is a formidable obstacle to understanding, most importantly because cash outlays for capital projects are so large and lumpy. What might our user have concluded if municipal budgets had presented PSAS-consistent numbers? We do not know for sure what every city would have presented in its budget every year, but we have a good proxy for what most cities would have shown, because most cities’ year-end financial statements show budget numbers that are on the same PSAS-consistent accounting basis as their results. (The Appendix table shows what Table 2 would look like using these numbers). If our user had used these budget numbers in her comparison, she would have reached conclusions summarized in the right panel of Table 3. The inaccuracy measure, the average gap between plans and results across all cities, falls by about half, from 8.0 to 3.9 percent.
Some cities that registered wildly high inaccuracy scores using the published budget numbers at the beginning of the year register impressively low ones using the restated numbers at year-end. Halton, for example, has an inaccuracy score of more than 27 percent on the basis of its published budget numbers, and a score of less than 1 percent on the basis of its restated numbers. If our numerate, motivated, but non-expert user had access to the PSAS-consistent budget plans at the beginning of the year, she or he would have been able to better assess the city’s plans and hold it accountable as the year unfolded, and would have emerged with greater confidence in its fiscal stewardship.
The bias measures calculated on the basis of the restated numbers are not large compared to the inaccuracy measures. Standard statistical measures, however, would say that the average number of -1.2 percent, indicating that cities tended to undershoot their planned expenses, is statistically significant. This tendency to undershoot is also economically meaningful: the cumulative amount of these annual undershoots over the nine years comes to $1.5 billion.66 Comparing each year’s actual change to the same year’s budgeted change effectively resets the meter every year, so it is fair to treat these misses as cumulative, with each year’s surprise adding to the surprises that accumulated in previous years. These numbers do not tell us why cities tended to undershoot their spending plans. What we can say with confidence is that most of their councillors and voters do not know it happend.
We emphasize that cities that presented PSASconsistent expense figures in their recent budgets – those with a 2 in Table 1 – may show different numbers in the Appendix table than in Table 2, and will have different bias and inaccuracy scores in the left and right panels of Table 3. None of these cities presented PSAS-consistent expense figures in their budgets over the entire nine-year period. Moreover, the restated budget numbers in the yearend financial statements are proxies for what might have appeared in the budget, not necessarily exact replications of it, since the restated budget numbers may include in-year adjustments that would not have been in the beginning-of-year projections.
Measuring Gaps between Budgeted and Actual Bottom Lines
Turning to the bottom line, we compare what a motivated and numerate, but non-expert, reader of a municipal budget would have anticipated for 2018, and the result that municipality reported after the end of that year.
For municipalities that presented PSASconsistent numbers in their 2018 budgets, the comparison is straightforward. In the more common case of municipalities that did not present a PSAS-consisted budget, we judge, consistent with the discussion in the previous section, that most readers of budgets and listeners to budget debates would understand that the city was aiming for a balanced budget: a bottom line of zero. Our measure of the difference between the budget and the result for those cities is therefore simply the surplus reported in the financial statements. Similar to expenses, this difference between the city’s projected bottom line that our user would calculate from the budget and the actual bottom line is exaggerated by the accounting inconsistencies between the two documents. So here as well we use the budgeted bottom line as restated on a PSASconsistent basis in the financial statements as a proxy. This allows us to estimate the contribution of the accounting inconsistencies to the discrepancies between what our user would expect and the outcomes.
Reliability of Bottom-line Projections
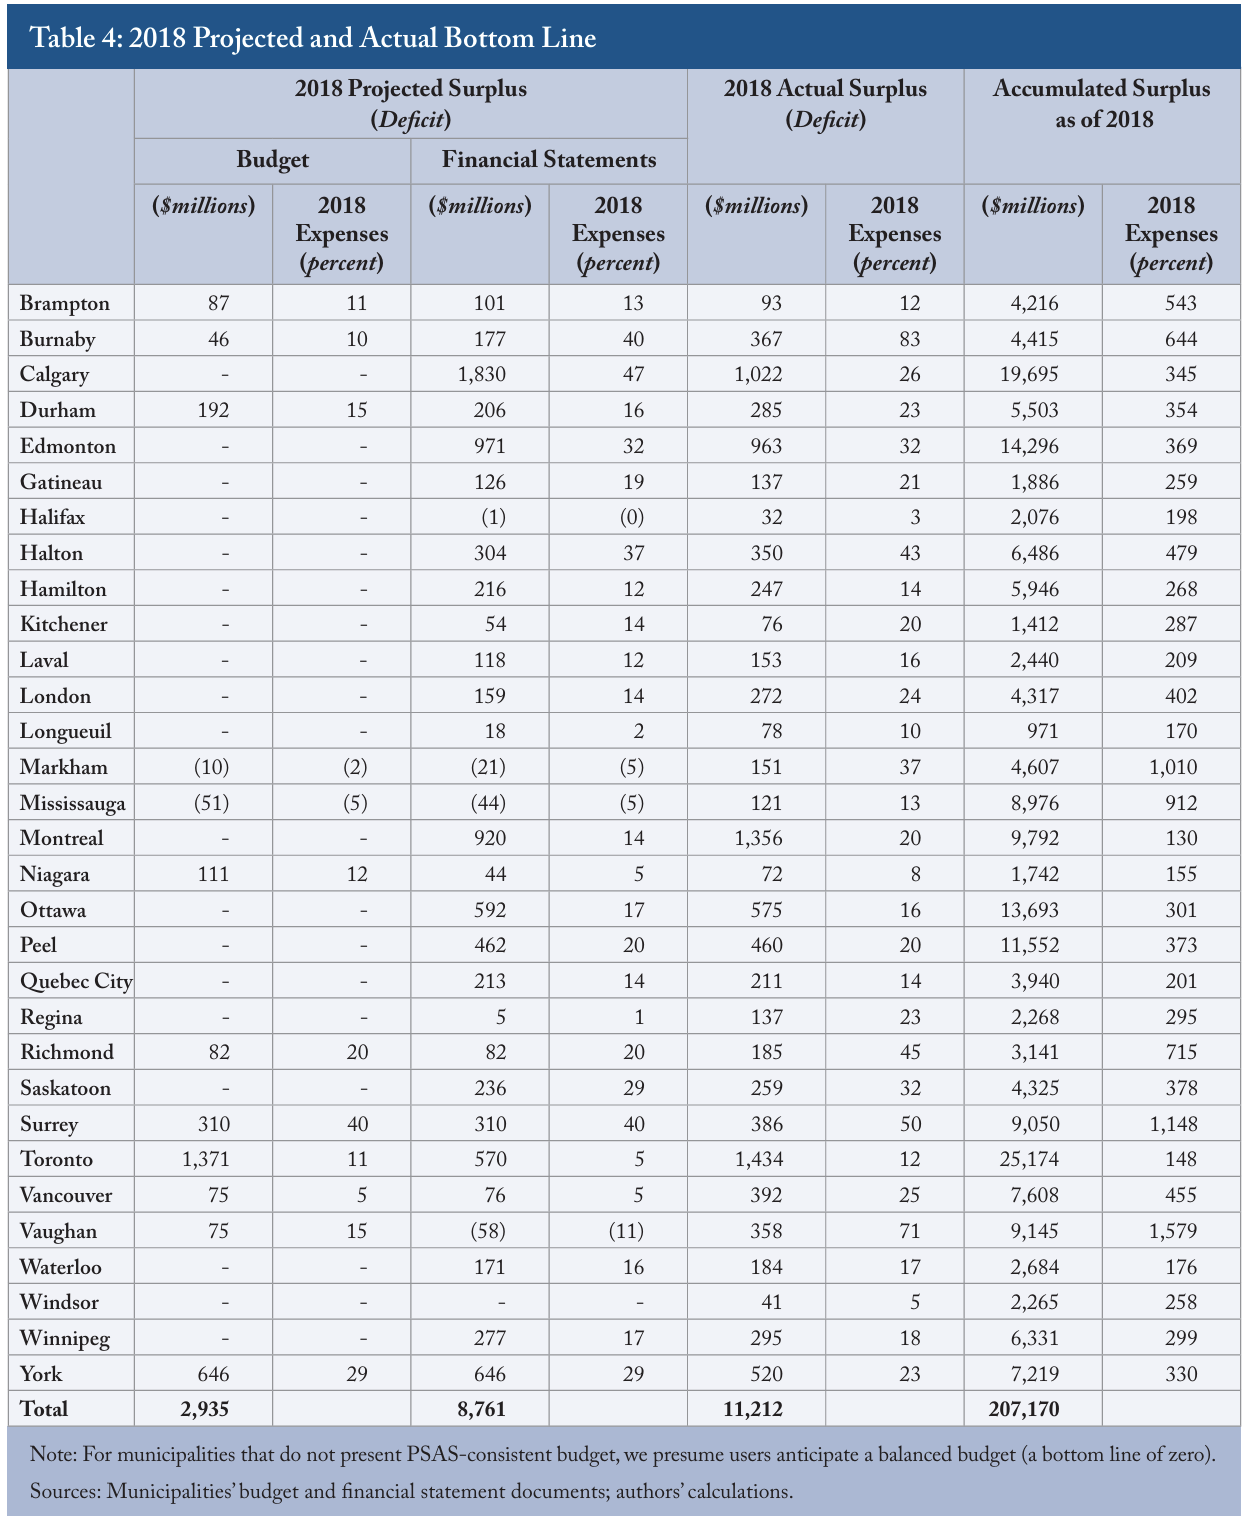
Table 4 shows how this comparison would have worked out in 2018. The first panel shows the municipalities’ 2018 projected bottom lines, both as our user would have understood them from budgets and as they appeared in the restated budget numbers in the municipalities’ 2018 financial statements. For the municipalities that did not present PSAS-consistent budget numbers in their budgets, the table shows a dash – a null quantity reflecting our assumption that the engaged nonexpert expects a balanced budget. The middle panel shows the results for 2018 in each municipality’s financial statements. The right panel shows each municipality’s accumulated surplus at the end of 2018, also from its 2018 financial statements. The Table shows these numbers in dollar terms and as percentages of 2018 expenses, to facilitate comparison across cities.
These results would also surprise our user – in fact, may surprise most readers of this report. All 31 municipalities reported surpluses in 2018. These surpluses totalled $11 billion – an equally weighted average of 25 percent of the municipalities’ 2018 expenses. This is a shockingly high amount when compared to the $3 billion in projected surpluses our user would have calculated from the budget documents. Instead, if municipal budgets had presented PSAS-consistent numbers, our user would have calculated almost $9 billion in projected surpluses, making the actual result of $11 billion in surpluses far less shocking.
The combined accumulated surpluses of all 31 municipalities at the end of 2018 amounted to $207 billion. It is good that municipalities have positive net worth: it means that Canadians can have higher confidence in their capacity to deliver services than would be the case if they had negative net worth, like too many senior governments. But the contrast between what these municipalities’ budgets would have led councillors and voters to expect in 2018 and the actual result for that year would also be true of prior years, when even fewer cities presented PSASconsistent bottom lines in their budgets. So it is fair to say that this positive net worth was not planned: the fact that it exists at all would come as news to almost anyone who looks at municipal budgets.
Better Municipal Fiscal Accountability in Canada: Why and How
To summarize to this point, we note that the budgets of most of Canada’s major cities are not very helpful for a non-expert user trying to anticipate what a city’s end-of-year financial statements will show – both for annual expenses, and for the bottom line. We close with some observations about why this matters, and what to do about it.
Consequences of Misleading Budget Projections
As we comment in a companion report that grades the quality of the information in municipal budgets and financial reports (Robson and Omran 2019c), the problems councillors have understanding the consequences of their budget votes likely have real-world consequences. In particular, pressure to balance operating budgets and finance large capital outlays separately probably leads cities to delay some capital projects they would otherwise execute more quickly, and to rely heavily on upfront charges to finance the capital projects they do undertake.
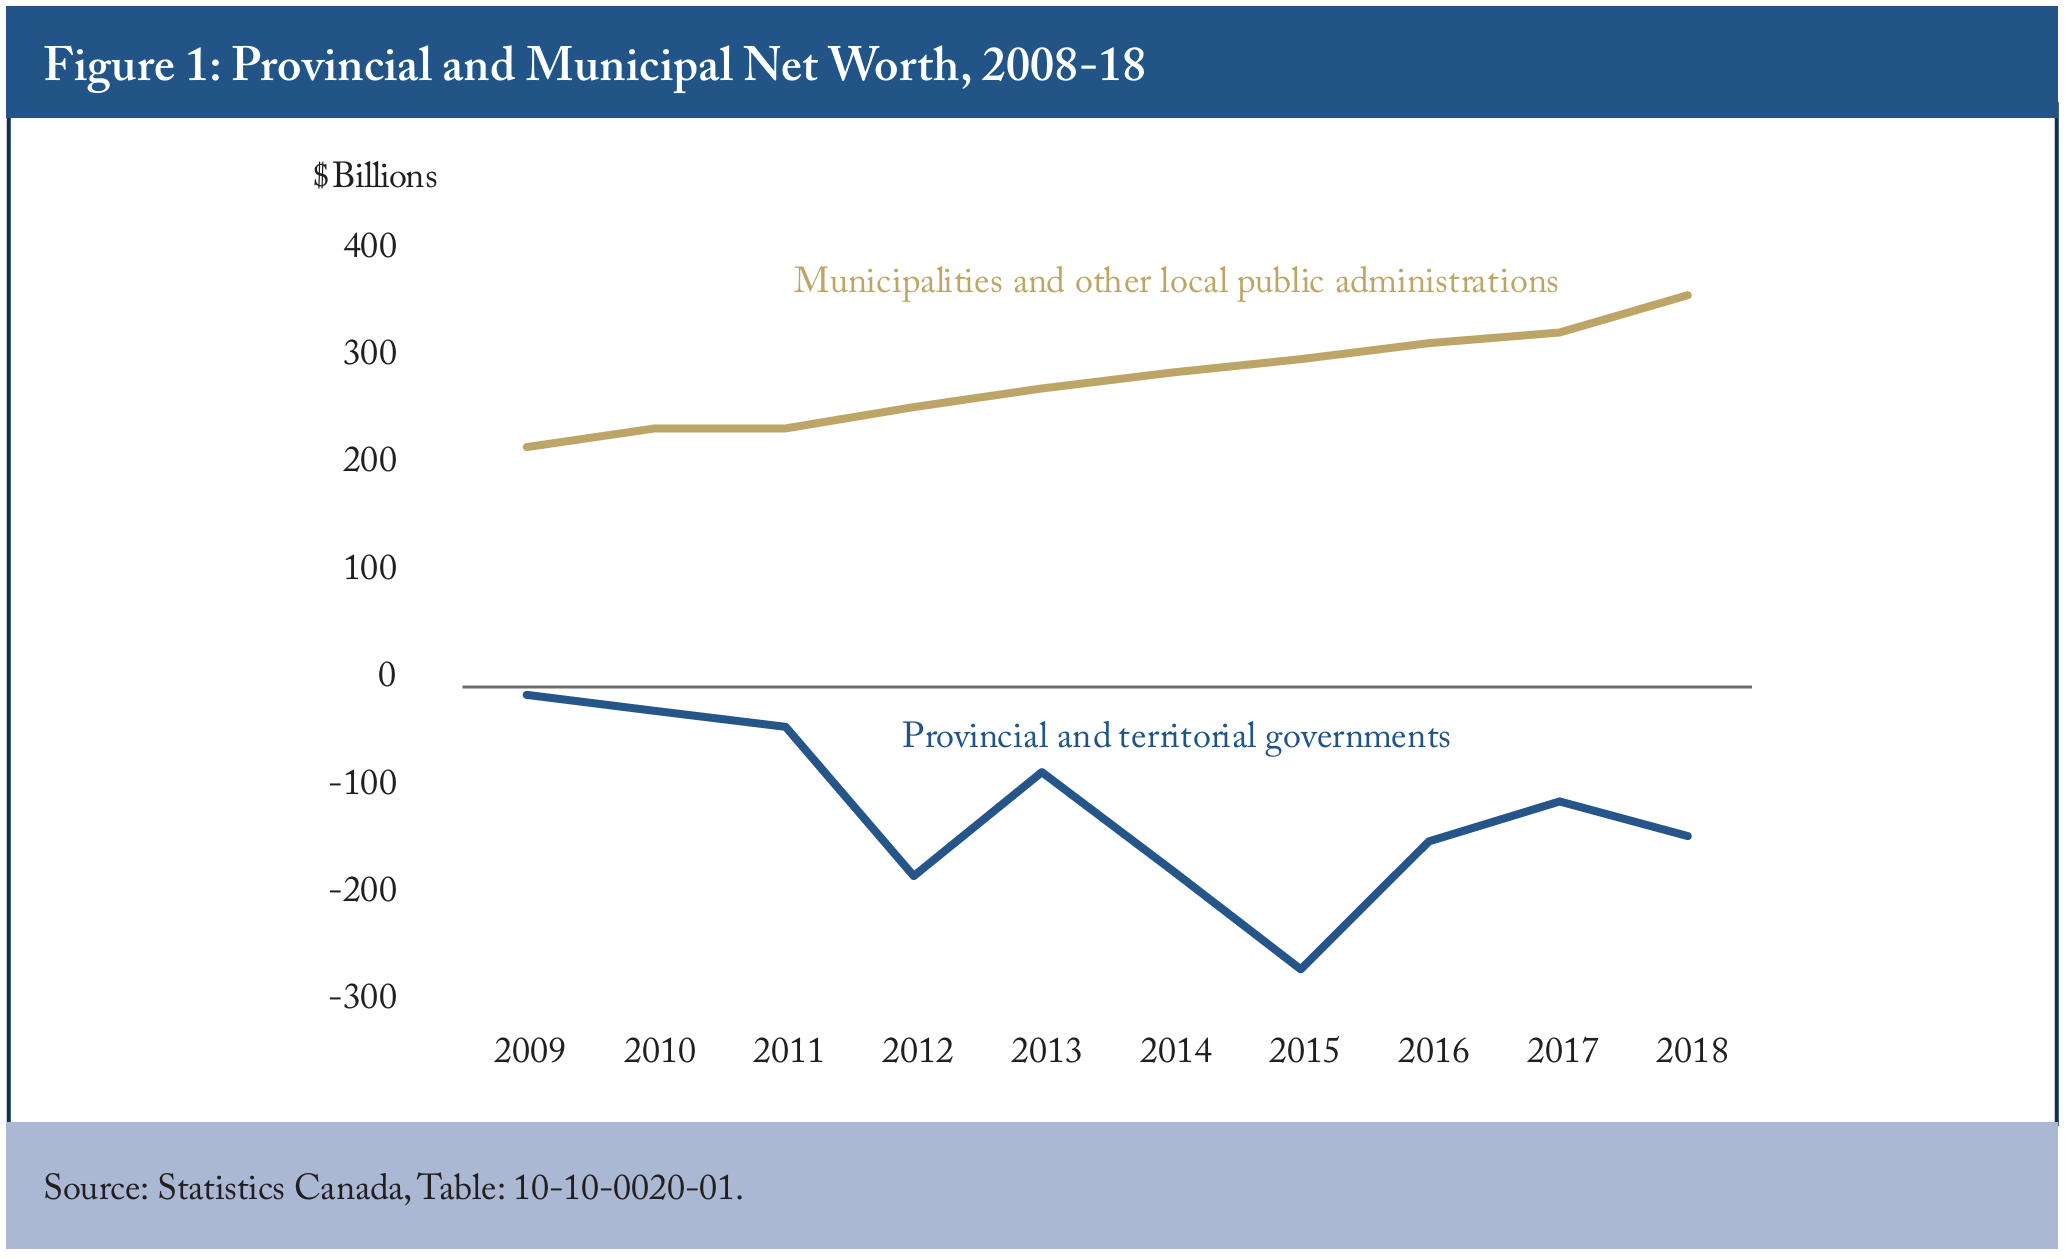
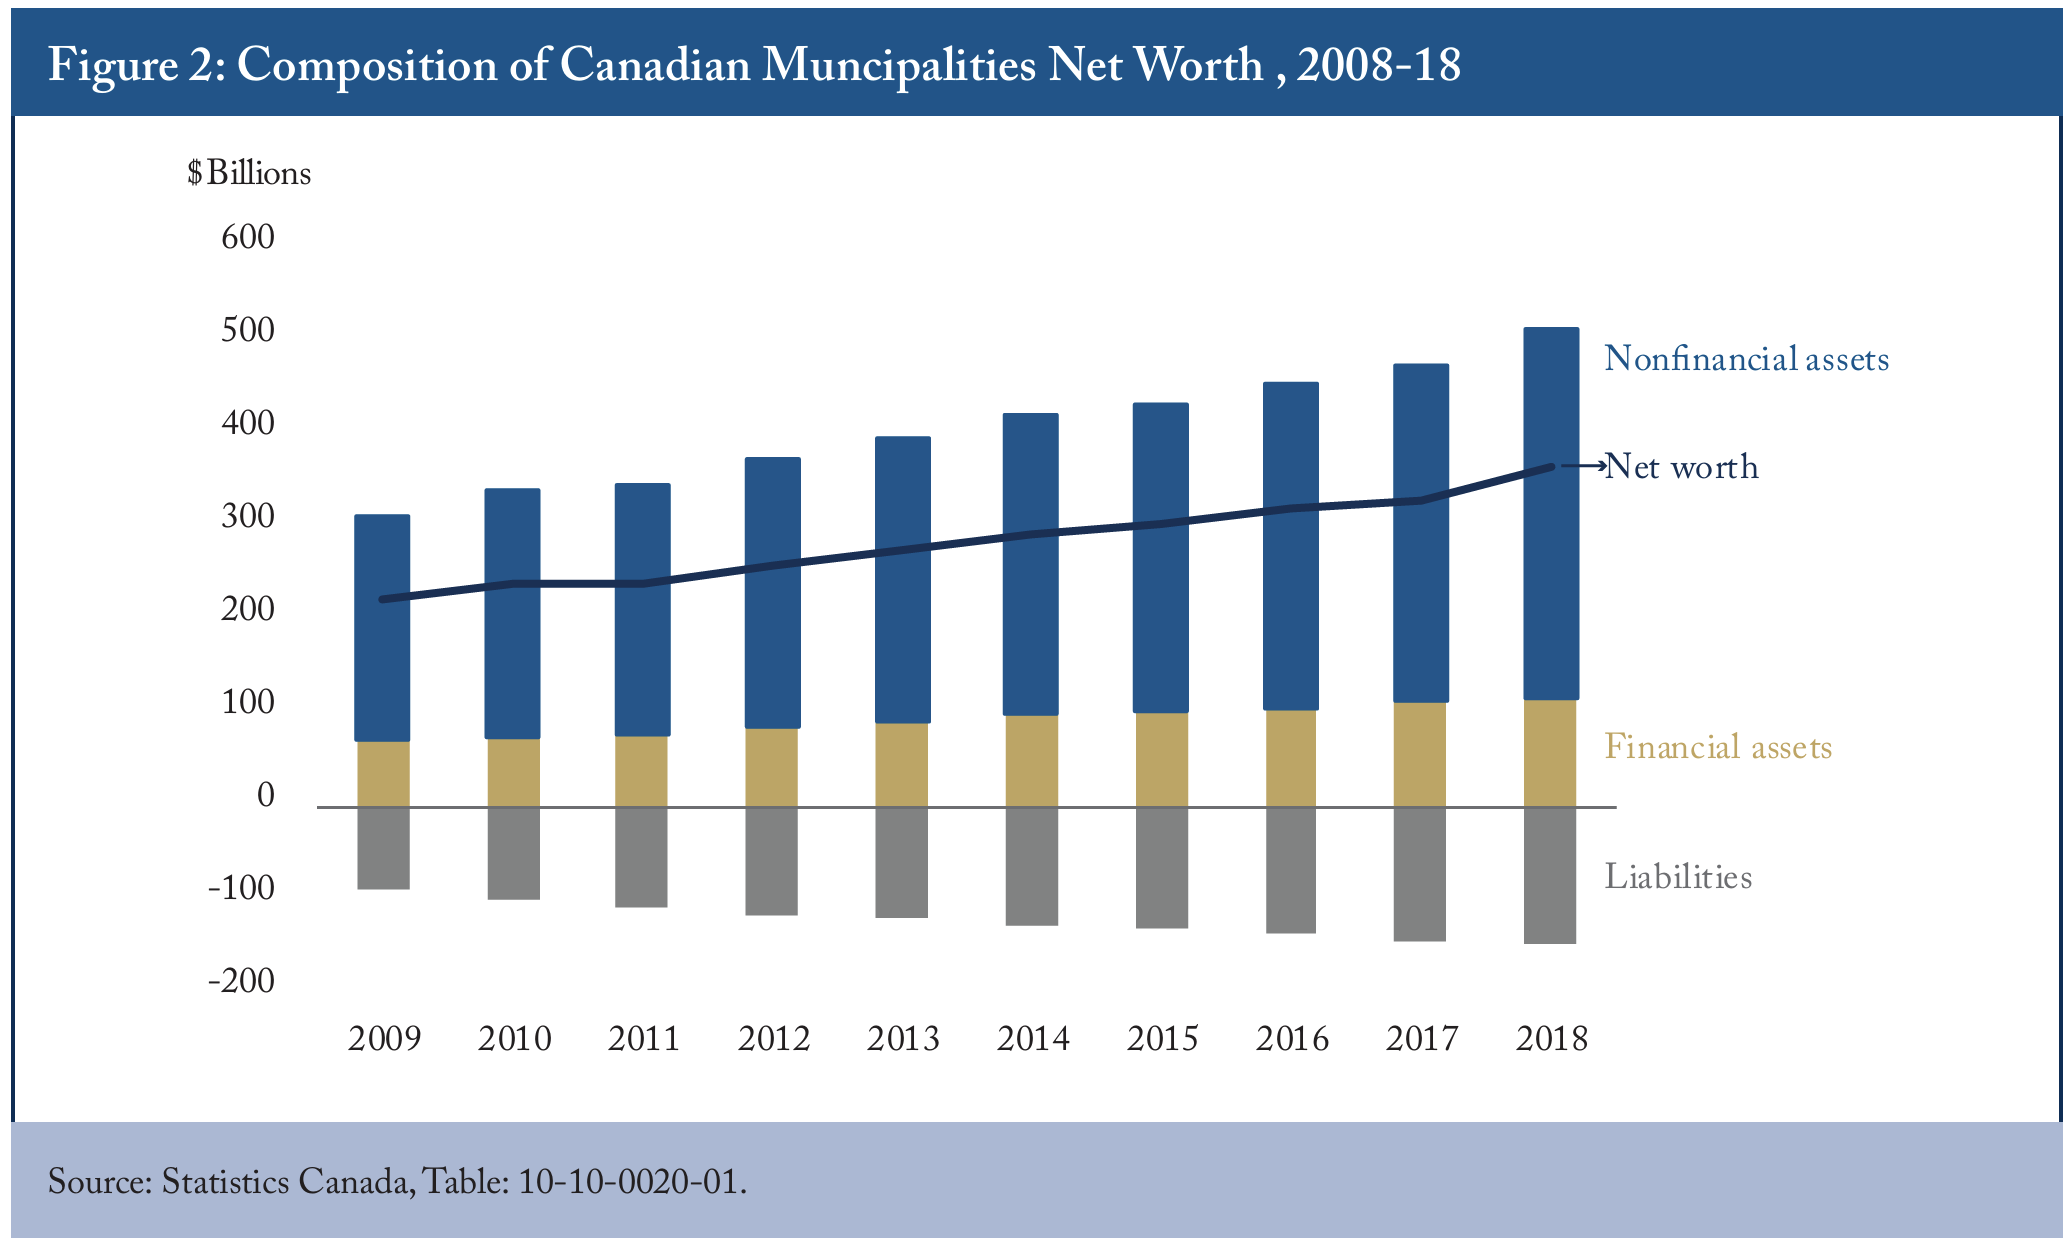
These tendencies would help explain the largerthan-expected surpluses just discussed. Statistics Canada’s compilation of municipal government assets and liabilities tells a suggestive story in this regard. Canadian cities – in sharp contrast to Canada’s federal and provincial governments – not only have much larger positive net worth than is commonly understood (Figure 1), but they have substantial holdings of financial assets (Figure 2). To repeat, it is nice that cities have positive net worth. But the fact that they held more than $117 billion in financial assets at the end of 2018 suggests that they could have invested more in infrastructure and/or collected less revenue.
Then there is the higher-level concern: that the disconnect between budget projections and year-end results in so many cities discourages constructive engagement in the budget process. At worst, it may lead taxpayers, voters and commentators to conclude that city councils and staff are not giving them reliable information, and that the city’s finances are out of control. Disengagement and cynicism undermine democracy, and will not help Canadians get better services at reasonable cost from their local governments.
How to Improve Municipal Fiscal Accountability
Improving the usefulness of municipal budgets to elected representatives, voters and other non-experts will require two types of changes.
All municipalities should present their budgets in a manner that is consistent with the way they present their financial results. At the very least, budgets should contain clearly identifiable PSASconsistent information on revenues, expenses, and the bottom line. Only about one-third of the cities we look at provide this information in their budget documents themselves, and many of them do not make it easy to find. Ideally, all cities would publish the same PSAS-consistent information in their budgets that they provide in their financial statements, so that users would be able to see not just how the aggregate figures compare, but what happened component by component, which would promote much better understanding of how cities perform relative to their budget plans.
Provincial regulations impede municipalities from producing PSAS-consistent budgets. Provinces may require their municipalities to have a cash-based capital budget separate from the operating budget, as Alberta does. They may require their municipalities to balance their operating budgets and include transfers to and from reserves, as Ontario does. They may require their municipalities to include debt principal repayments in their spending, as British Columbia does. But nothing prevents cities subject to these constraints from presenting PSAS-consistent budget information as well. They should display it early and prominently enough in their budget documents so that people can readily find it, and confidently identify it.
Second, councillors, ratepayers, and voters should hold municipal governments to account for presenting budget numbers that represent what the government actually plans to do. Even without any improvement in the ability of city officials or councillors to achieve budget targets, PSASconsistent budgets would shrink the gaps between expected and actual expenses, and between the bottom line people infer from typical municipal budget debates and the actual results municipalities achieve. That alone would better equip councillors and others to evaluate budgets, and check how well their city’s actions matched its projections. Consistent numbers would spur requests for other financial reports that are typical in business and among senior governments, such as timely presentation and informative reconciliations. All these changes would hold municipal governments to better account for their budget projections, for their results, and for acting to reduce the gaps between them.
Canada’s Municipalities Can Do Better
With municipal governments playing such major roles in Canadians’ lives, Canadians need better information on how they budget and what they actually do. The results summarized in this report testify to the challenges a user of basic financial documents would encounter in understanding the budget plans of Canada’s major municipalities, and in tracking whether the municipality’s results were consistent with its plans.
To the extent that a numerate but non-expert user can find the key spending numbers in a municipality’s budget and financial statements, that user would probably conclude that the municipality did a terrible job of hitting its spending projections. Our survey of budgets and results from Canada’s most populous municipalities over the past nine years indicates that these cities have missed those projections by 8 percent on average – roughly half of this amount reflecting inconsistent accounting. This user would also probably conclude that the municipal budget debates, which feature warnings about hikes in property taxes and cuts in services, are misleading. Our survey shows that municipalities reported a total of $11 billion in surpluses in 2018, and a staggering total accumulated surplus of $207 billion at the end of that year.
Improving this situation is partly a matter of presenting budgets on the same PSAS-consistent basis as municipal financial statements. It is also a matter of councillors, ratepayers, and voters demanding timely information on interim and final results, so they can compare those results to budget projections and – when circumstances suggest it – demand corrective action.
Fiscal transparency and accountability in Canada have generally improved over the years. Compliance with PSAS is now all but universal in the financial statements of Canada’s federal, provincial and territorial governments, and their budgets are also coming into line. Other elements that help voters hold them to account, such as timely presentation of budgets, financial statements and interim results, are also better than they were. Canada’s municipalities should likewise raise their game. Councillors, ratepayers, and voters should insist on better numbers from their municipalities, and on the improved fiscal accountability the better numbers will make possible.
Appendix
References
Dachis, Benjamin, and William B.P. Robson. 2011. “Holding Canada’s Cities to Account: An Assessment of Municipal Fiscal Management.” Backgrounder 145. Toronto: C.D. Howe Institute. November.
Robson, William B.P., and Farah Omran. 2019a. Show and Tell: Rating the Fiscal Accountability of Canada’s Senior Governments, 2019. Commentary 545. Toronto: C.D. Howe Institute. June.
_____________. 2019b. Big Spenders: Canada’s Senior Governments Have a Bad Budget Habit. Commentary 548. Toronto: C.D. Howe Institute. July.
Robson, William B. P., Benjamin Dachis and Farah Omran. 2019c. From A to F: Grading the Fiscal Transparency of Canada’s Cities, 2019. Commentary 560. Toronto: C.D. Howe Institute. December