






by Alexandre Laurin and Don Drummond
 The pandemic has kicked Canadian government debt to high levels. Federal and provincial budget plans could well see it go higher for decades and even generations.
 - The 2021 federal budget demonstrates the sensitivity and fragility of Canada’s fiscal prospects. In this E-Brief, we explore further this fragility by testing the sensitivity of Canada’s simulated debt burden to changes in key assumptions about the future. Only very slight changes in assumptions of economic growth and interest rates dramatically change the course of the debt burden.
- Our baseline scenario shows the federal debt burden on an upward long-run drift with the debt ratio reaching 60 percent by 2055. Nationally, taking provincial governments into consideration, the combined federal/provincial net debt ratio could reach over 140 percent under our baseline scenario, and almost 100 percent even under the more favourable budget scenario. As such, recent federal and provincial budgets amount to “rolling the dice” on Canada’s future.
- No matter the answers to policy choices about taxes and spending in the years ahead, one thing is clear: this exercise draws out the imperative of raising Canada’s long-term economic growth rate.
 The pandemic has kicked Canadian government debt to high levels. Federal and provincial budget plans could well see it go higher for decades and even generations.
 Federal and provincial budgets released so far in 2021 show the surge in deficits and debt-to-GDP ratios associated with the pandemic. Those budgets offering a longer-term perspective reveal an expectation of only slow, gradual progress in reducing the peak debt burdens.
Ontario’s budget, for example, shows that even under strong economic growth and very tight spending restraint the net debt-to-GDP ratio only declines marginally through 2029/30. The April 19, 2021 federal budget provided a graph showing two possible courses for the federal debt-to-GDP ratio through 2055 – a much longer horizon.1The federal debt concept used in this E-Brief corresponds to the accumulated deficits, the debt concept most often reported by the federal government in its budgetary documents, and generally labelled as the “federal debt.” The point may have been to generate some comfort that the pre-pandemic debt burden can be restored. However, that is not achieved until 2055, 34 years from now.
Further, that result requires assumptions of strong economic growth, only a modest increase in interest rates and no further changes to spending programs or tax cuts. The chart in the budget has a second line with economic growth just 0.2 percentage points per annum weaker that leaves the debt burden some 10 percentage points higher in 2055.
The federal budget demonstrates in a limited way the sensitivity and fragility of Canada’s fiscal prospects. In this E-Brief, we explore further this fragility by testing the sensitivity of Canada’s simulated debt burden to changes in key assumptions about the future. Only very slight changes in assumptions of economic growth and interest rates dramatically change the course of the debt burden. Under quite reasonable assumptions it can easily be shown to rise over time from the current peaks. This rather sombre view is consistent with the recent Spring 2021 Bennett Jones Economic Outlook, which concludes that taking into account current debt levels and budget plans, and reasonable assumptions for growth and interest rates, the federal and national fiscal frameworks are unlikely to be sustainable over the medium term (Bennett Jones 2021).
In particular, our baseline scenario shows the federal debt burden on an upward long-run drift with the debt ratio reaching 60 percent by 2055. Nationally, taking provincial governments into consideration, the combined federal/provincial net debt ratio could reach over 140 percent under our baseline scenario, and almost 100 percent even under the more favourable budget scenario. As such, recent federal and provincial budgets amount to “rolling the dice” on Canada’s future.
High debt levels, worse when they are ever-increasing, present many downsides. For instance, the recent crisis, while extremely severe by all historical measures, is just the latest economic recession. Governments will need fiscal room to deal with the next recession. Stimulus spending tends to be less effective for governments entering a recession already in bad fiscal shape. Also, the size of the debt burden is itself a risk factor because of its influence on interest-rate movements. High-debt countries experience larger interest-rate increases in response to unexpected changes in economic conditions and volatility (Lian et al. 2020).2A reasonable estimate of the relationship is that every percentage-point increase in the debt-to-GDP ratio above 60 percent raises interest rates on the debt by two to four basis points (Lester 2021).
It is important to protect government finances and Canadians from the negative fiscal consequences of a reversal of the current environment of interest rates lower than growth rates. If the experience of the 1990s is any indication, debt charges rising faster than growth, accompanied by a high debt level, would be a toxic cocktail for future governments, which would again have to raise taxes and cut spending by multiple GDP points simply to restore investors’ confidence and fiscal stability. And this time it would be much more difficult for the provincial governments to absorb the cost of federal spending cuts because provinces are already facing intense aging-induced cost pressures of their own.
Longer-term fiscal projections are heavily dependent upon spending and tax parameters, to a degree under the control of governments, but also on economic growth and interest rates. For our sensitivity tests we take as given current government spending programs and tax parameters. Then we test the sensitivity of projections to alternative economic growth and interest rate assumptions.
The chart on page 55 of the federal budget (Canada 2021) provides no information on the assumptions. Finance Canada has subsequently revealed that post-2025, the favourable scenario is based upon average growth in nominal GDP of 4.1 percent per annum and a gradual increase in the effective interest rate on debt to 3.3 percent.3Based on the authors’ correspondence with Finance Canada officials. For the less favourable scenario, nominal GDP growth averages 3.9 percent while the interest rate assumption remains the same. Key in these projections is a favourable differential between nominal GDP growth and the interest rate. That imparts a downward thrust to the debt burden. We argue that in theory and in practice until of late, it should not be taken as a given that the growth to interest rate differential will always remain positive.
We constructed a simple model that replicates the federal budget’s long-term debt trajectory (Canada 2021, p.55) when using the Finance Canada assumptions for growth and interest rates.4Through our attempt to replicate Finance Canada’s results, we surmise certain features of the methodology behind the chart on page 55 of the budget. First, it appears that revenues grow with nominal GDP with an elasticity at or very close to one. Second, program spending grows less rapidly than revenues and is less sensitive to changes in nominal GDP; the Canada Health Transfer and Equalization payments (about 18 percent of program spending) are the only spending component explicitly linked to the economy. The debt burden declines further in Finance’s more favourable growth scenario due to a greater positive gap between growth and the effective interest rate on public debt and an improvement in the primary budget balance as revenues increase more than program spending. We then test the robustness of the results to minor changes in the assumptions. A slightly lower growth track with slightly higher interest rates eliminates the positive gap and sends the debt burden projection trending up over time. We believe such assumptions are realistic and the prospects they depict are worthy of policy correction through a combination of less spending and tax increases once the pandemic is decisively behind us. Prospects become even more alarming when we add a perspective on future provincial debt burdens, which shows the critical importance of policies aimed at raising Canada’s long-term economic growth rate.
A Reasonable Long-Run GDP Growth Scenario
We understand5Supra note 3. the two long-term debt-to-GDP scenarios in the federal budget (Canada 2021, p.55) are based on 1.9 and 2.1 percent average real GDP growth per annum over the 2026 to 2055 period, with 2 percent inflation. The current budget long-term projections (post 20256Short-term budget projections from 2021 to 2025 are based on the average of private-sector economists. We adopt the same short-term projections here.) are based on Canada’s average productivity growth since 1970; in other words, Finance Canada is dipping back into the early strong growth period to project forward. Finance is not unique in making these projections, and they are certainly achievable provided the right mix of investments and technology. The forward context is the expectation that technologies such as Artificial Intelligence and Machine Learning will bolster productivity. A few points should be made:
- Canada has not experienced the strong productivity growth of the 1970s for decades so that era may not be relevant for projecting the future.
- Productivity growth has been averaging around 1 percent in recent decades. A 0.2 percentage point increase in growth, if it is through higher productivity, can then be interpreted as a 20 percent shock – a huge adjustment.
- Recent technological advances may raise productivity, but there have been many innovations over recent decades and yet productivity has been stuck at around a 1 percent growth trend.
- The modest growth we have experienced in productivity since 2000 has not come from what most people would think of as innovation; instead it can all be accounted for by increases in the capital stock. Since 2000, there has been no increase in multi-factor productivity (output increases after removing increases in labour and capital inputs).
- Technological advances may raise the level of productivity, but its growth rate would only increase over an adjustment period. The budget assumes the productivity growth rate is lifted every year for the next 34 years.
Finance Canada then adds another 0.2 percentage points to arrive at the more favourable budget scenario (Canada 2021, p.55). This is premised on the growth-enhancing measures in the budget. Some of the same points can be made here:
- 0.2 percentage points may seem a small adjustment, but it is another 20 percent increase in productivity (although up to a quarter of the effect may come through the labour force such as if the national childcare program raises the participation rate).
- Former governor of the Bank of Canada David Dodge estimates that of the roughly $100 billion of stimulus in the April 2021 federal budget, only around $25 billion adds to public or private investment and the rest supports consumption (Parkinson 2021).
- The budget measures should be expected to raise the level of productivity and the growth rate only over a transition period; the budget is portraying rising growth every year for 34 years.
We believe the federal budget long-term growth assumptions to be optimistic. Given the amount of uncertainty over prospects, the assumptions certainly cannot be ruled out. But in leaning toward the optimistic, they do not provide a solid base for planning; plans based upon overly optimistic assumptions put the country at risk. Less optimistic alternatives should be considered in deliberating upon policy.
Our starting point for alternative economic growth scenarios is Drummond and Capeluck (2015). As background for a study by the Centre for the Study of Living Standards for the Council of the Federation, Drummond and Capeluck projected Canada’s real GDP growth rate to average 1.56 percent per annum,
2014–2038. For the present note we updated the methodology and results to incorporate data available through 2019. To avoid extrapolating pandemic effects, we did not use any data for 2020.
Our projection scenarios start with Statistics Canada population projections (medium growth) by age groups.7Statistics Canada. Table 17-10-0057-01 Projected population, by projection scenario, age and sex, as of July 1. We then ask the question: what would happen to real GDP growth if output per hour (labour productivity) and hours worked continue on their past trends?
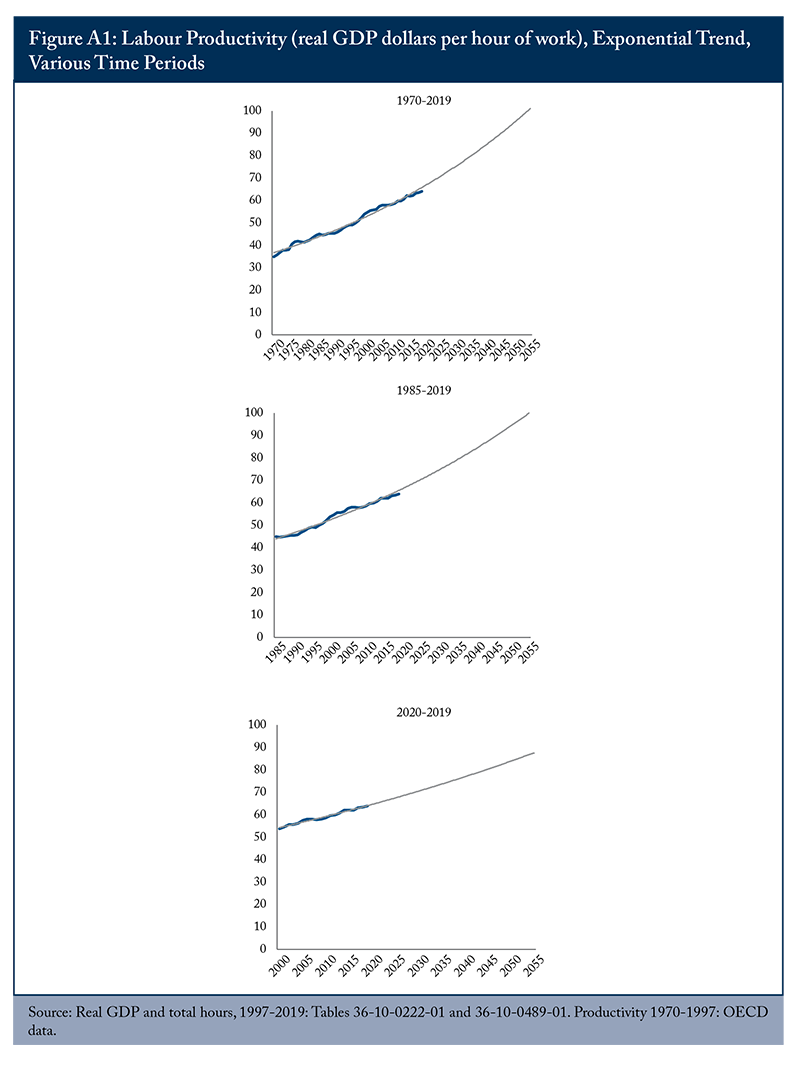
We simulate future annual labour productivity (real output per hour) based on a simple exponential trend8Of the functional form y = bmT, where b is a constant and m is the compounded yearly percentage change. The exponential trend growth rate is slightly different from the average compound annual growth rate (CAGR). For example, for the 2000–2019 period, the CAGR is 0.92 percent while the trend rate is 0.87 percent. The exponential trend growth rate is superior to the CAGR because the latter can give undue weight to only two years of observations – the starting and end years – whereas the former is a fit of all of the observations in the sample and thus is less prone to starting/end year selection bias. – in which productivity increases by a constant percentage change every year – for various historical periods. We use the 2000–2019 period for our baseline scenario, which yields yearly a productivity trend growth rate of 0.87 percent. We also consider alternatives. As per the Finance Canada approach, if
one goes back further, the productivity trend rate of growth rises somewhat as it draws upon a higher productivity era. Various time periods are shown below and in Appendix Figure A1.
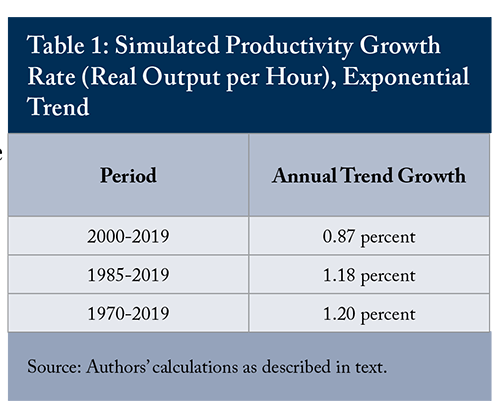
By varying the time period chosen, we come up with a range for simulated productivity growth that goes from 0.87 percent to 1.20 percent. We test the sensitivity of the debt-ratio projections for the 0.87 to 1.18 percent range. We are reluctant to go back into the early part of the 1970s, as Finance does, on the grounds that it is dipping into a higher productivity growth era that has not been seen since.
We simulate future growth of total hours worked in the economy by decomposing it into its components (labour participation rate and average hours worked per worker) for three age groups: 15-24; 25-54; 55+. Since 2000, the participation rates for the 15-24 and 25-54 cohorts have remained relatively flat, and as such we assume they remain constant into the future. The participation rate for the 55+ cohort exhibited strong growth from 2000 to 2010 but has since been growing at a slower pace. We project the participation of the 55+ cohort to continue on its trend and grow modestly at a declining rate based on a simple logarithmic decay trend for the period 2000 to 2019 (Figure A2). Applying projected participation rates to projected population gives us projected employment growth for each age groups.
For decades, there has been a downward trend in average hours worked per worker. That trend has continued, but at a slower pace in recent years. For our baseline, we assume average hours per worker continue to decline but at a modest pace following the 2000–2019 trend (-0.3 percent annually for the 15-24 cohort; -0.2 percent for the 25+ cohort; see Figure A3). Long-term projections from other sources appear to explicitly, or at least implicitly, assume no future change in average hours worked. We test for this sensitivity as well.
We have not added to assumptions of future productivity growth any effects from recent technologies or 2021 budget measures. Any effects are highly uncertain, likely to be small and should lift the growth rate over a transition period only.
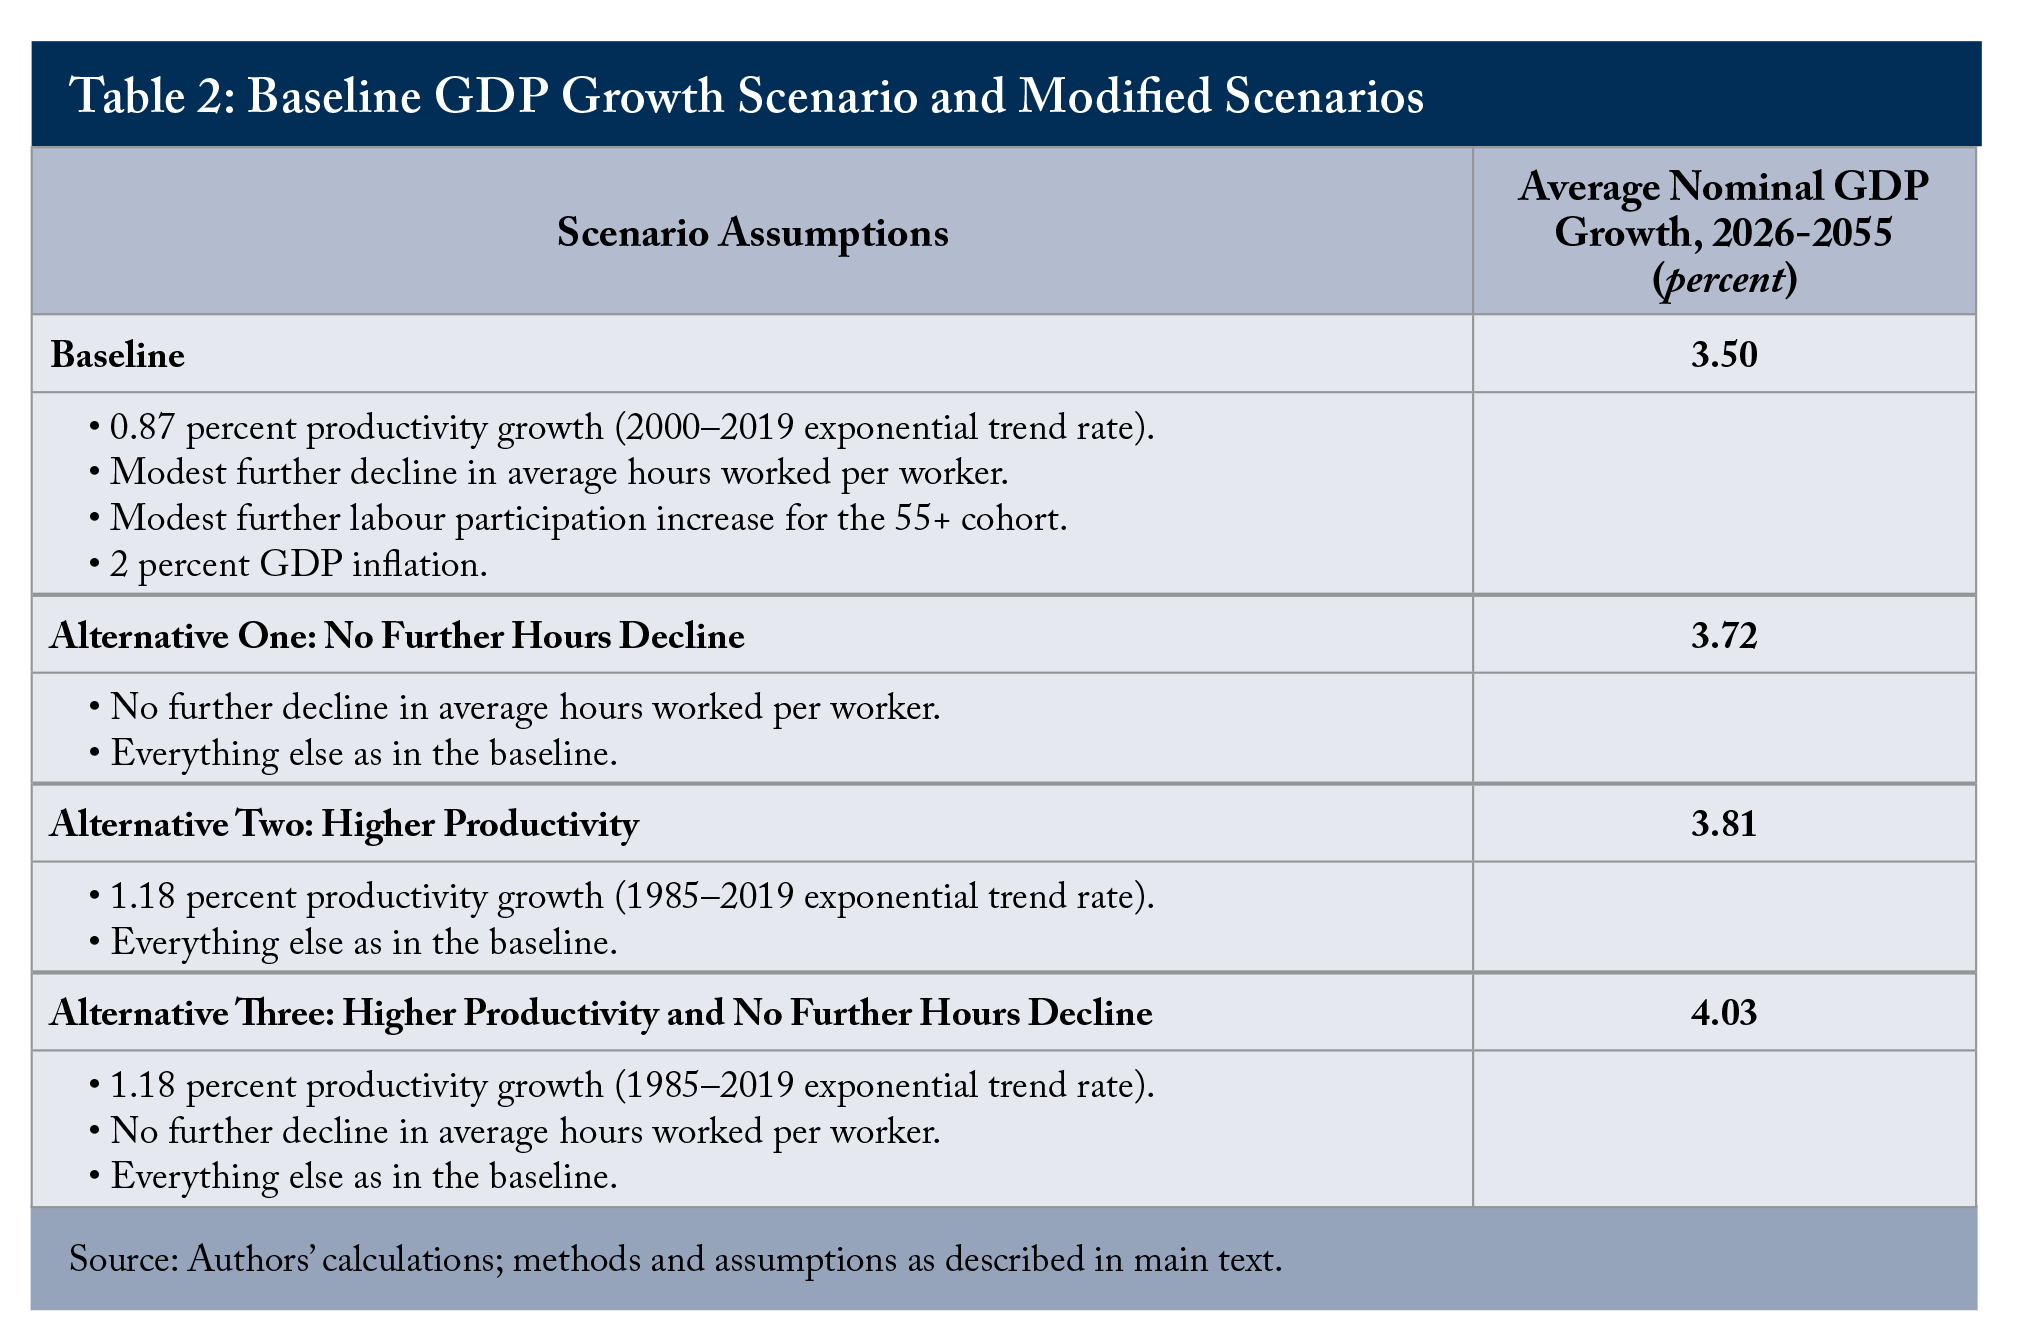
Using the various assumptions described above, we derive various growth rate scenarios over the 2026 to 2055 period. Our baseline scenario yields average nominal economic growth of 3.50 percent (1.47 percent real), while alternative scenarios one to three, using higher productivity assumptions and testing the sensitivity of hours worked, yield nominal growth of 3.72 percent to 4.03 percent (Table 2).
We now turn to the interest rate assumptions and the differential between growth and the interest rate.
A Reasonable Long-Run Interest Rate Scenario Based on the Relationship between GDP Growth and Interest Rates
The future trajectory of the debt-to-GDP ratio also depends on interest rates. A favourable scenario would be for the effective interest rate9The effective interest rate on the federal debt is calculated as the value of debt charges divided by the corresponding value of interest-bearing debt. on the federal debt to remain lower than nominal GDP growth indefinitely or at least for the very long term. For example, on average over the next 35 years, the budget’s favourable scenario would maintain the effective interest rate on the debt about 1 percentage point below economic growth. This is a crucial assumption for a long-term scenario since it would enable the government to reduce its debt burden by doing very little fiscal effort: in theory, annual program spending can exceed revenues by as much as 0.5 percent of GDP (more than $12 billion), while at the same time the entire debt charges can be rolled over each and every year, and this could still reduce the debt burden as a share of GDP. But is this a reasonable scenario for the relationship between interest rates and economic growth?
Ambler and Alexander (2015) use modern economic growth theory to provide insights into the future course of the “equilibrium” riskless interest rate around a “balanced growth” trajectory. In theory, the riskless interest rate, for example the yield on one-month treasury bills, will depend on the level of household impatience (willingness to postpone consumption), economic growth, and population growth. Over the long run, the risk-free interest rate should be higher than the growth rate of per capita output (Ambler and Alexander 2015). The treasury bill rate (riskless rate) will fluctuate with the ebbs and flows of business cycles, but over the long run a fundamental relationship between interest rates and real GDP growth per capita will constrain the riskless interest rate to a level, or a floor, higher than output growth per capita.
Ambler and Alexander (2015) find some empirical evidence that this theoretical relationship holds up in real life. For example, Canadian data from 1960 to 2010 show the real three-month treasury bill yield at auction averaging 0.2 percentage points above the growth rate in Canada’s real income per capita. Of course, any historical averages are dependant upon the chosen time period, but there is ample evidence that interest rates and economic growth are at least moving in the long run in similar directions.
The Bank of Canada’s neutral interest rate adds another perspective on the expectation interest rates will rise from current very low levels. The Bank of Canada has recently revised up substantially its estimates of actual and potential growth, but it has not yet raised its estimate of the neutral interest rate being in a range of 1.75 to 2.75 percent with a mid-point of 2.25. With inflation expectations growing, and yields on US securities increasing, the neutral rate, where output is at potential and inflation on target, will likely be raised. Goodhart and Pradhan (2020) make a strong case that the period of low world interest rates (and low inflation) brought about mostly by a beneficial rise in the working age urban population and globalization is about to come to a halt, with aging societies worldwide leading to a return of inflation and higher nominal interest rates.
Assuming nominal GDP growth of 3.50 percent to 4.03 percent, and adjusting for population growth,100.78 percent average population growth rate over the 2025 to 2055 period under the medium growth scenario. Source: Statistics Canada. Table 17-10-0057-01. Projected population, by projection scenario, age and sex, as of July 1. the theoretical relationship between per capita growth and the riskless rate in Ambler and Alexander (2015) would give us a floor for the long-run riskless interest rate ranging from 2.72 percent to 3.25 percent.
Governments borrow at different maturities, so the effective rate on the debt is higher than the yield on the one-month treasury bill. From 1993 to 2019, the spread between the one-month treasury bill yield and the federal effective interest rate on its debt averaged 2.5 percentage points (250 basis points). But this spread is on a decline as long-term debt is gradually being refinanced at much lower interest rates.
Over the same period, the spread between the one-month treasury bill yield and the long-term bond yield averaged 2 percentage points.11Statistics Canada. Table 10-10-0139-01 Bank of Canada, money market and other interest rates. It appears reasonable to assume that the spread between the effective interest rate on the federal debt and the riskless rate, going forward, will be at least 1 percentage point. But it takes many years for a permanent rise in interest rates to fully trickle its way down into government debt charges: governments borrow at different maturities and a rise in interest rates will manifest when debt matures and needs to be refinanced. Therefore, we expect the effective interest rate on the federal debt to gradually increase over the next 25 years to ultimately reach at least 3.72 percent in our baseline preferred growth scenario (see Figure 1), and up to 4.25 percent under the higher growth scenario.12In 2055, the spread between the effective interest rate on the federal debt and GDP growth is around 0.3 percentage points in all scenarios. On average over the 2026–2055 projection period, the spread between economic growth and the effective interest rate in our scenarios is very close to zero. This is consistent with historical experience since Confederation in which nominal economic growth has oscillated around the effective interest rate on the debt (Di Matteo 2017, p.79).
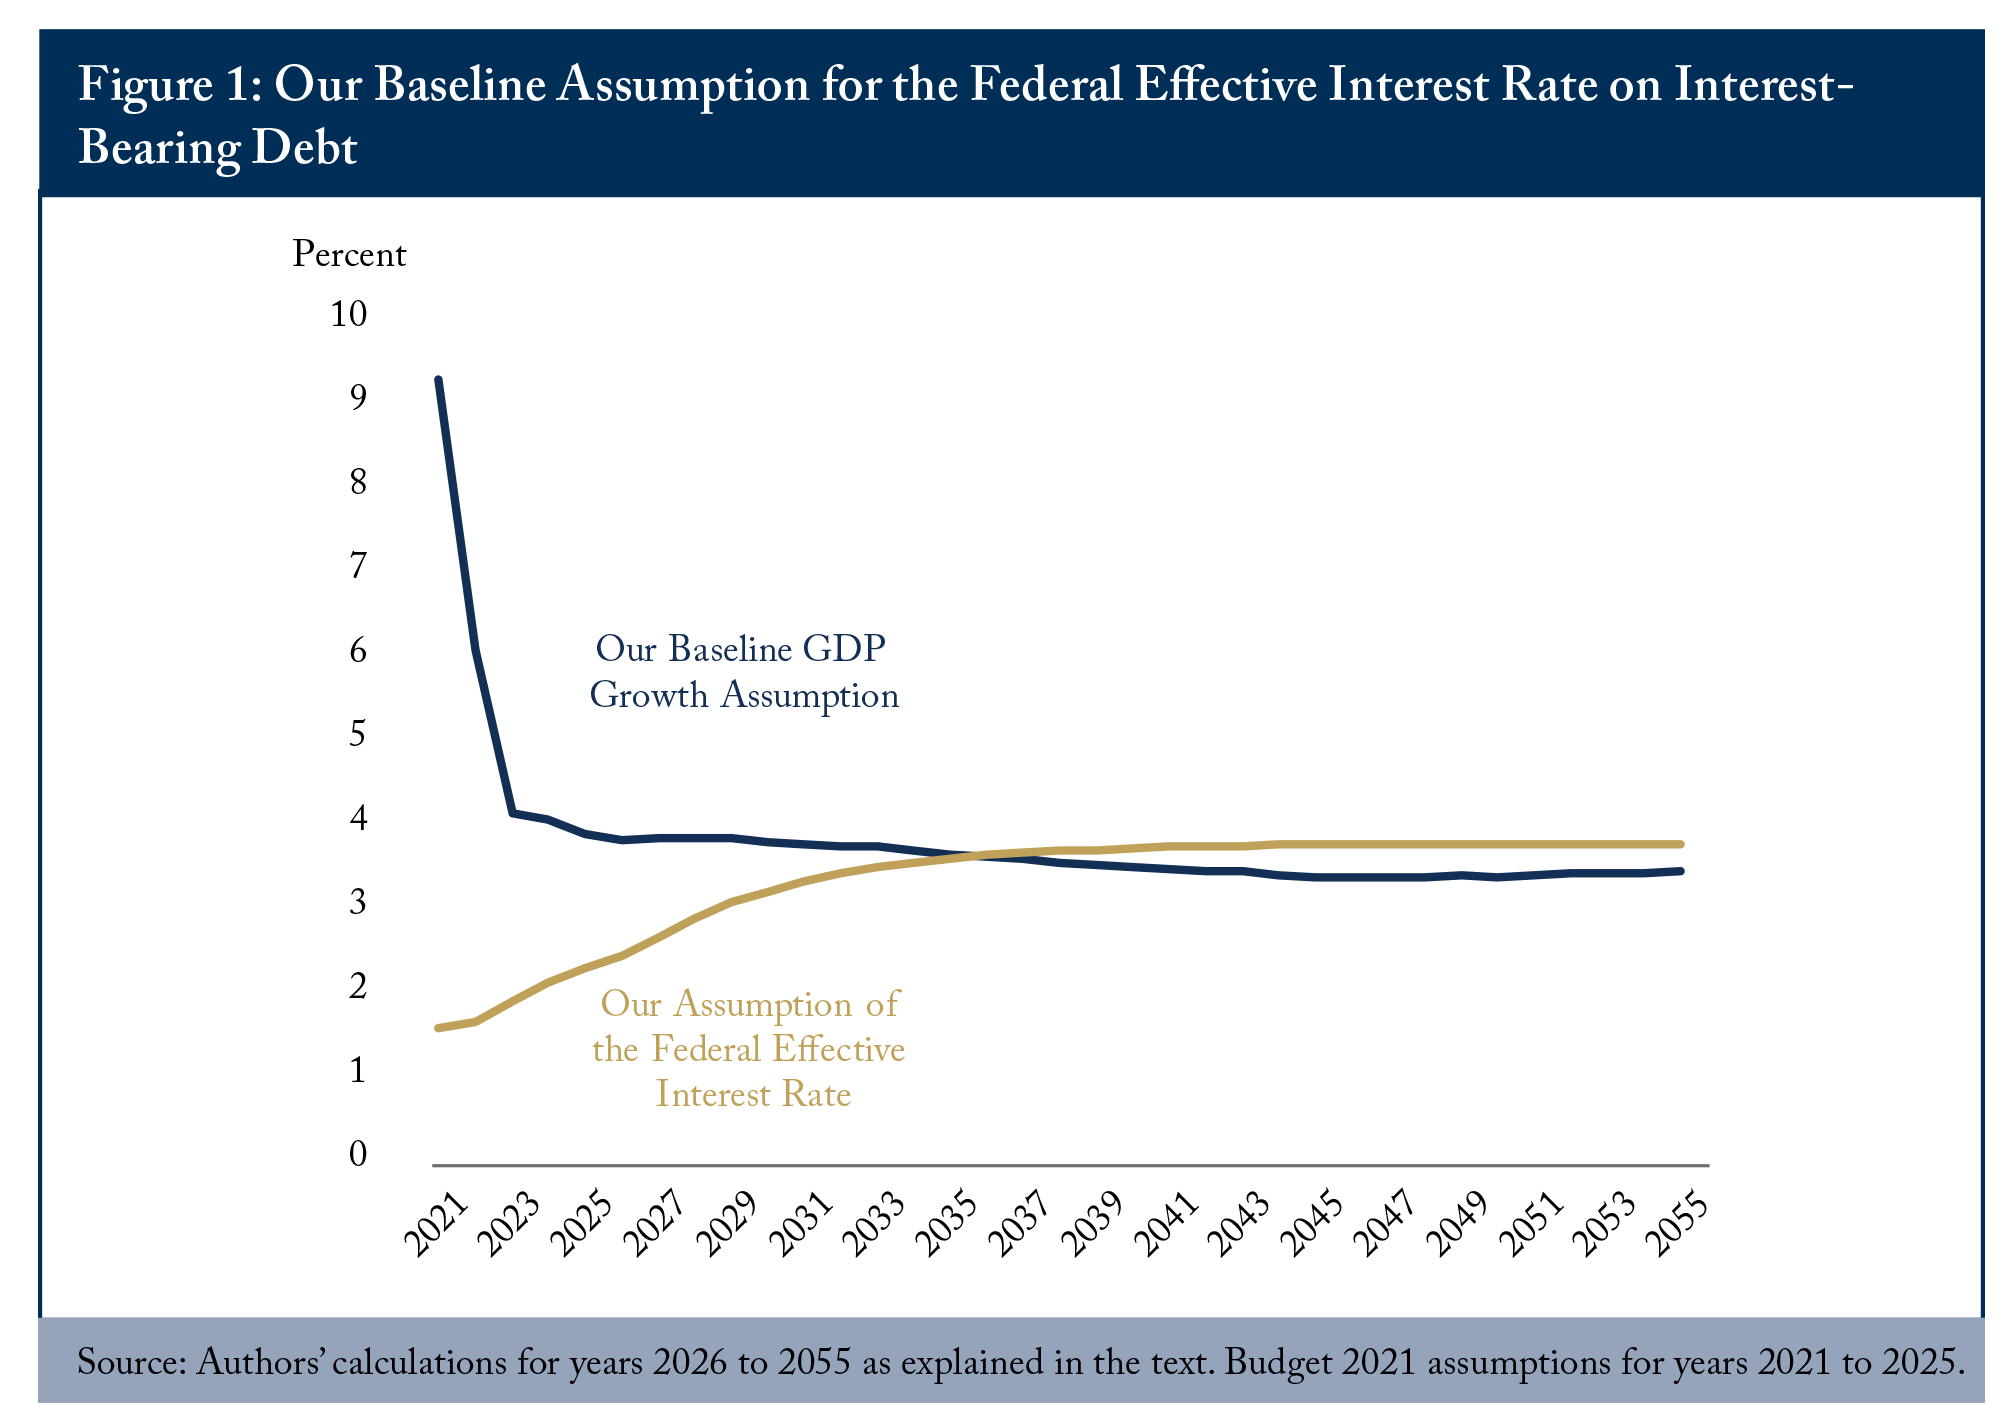
These are conservative assumptions because they do not take into account the growing size of government debt burdens in Canada and elsewhere, which by itself, may push interest rates up even further. We note again that the higher growth scenario in Finance’s long-term projections is not accompanied by a higher interest rate assumption.
Tying It Up: Long Term Debt-to-GDP Scenario Projections
We now bring together our growth and interest rate assumptions to project the debt-to-GDP ratio (net worth) using the model constructed to replicate the federal budget’s results under Finance’s assumptions. As such, our scenarios are a true test of the sensitivity to alternative assumptions.
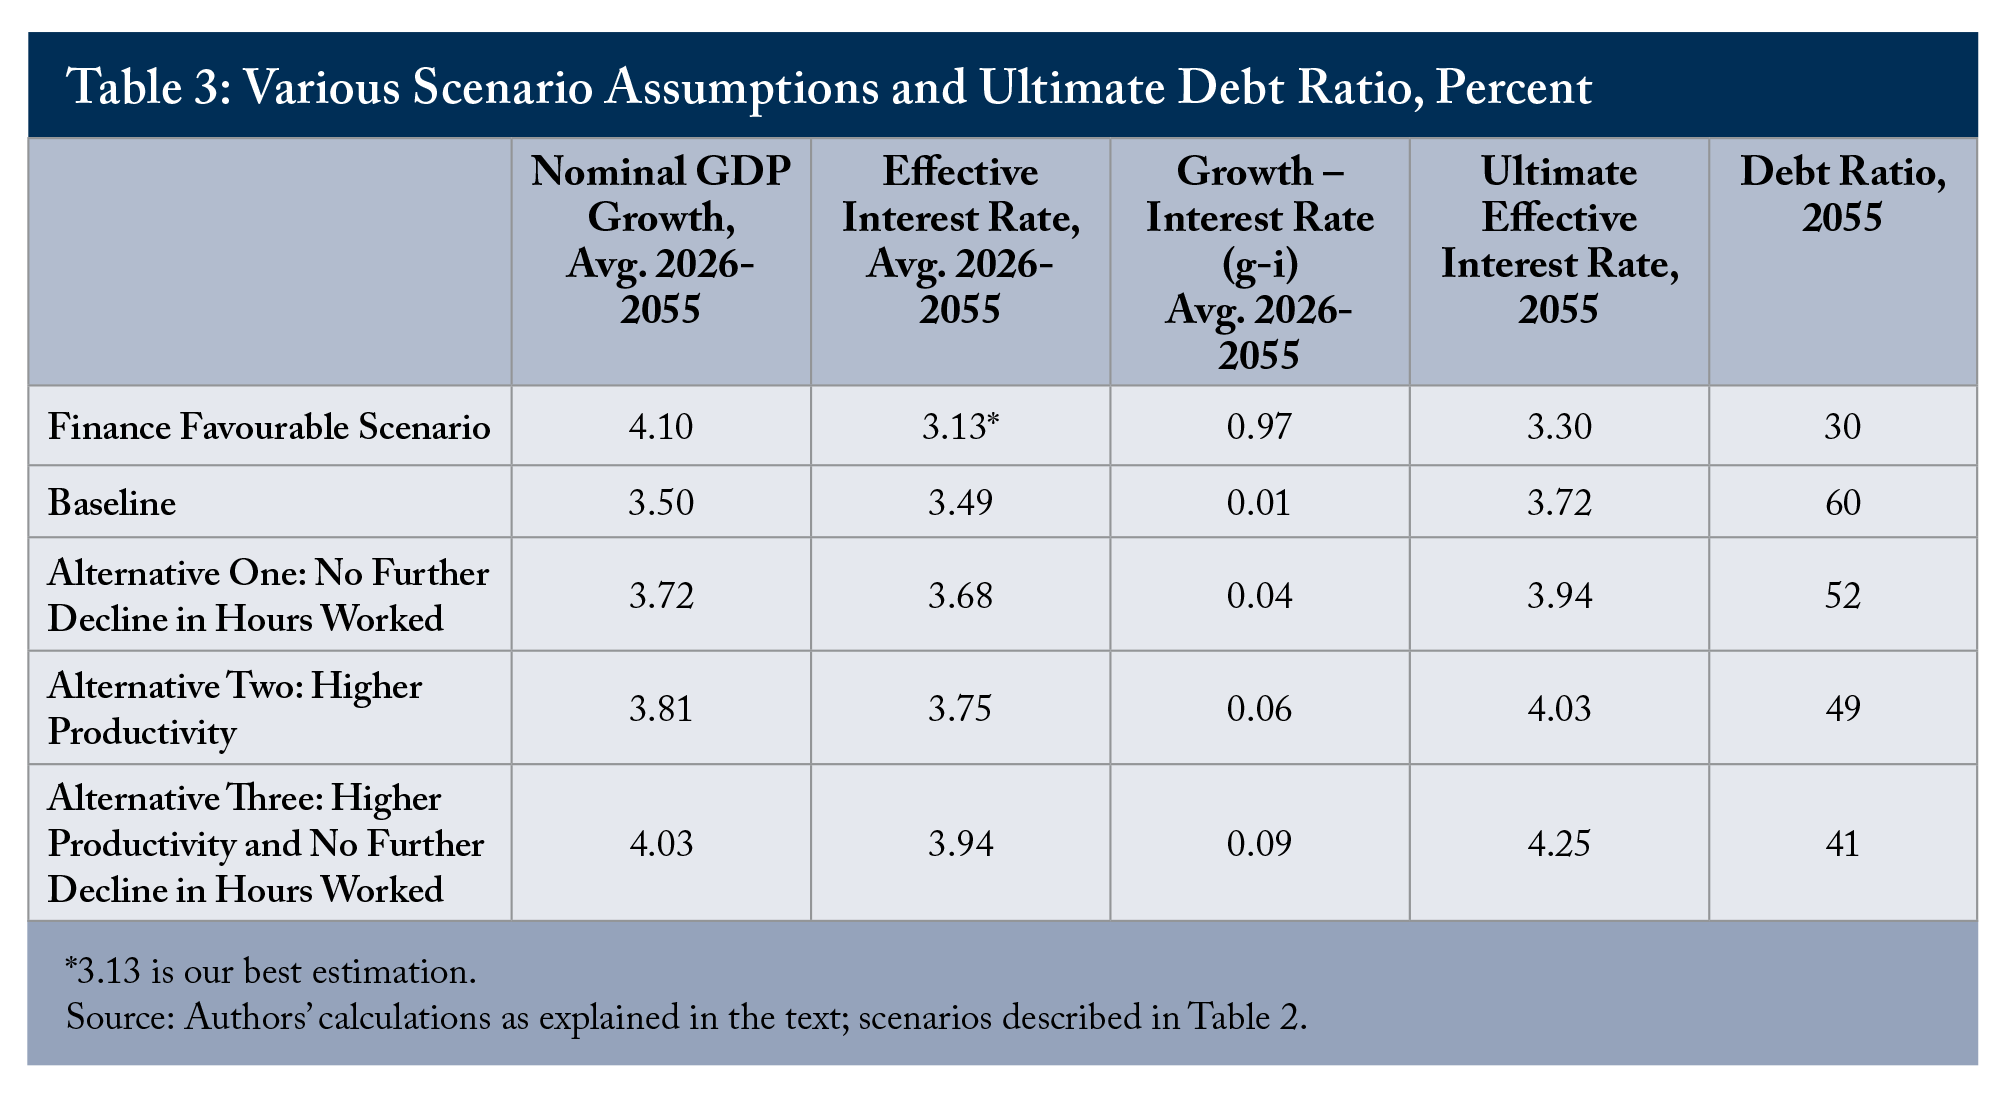
The scenarios we examine are presented in Table 3.
In contrast to Finance Canada’s favourable scenario where the debt-to-GDP ratio declines to the pre-pandemic level of 30 percent by 2055, our baseline projects the debt burden to rise from current peaks to hit 60 percent – double Finance’s result. Alternatives One (no further decline in hours worked) and Two (higher productivity) keep the debt burden around the peak levels of today for the next three plus decades. One way of interpreting this result is that the fiscal hit from the pandemic is locked in and passed forward not just one, but two generations. Our most favourable scenario (no further decline in hours worked and higher productivity) projects a declining trajectory for the burden, but the debt-to-GDP ratio declines only to 41 percent – an end result for the debt burden similar to that depicted in the budget’s less favourable scenario (Table 3 and Figure 2).13As the gap between the economic growth rate and the effective interest rate on public debt is the same across all our scenarios, the differences in debt-to-GDP ratios are driven by differences in projections of the primary balance. Based on our interpretation of the Finance Canada methodology, stronger economic growth increases revenues more than program spending so lifting the economic growth assumptions leads to improvement in the primary budget balance. Our baseline scenario has a small primary deficit of 0.3 percent of GDP by 2055 whereas our most favourable growth scenario has a primary surplus of 1.2 percent of GDP. A key feature of the stronger growth scenarios is a persistent downward drift in the program spending to GDP ratio. This highlights the critical importance of the assumption of no new spending programs over the 34-year period.
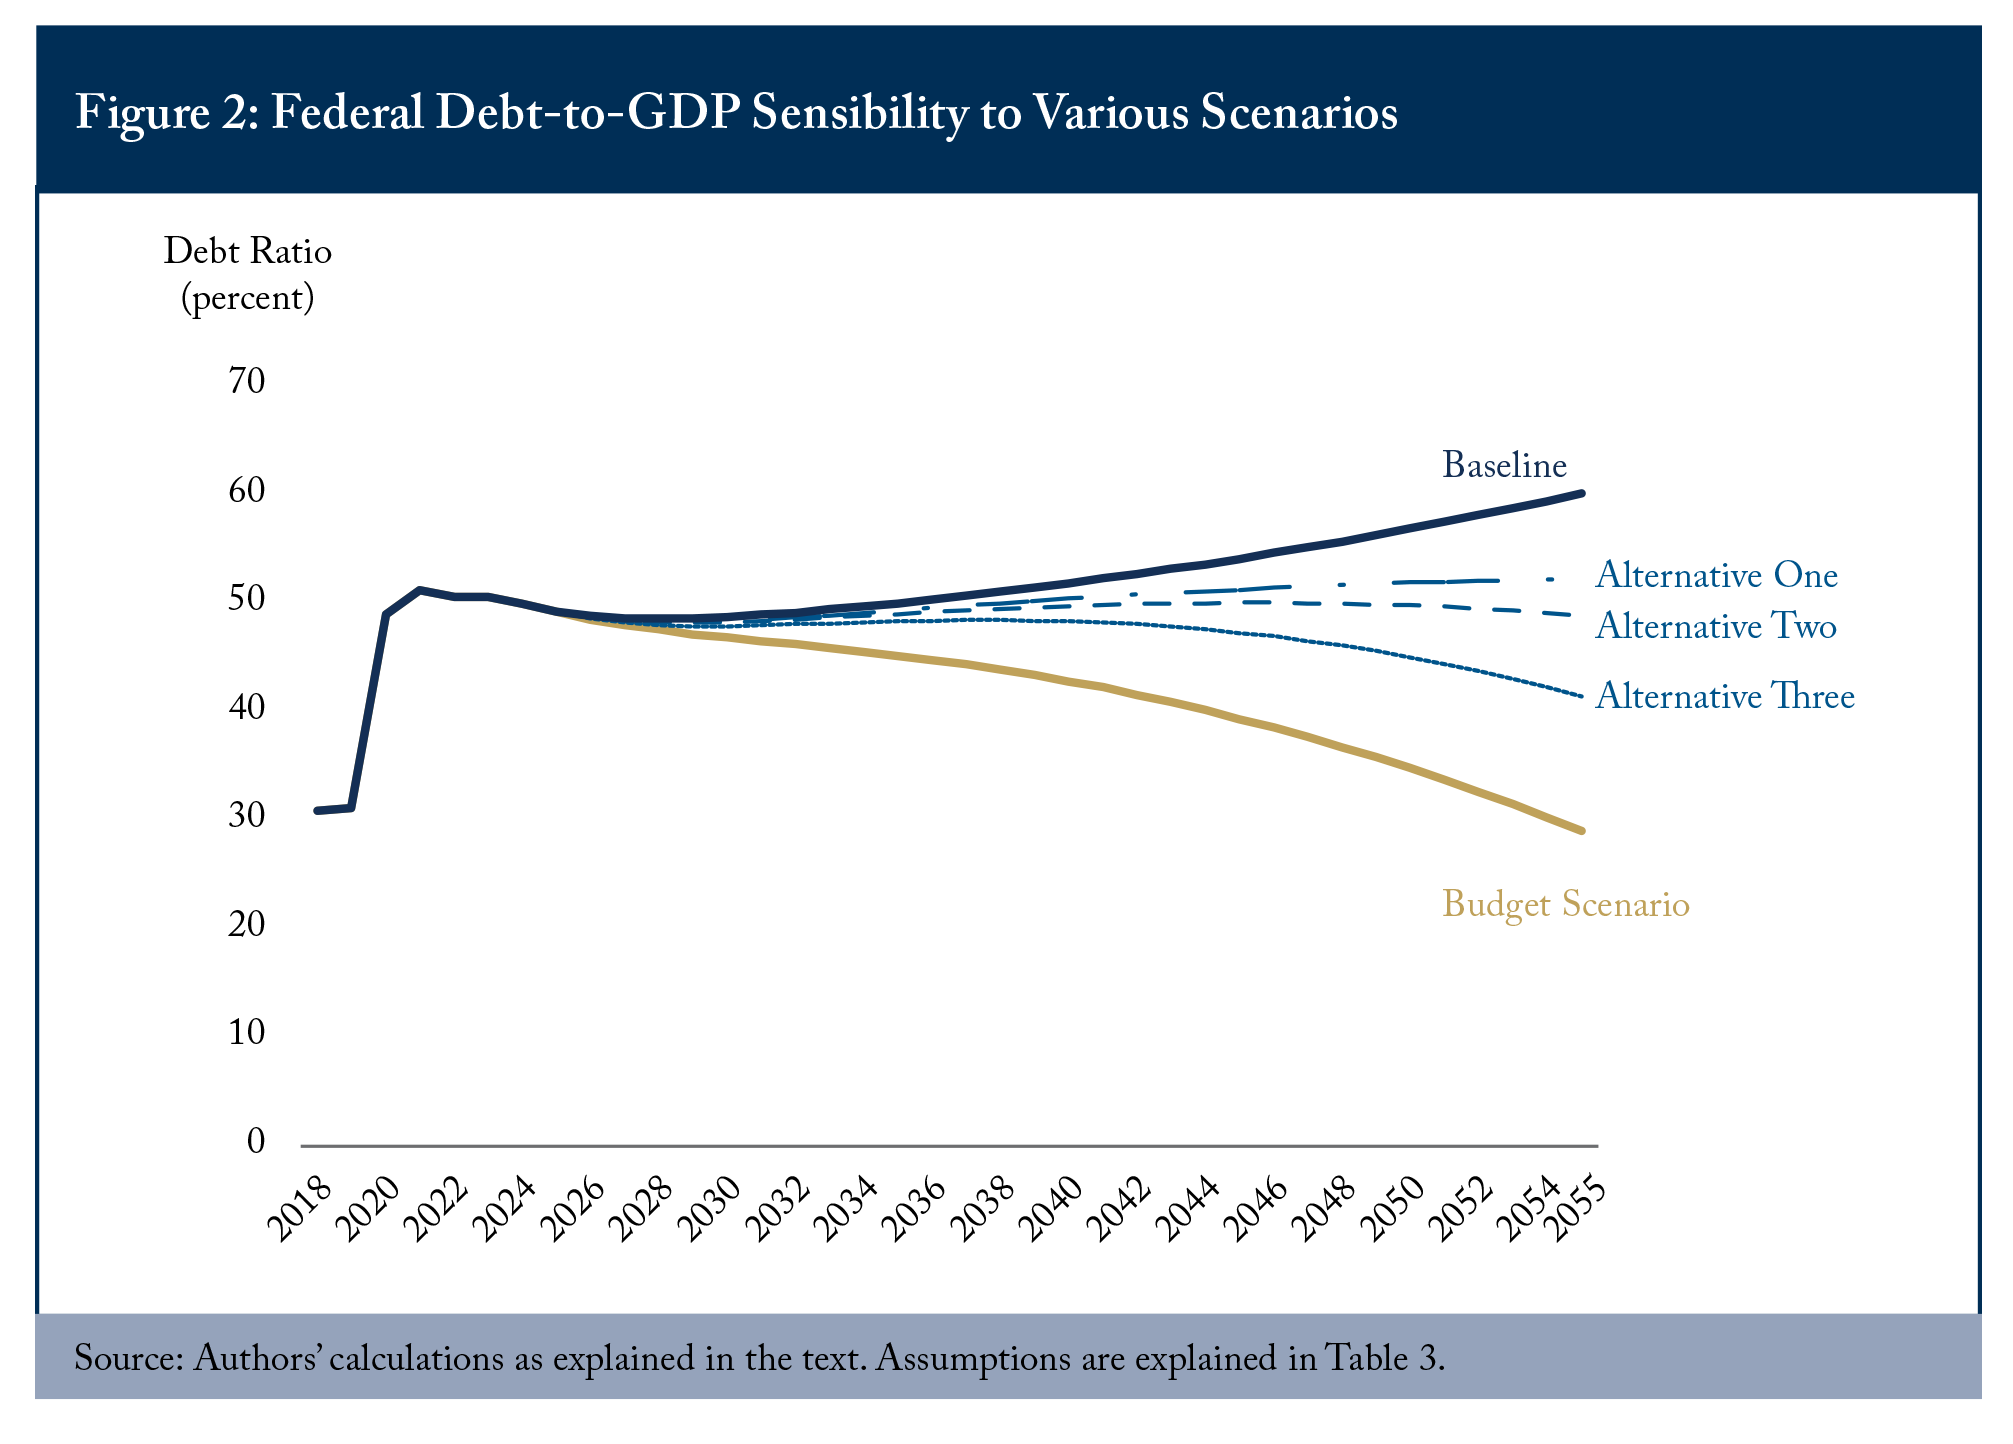
We believe the sizable range between our baseline and Finance’s favourable scenario appropriately reflects the uncertainty over Canada’s fiscal prospects. The range in results also speaks graphically to the risks inherent in a budget plan that, under very credible economic assumptions, could see the debt burden rise back close to historical peaks. On the bright side, the lower interest rate environment projected here compared to the mid-1990s would make the upward drift in the debt burden seem more affordable for longer. Still, simply reversing the upward trend would require an important fiscal effort on future generations.
But perhaps more importantly, the risks in this budget plan appears to leave practically no room for future unfunded spending commitments. Things could turn out reasonably well, as in Finance’s scenario. But they could just as easily, and perhaps even more likely, turn out badly. We have identified several significant downside risks not captured, including, but not restricted to:
- All scenarios assume no further changes in current spending programs or tax reductions over the next 34 years. After all, it only took one day after the budget for a new commitment to be added: a future increase in the Canada Health Transfer, which we have not included (Curry 2021).
- High federal and provincial debt burdens could put further upward pressure on interest rates that we have not captured (a 25 basis point increase in the effective interest rate on debt adds 4.5 percentage points to the 2055 debt burden).
- We focus on average growth rates and abstract from likely economic cycles, yet economic downturns have a tendency to spike government debt burdens with a return to pre-downturn conditions either taking a very long time or not occurring at all.
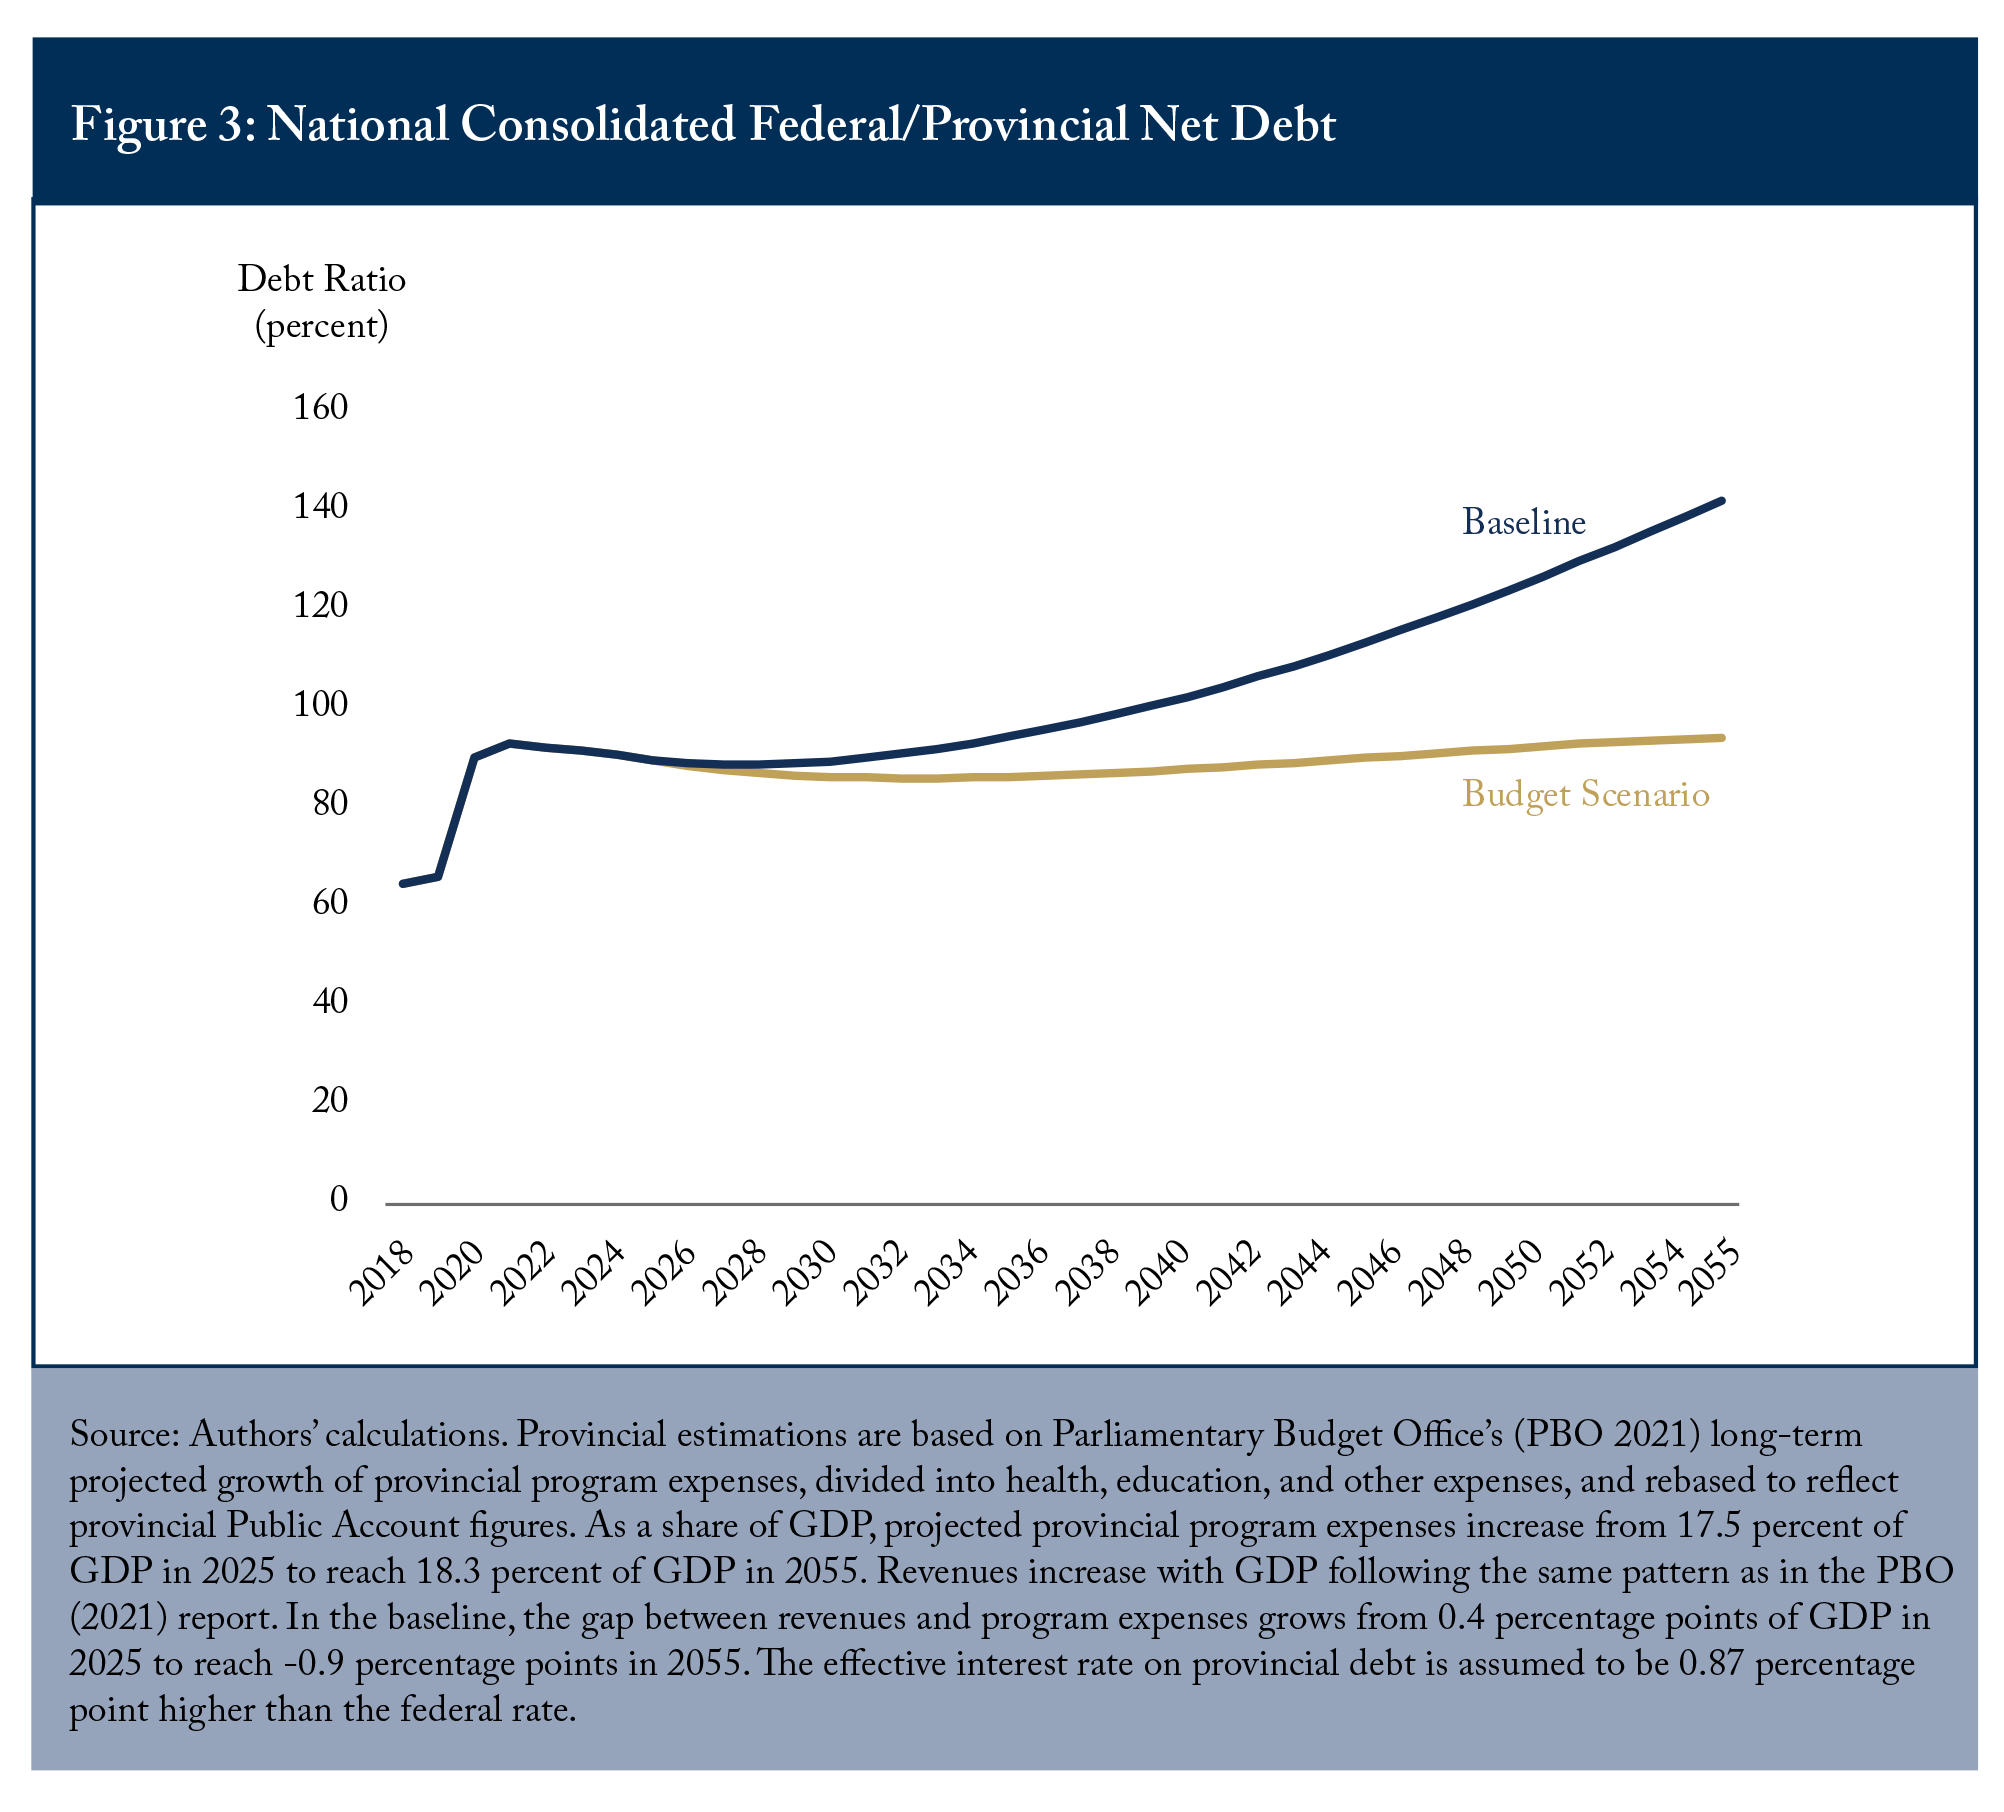
To make matters worse, provincial government debt burdens have spiked during the pandemic and could well rise further. Canada is a federation in which provincial governments enjoy a substantial amount of spending and revenue raising autonomy. Figure 3 extends our federal baseline scenario to include projected provincial government debts. In our baseline, the future trajectory for the national consolidated federal/provincial net debt is alarming. Nationally, taking provincial debts and deficits into account, the consolidated federal/provincial net debt-to-GDP ratio surpasses 100 percent in 2039 under the baseline scenario, and keeps rising at an accelerated pace thereafter. The rise in the provincial debt burdens is mostly due to the unfavourable growth/interest rate baseline assumption and increases in health spending relative to GDP in all provinces.14The effective interest rate on provincial debt is assumed to be 0.87 percentage point higher than the federal rate as per PBO assumptions. More details on the provincial estimations can be found in the source field of Figure 3. At this point it would force a wrenching adjustment to national spending or revenues just to stop the ascending trend. The combined government net debt ratio is also sent in an upward trajectory under the budget favourable scenario, although it stops just short of reaching 100 percent of GDP by the end of the horizon.
Conclusion
Under credible economic assumptions we project that the federal debt-to-GDP ratio could easily rise further above current peak levels associated with the pandemic. The combined federal-provincial net debt ratio may cross 100 percent of GDP before 2040, on its way past 140 percent by 2055. Even under the Budget 2021 favourable scenario the combined net debt burden would almost reach 100 percent of GDP by the end of the projection period. This would be new territory for Canada. The combined federal-provincial debt burden has not exceeded 100 percent since WWII, and debt came down rapidly after WWII because rapid declines in defence spending – which was the bulk of federal expenditures during the war – supported substantial budget surpluses.
The pandemic has kicked Canadian government debt to high levels. Federal and provincial budget plans could well see it go higher for decades and even generations. Canada needs to carefully consider those plans in the context of the risks posed. We present scenarios depicting possible outcomes under status quo policy approaches. But policy can, and we would say should, change to mitigate risks. Should spending be so strong? Should taxes be increased to better support the high spending? Should future generations be passed a lower fiscal burden to better enable them to grapple with their own challenges such as adapting to climate change and absorbing the economic hit that it may deliver?
No matter the answers to policy choices about taxes and spending, one thing is clear: this exercise draws out the imperative of raising Canada’s long-term economic growth rate. There is a critical difference between assuming and accepting 1.5 percent real GDP growth in future. We assume that pace of growth in our baseline because that is what recent trends in the Canadian economy together with future demographics imply. But Canadians should not accept such a modest growth path. Future fiscal policy choices will be increasingly difficult if we get stuck in a 1.5 percent real GDP growth trajectory. Above all, fiscal decisions today must be geared towards increasing Canada’s sustainable productive capacity.
Appendix
References
Ambler, Steve, and Craig Alexander. 2015. “One Percent? For Real? Insights from Modern Growth Theory about Future Investment Returns.” E-Brief 216. Toronto: C.D. Howe Institute. October.
Bennett Jones. 2021. Spring 2021 Economic Outlook. Available at bennettjones.com.
Canada. 2018. Update of Long-Term Economic and Fiscal Projections 2018. Finance Canada.
______. 2021. Budget 2021: A Recovery Plan for Jobs, Growth, and Resilience. Finance Canada. April.
Curry, Bill. 2021. “Ottawa will increase health transfers to the provinces after the pandemic, Trudeau says.” The Globe and Mail. April 20.
Di Matteo, Livio. 2017. A Federal Fiscal History: Canada, 1867–2017. Fraser Institute.
Drummond, Don, and Evan Capeluck. 2015. “Long-term Fiscal and Economic Projections for Canada and the Provinces and Territories, 2014-2038.” Centre for the Study of Living Standards Research Report. July.
Goodhart, Charles, and Manoj Pradhan. 2020. The Great Demographic Reversal: Ageing Societies, Waning Inequality, and an Inflation Revival. Palgrave Macmillan.
Lester, John. 2021. Who Will Pay for the Economic Lockdown? Commentary 594. Toronto: C.D. Howe Institute. March.
Lian, Weicheng, Andrea F. Presbitero, and Ursula Wiriadinata. 2020. “Public Debt and r - g at Risk.” IMF Working Paper WP/20/137. International Monetary Fund. July.
Parkinson, David. 2021. “David Dodge’s big issue with the budget isn’t debt, but lack of growth.” The Globe and Mail. April 29.
Parliamentary Budget Office (PBO). 2021. Fiscal Sustainability Report 2021. June 30.
This E-Brief is a publication of the C.D. Howe Institute.
Alexandre Laurin is Director of Research at the C.D. Howe Institute.
Don Drummond is Stauffer-Dunning Fellow, Queen’s University, and Fellow-in-Residence,
C.D. Howe Institute.
Permission is granted to reprint this text if the content is not altered and proper attribution is provided.
The views expressed here are those of authors. The C.D. Howe Institute does not take corporate positions on policy matters.
The authors thank Benjamin Dachis, Jeremy Kronick, Jeannine Bailliu, William Robson, Steve Ambler, David Dodge, John Lester, William Molson and anonymous reviewers for comments on an earlier draft. The authors retain responsibility for any errors and the views expressed.