


• In this year’s report card – which covers year-end financial statements for fiscal year 2023/24, and budgets and estimates for 2024/25 – Alberta topped the class with an A+. Quebec earned a B+; Prince Edward Island, Nova Scotia, New Brunswick, Saskatchewan, British Columbia, Yukon and Nunavut earned Bs; and Ontario earned a B-. Newfoundland and Labrador received a C. The federal government earned a D. At the bottom of the class, with D- grades, were Manitoba and the Northwest Territories.
• The fiscal transparency of Canada’s senior governments has improved over time, notably their adherence to Public Sector Accounting Standards (PSAS) in financial statements and more recently in budgets. But timeliness is a continuing problem and backsliding is a constant risk. Especially lately, the gaps between surpluses or deficits in budget projections and end-of-year results are disconcertingly large. Canadians need less backsliding and further progress to get better fiscal accountability from their governments.
Note to readers: This is a revised version of the commentary first published in October 2025, updating Ontario’s 2024 grade using the 2025 scoring system.
Introduction and Overview
Canada’s federal, provincial and territorial governments loom large in the nation’s economy and in Canadians’ lives. Their financial statements for fiscal year 2023/24 showed just how significant that presence is: together, they recorded more than $1 trillion in revenues and expenses – around 37 percent of gross domestic product, or about $27,000 per Canadian.1The information on senior governments’ budgets, estimates, financial statements and interim reports, and the scores and grades based on them, are current as of 13 October 2025. They taxed Canadians’ labour and capital incomes, and they taxed spending on most goods and services. They used this money to provide services and transfer payments in myriad areas including healthcare, education, national defence and policing, income support and business subsidies. Over time, their aggregate expenses have exceeded their revenues. As a result, their accumulated operating deficits reached more than $1.6 trillion at the end of 2023/24.
Governments exist to provide public services, and representative government requires legislators and officials to act in the public interest. To ensure that they do, taxpayers and citizens must be able to monitor, influence and react to how legislators and government officials acquire and use public funds. Financial reports are key tools for monitoring governments’ performance of their fiduciary duties.
The audited financial statements that Canada’s senior governments publish in their public accounts after each fiscal year provide vital information. Their statements of operations show revenues and expenses during the year and the difference between them: their surpluses or deficits. Their statements of financial position show their assets – both financial and capital, such as buildings – and their liabilities. The difference between these, the accumulated surpluses or deficits, is a key measure of their capacity to deliver services.2The link between accumulated surplus or deficit and service capacity is an explicit objective of PSAS. “Reporting on financial condition provides insight into an entity’s service capacity. Reporting on financial performance provides insight into how an entity’s decisions, transactions and other events of the period have affected its service capacity” (PSAB 2022, 3.23).
Budgets provide similar information in advance. Citizens and taxpayers, and the legislators who represent them, can examine the budget a government presents at the start of the fiscal year – notably, its projections for revenues and expenses and for the surplus or deficit. The budget should also show the change in accumulated operating surplus or deficit that will result from the projected annual surplus or deficit, so users can understand the budget’s implications for the government’s capacity to deliver services.3The most comprehensive measure of a government’s capacity to deliver services is its accumulated surplus or deficit, which is equal to its accumulated operating surplus or deficit plus accumulated remeasurement gains and losses. We focus on the accumulated operating surplus or deficit in this report card because the change in PSAS that makes this distinction is relatively new, and while reporting of changes in accumulated operating surpluses or deficits is quite consistent across governments, reporting of changes in accumulated surpluses or deficits is not.
The scope of the estimates is narrower, but legislators’ ability to understand and approve them is critical to their ability to steward public funds.
The C.D. Howe Institute’s annual report on the fiscal accountability of Canada’s senior governments focuses on the accessibility, reliability and timeliness of these documents. Like its predecessors going back to 2007, this report is not about whether governments spend and tax too much or too little, whether they run surpluses or deficits, or whether their programs succeed or fail. Rather, it examines whether elected representatives and citizens can get the information they need to form opinions on these issues and address any problems they discover. The letter grades in this report reflect our judgment of how well each government’s budgets, estimates, and financial statements enable legislators and voters to understand fiscal plans and hold governments accountable for fulfilling them.
We put ourselves in the place of a motivated non-expert user of these documents, such as a legislator, journalist or voter. We ask whether such a user could get the information on time. We ask if the numbers the user would most readily identify as the key numbers are, in fact, correct, reliable and usable for straightforward comparisons. For example, can the user find and compare the revenues and expenses projected and approved by legislators before the start of the fiscal year with the revenues and expenses of the prior year? And can the user find and compare the budget’s projections with the revenues, expenses and change in accumulated operating surplus or deficit published after year-end?
How easy a time would this user have with the senior governments’ budgets and estimates for fiscal year 2024/25 and their year-end financial statements for 2023/24 – the documents relevant for this report card? In the cases of Alberta and Quebec, quite easy. These governments displayed the relevant numbers early in their documents and applied consistent accounting throughout. They provided tables that reconciled results with budget intentions, explained variances between them and published frequent in-year updates. Their reporting was also timely: both presented their 2024/25 budgets and their main estimates simultaneously, before the start of the fiscal year. Alberta is particularly notable for releasing its 2023/24 public accounts within 90 days of the end of the fiscal year.
Our user would have a tougher time with the documents of other governments. Some released their documents late. Others used inappropriate and inconsistent accounting and aggregation, making the information harder to interpret and compare. Some buried their consolidated revenue and expense numbers hundreds of pages deep or even published them separately.
Although this report primarily focuses on budgets, main estimates and financial statements from 2023/24 and 2024/25, we make two comments about the past and the future. Looking back, the long-term trend in the quality of the financial information provided by Canada’s senior governments is positive. Conformity with PSAS in financial statements is now the norm, conformity with PSAS in budgets is common, and many governments reconcile their estimates better with their budgets and with PSAS.
Looking forward, we provide a preview of the scores for fiscal year 2025/26 budgets and estimates. That preview prefigures possible further improvement, with Alberta on track to earn an A in our 2026 report card, and New Brunswick on track to earn a B+. Sadly, the federal government is a significant exception: on track to receive an F.
A key aim of this annual survey is to encourage further progress and discourage backsliding. The deficiencies we highlight are fixable, as past improvements and the example of leading jurisdictions show. Canadians can and should expect timely, transparent financial reporting from their governments, and they should insist on it.
Measuring Fiscal Accountability
Financial documents are tools for reporting and decision-making. To be useful, they must be accurate, complete and accessible to people who are not accounting experts. A motivated and numerate user should be able to find consolidated revenues and expenses, understand the resulting surplus or deficit, and identify the corresponding change in accumulated operating surplus or deficit. The documents must also be timely. Our focus on these attributes complements other measures of fiscal transparency, including the Organisation for Economic Co-operation and Development’s Best Practices for Budget Transparency (OECD 2002) and the independent Open Budget Survey conducted by the International Budget Partnership (2024).4Some of the OECD’s “best practices” are dated – for example, specifying conformity with national income accounting practices, which would be a step backward from Canada’s PSAS. In other respects, however, the OECD’s criteria for timeliness of budgets and financial reports, clear and consistent reporting of gross amounts in both documents, timely updates relative to plan and informative comparisons of projections with results and vice versa run parallel to ours. Its 2023 Open Budget Survey awarded the federal government a modest 74 out of 100 points for transparency. Some OECD criteria, such as opportunities for public consultation, differ from ours, and it emphasizes the clarity of the financial projections and reports themselves less than we do. But – like us – it highlights the limited legislative oversight in Canada’s budget process, recommending earlier budget presentations to the legislature, earlier legislative approval and monitoring of in-year implementation.
The Fiscal Cycle and Principal Documents
The fiscal year of Canada’s senior governments runs from April 1 to March 31. Budgets look forward. They show planned revenues and expenses and the projected surplus or deficit. They should be released before the start of the fiscal year. The main estimates also look forward. They set out particular spending for which a government must obtain legislative approval. They should also appear before the start of the fiscal year. In contrast, the audited financial statements in the public accounts look backward. They show actual revenues and expenses, the actual surplus or deficit, and the change in the government’s accumulated operating surplus or deficit. They appear after the end of the fiscal year.
The budget is the core statement of a government’s fiscal priorities. It attracts unique attention, prompting extensive debate in the legislature and getting more media coverage and scrutiny than other fiscal documents. Its central features, and a key focus of this report card, are its projected statement of operations – revenues and expenses – the resulting annual surplus or deficit, and the resulting change in the accumulated operating surplus or deficit.
The estimates that detail particular outlays are key links in the chain of accountability that runs from voters through legislators to the officials who spend the money. We focus on the main estimates tabled at the start of the fiscal year because they prefigure most of the outlays for which the government must obtain legislative approval and should be consistent with the budget’s fiscal plan, including the projected surplus or deficit.
The audited financial statements in the public accounts are the definitive report of a government’s revenues and expenses during the year and of its accumulated operating surplus or deficit at the year’s start and end. As with budgets, our focus is on how these statements present consolidated revenues, expenses and annual surplus or deficit, along with changes in the accumulated operating surplus or deficit.
Interpreting the Principal Documents
Comparing the principal documents should be straightforward. As the Public Sector Accounting Board (PSAB) expresses it, “Comparing actual financial performance against the budget is a fundamental component of financial accountability in the public sector. The actual-to-budget comparison in the financial statements closes the accountability cycle. It is crucial for users when assessing accountability to have information to be able to compare what was budgeted to what actually happened” (PSAB 2022, 6.29).
A clear comparison will let a motivated but non-expert user see, for example, how close last year’s results were to last year’s plans, or how this year’s budget would raise or lower revenues and expenses from the previous year. When such comparisons are obscure, even experts must work hard to extract answers and non-experts may not know where to start.
Similar principles apply to the main estimates. Governments that present their estimates simultaneously with their budgets and provide clear up-front reconciliations of the amounts they are asking legislators to approve with the overall fiscal plan are more transparent than governments that do not. Timely approval of the estimates also matters. Spending money with little or no attention from legislators breaks a key link in the chain of accountability for stewarding public money.
Many governments also produce interim fiscal reports during the year. These should show performance relative to budget plans and provide updated financial projections for the year. This information improves understanding of how events affect public finances and can foster early action if things are going off course. Our survey also looks at the frequency and content of these reports.
How We Graded the Governments
We used specific criteria to quantify the quality and accessibility of information in the 2024/25 budgets and estimates, and the 2023/24 year-end financial reports of Canada’s senior governments. Our scoring range on each criterion reflects the granularity we think appropriate to distinguish good performance from bad. The weight assigned to each reflects our judgment of its relative importance to transparency and accountability, giving extra weight to criteria where failure creates significant barriers, such as the timeliness and reliability of key numbers, compared with more surmountable barriers like placement or comparability.
Timeliness
Legislators should have sufficient time to consider the government’s fiscal plan and vote on the budget before the start of the fiscal year. We awarded a top score of 2 to governments that presented their 2024/25 budgets 30 days or more before the April 1 start of the fiscal year, a score of 1 to governments that did so fewer than 30 days before the start of the fiscal year and 0 to those that presented them after the fiscal year had begun.
Legislators should get the main estimates with a budget presented early enough for legislative consideration before the fiscal year begins. As with budgets, we awarded a score of 2 to governments that presented their 2024/25 main estimates 30 days or more before the start of the fiscal year, 1 to governments that did so fewer than 30 days before the start of the fiscal year and 0 to those that presented them after the start of the fiscal year. We awarded a bonus point to governments that tabled their main estimates simultaneously with their budgets.
To evaluate the transparency of the process of approving the estimates, we awarded a score of 2 to governments that announced – through a press release or on their finance ministry or legislative assembly website – when the main estimates were approved and provided a report on the results. Governments that announced approval but provided no accompanying report received a score of 1, and those that made no announcement received 0.
Timely release of year-end financial statements helps legislators and the public understand and react to deviations from plans. It also encourages faster information gathering – helpful for many reasons, including preparing a baseline for the next budget. Our scoring for this criterion reflected the date of the legislative auditor’s signature on the financial statements. Although that approach is not ideal – governments may release the statements or the public accounts well after the auditor signs and the public accounts contain useful additional information – it is straightforward to verify. We awarded a score of 2 to governments whose auditors signed no more than 90 days after the fiscal year-end, 1 to those whose auditors signed more than 90 days but no more than 181 days after the year-end and 0 to governments whose auditors signed more than 181 days after the year-end.
Interim updates should provide timely information about performance relative to budget plans and include updated financial projections for the year. We awarded a score of 3 to governments that provided monthly updates, 2 to governments that provided quarterly updates, 1 to governments that provided half-year updates and 0 to governments that provided none.5Comprehensiveness and timeliness with respect to the period they describe are also important considerations for interim updates but, other things equal, more frequent updates are better. We added a point when governments showed comparisons to budget projections that were consistent with the numbers in the budget document.
Placement of Key Numbers
Key numbers – consolidated revenues, expenses, surplus or deficit, and change in accumulated operating surplus or deficit – should be up front, reducing the chance that a user will give up or mistake earlier numbers for the key numbers. We referenced the physical budget books, principal volumes of the main estimates and public accounts, or their PDF equivalents. Web pages and interlinked documents are often temporary, undated, and difficult to navigate, making them unreliable for this assessment.
Our count began with the first physical or electronic page, excluding tables of contents and lists of tables or figures since these help readers navigate the document. For both budgets and public accounts, we awarded a score of 3 to governments that showed their consolidated revenues, expenses and surplus or deficit, and the accumulated operating surplus or deficit within the first 15 pages. We awarded a score of 2 when governments showed them between pages 16 and 30, 1 to governments that showed them in pages 31 to 50 and 0 when buried beyond page 50.
We did not scale our scores according to the overall length of the documents – by using percentages, for instance – because numbers buried deep are no easier to find in a long document than in a short one.
Reliability and Transparency of Numbers
The four key numbers in both budgets and public accounts are:
1. Consolidated revenues, which add to a government’s accumulated operating surplus or deficit during the year;
2. Consolidated expenses, which subtract from a government’s accumulated operating surplus or deficit during the year;
3. The surplus or deficit; and
4. The accumulated operating surplus or deficit at the start and end of the year.
These numbers should capture everything the government controls – the entire reporting entity. Governments that omit items such as amortization of capital, debt-servicing costs or pension expenses, or that move money in and out of special-purpose accounts, obscure this essential information. For both budgets and public accounts, we awarded 1 point for reporting consolidated revenues, consolidated expenses and the consolidated surplus or deficit and/or the change in accumulated operating surplus or deficit, for a maximum of 3 points.
For the public accounts, a vital question is whether the legislative auditor gave a qualified opinion about their adherence to PSAS. We awarded a score of 2 to governments with an unqualified opinion on their 2023/24 financial statements, 1 for one qualification and 0 for more than one.6We weighted this criterion heavily in our grades because of the scope and rigour of auditors’ work. A qualified audit opinion is a red flag to a user of financial statements in the for-profit sector, the not-for-profit sector, or government. The auditor’s opinion does not determine a passing or failing grade by itself for two reasons. First, although numbers that have passed inspection are clearly better than those that have not, their timeliness and the ease with which users can find and identify them also matter; audited numbers published late and obscurely are less useful. Second, PSAS compliance in some circumstances can be a matter on which reasonable people can and do disagree. Legislative auditors use judgment in deciding whether specific practices conform to PSAS, and thinking about how best to present financial information is continuously evolving. The size of the discrepancy between what the government presented and what the auditor calculated the government would show with a PSAS-consistent presentation also matters. We awarded a score of 2 if there was no discrepancy or if the discrepancy was less than 5 percent of expenses, 1 if the discrepancy was between 5 and 10 percent of expenses and 0 if the discrepancy was more than 10 percent of expenses.
Some ways that governments can deal with the inevitable uncertainties in their projections are better for transparency and accountability than others.
Protecting the bottom line from adverse outcomes by presenting pessimistic forecasts for the economy and revenues or exaggerating projected expenses is opaque. An explicit prudence or contingency reserve is more transparent. Yet such cushions can give governments scope to spend on items not anticipated by the estimates and the fiscal plan, undermining accountability.
Accordingly, we rewarded governments for including an explicit prudence cushion or reserve in their budget projections, if its size was reasonable. We awarded a score of 1 to governments that included a reserve in their budget projections if the reserve was less than 5 percent of budgeted expenses and 0 to governments that presented no reserve or presented one that was 5 percent or more of budgeted expenses.
Adjustments between the year’s surplus or deficit and the associated change in the accumulated operating surplus or deficit represent gaps between what decision-makers can influence and what actually happens to a government’s service capacity during the year. Indeed, PSAS allow or mandate adjustments between the annual and accumulated balances in some circumstances, such as when government-owned enterprises experience gains or losses that become gains or losses of their owners. This example illustrates the justification for such entries: gains or losses on investments in Crown corporations outside governments’ direct control are different from revenues and expenses voted on in legislatures. But it also illustrates why these gains and losses undermine legislators’ control over public funds. We quantify our concerns about these gaps in two ways.
One criterion measures the difference, in absolute value, between what the financial statements show for the annual surplus or deficit and what they show for the change in accumulated operating surplus or deficit. We awarded a score of 3 to governments with changes in their accumulated operating surpluses or deficits equal to their annual surpluses or deficits in their 2023/24 financial statements, 2 for gaps between the changes in their accumulated operating surpluses or deficits and their annual surpluses or deficits with absolute values less than 1 percent of their expenses, 1 for gaps between 1 and 2 percent of expenses, and 0 for gaps of more than 2 percent of expenses.
The other criterion measures the difference, also in absolute value, between the annual surplus or deficit in the budget projections and the change in the accumulated operating surplus or deficit reported in that year’s financial statements.7We used the projected surpluses or deficits shown in the budget numbers in financial statements. This approach is lenient, since those budget numbers are often restated. We did it for the sake of consistency across all the governments, since the budgets of Nova Scotia and the Northwest Territories did not provide PSAS-consistent projections for their annual surpluses or deficits. These differences, whatever their cause, are gaps between what legislators approved and what happened. We awarded a score of 3 to governments with gaps between actual changes in accumulated operating surplus or deficit and the projected annual surplus or deficit that, in absolute value, were less than or equal to 2 percent of budgeted expenses, 2 for gaps greater than 2 percent but no more than 4 percent of budgeted expenses, 1 for gaps greater than 4 percent but no more than 6 percent of budgeted expenses and 0 for gaps greater than 6 percent of budgeted expenses.
Comparability of Numbers
Readers of budgets will learn more if they can readily compare budget plans with results from previous financial statements and with the projected results for the fiscal year about to end.8When governments table budgets before the start of the fiscal year, as they should, the term “year about to end” applies literally: it is the then-current fiscal year. When governments table budgets after the start of the fiscal year, the year before has already ended, but unless a budget is scandalously late, the audited financial statements will not be ready, so the results for the previous year will still be projections. We awarded a score of 2 to governments that showed both historical results and projected results for the fiscal year about to end in their budget plans and 1 to governments that showed only projected results for the year about to end. We awarded 0 to governments that did not present these comparisons or presented comparisons using different accounting than they used in their financial statements.
Legislators should be able to understand how approving specific outlays in the estimates will affect projected consolidated expenses in the budget. We awarded a score of 2 to governments that presented a single document with estimates that matched the consolidated expenses in the budget. We awarded 1 to governments that presented estimates that did not match the budget but reconciled them with the budget; we also awarded 1 to governments that presented estimates that matched the budget but did not provide a reconciliation. We awarded 0 to governments that presented estimates that neither matched nor were reconciled with the projected consolidated expenses in the budget.
Public accounts should show budget comparisons alongside the statement of operations in their year-end financial statements. These comparisons are more useful when the budget numbers in the financial statements match those in the original budget.9Quoting again from the PSAB: “Actual financial performance needs to be compared with the originally approved budget of the entity. A comparison with a budget that has been updated to take into account transactions and other events occurring during the period significantly reduces the accountability value of the comparison. Such comparison may reduce differences and limit explanations of changes occurring throughout the period” (PSAB 2022, 6.31). We awarded a score of 2 to governments that showed budget numbers in their financial statements that matched those in the budget. We awarded 1 to governments that showed restated budget numbers for revenue and expense, but showed a reconciliation between the restated and the original numbers. We awarded 0 to governments that showed restated budget numbers and did not reconcile them to the original budget numbers.
The 2025 Report Card
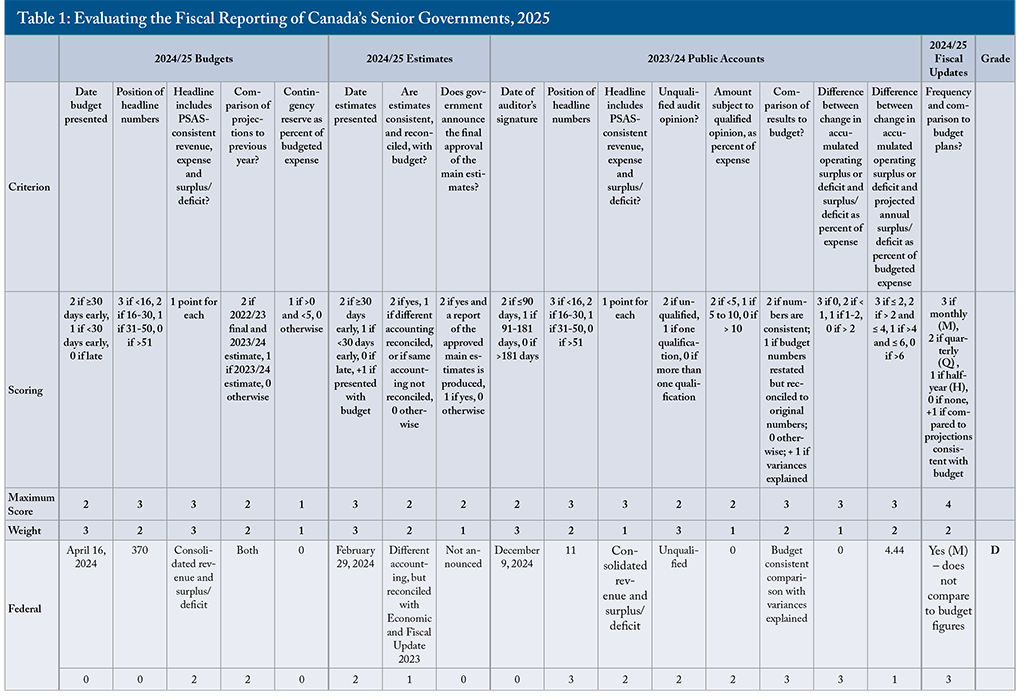
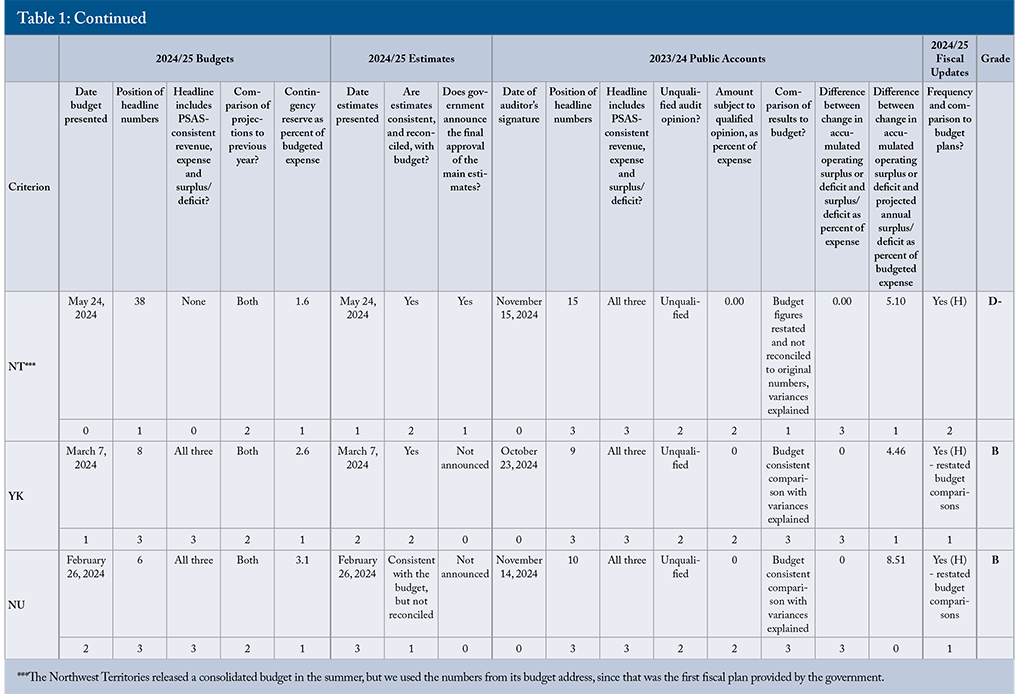
To calculate overall grades, we standardized the scores for each criterion to be between 0 and 1.10For example, if we awarded a score of 1 for a criterion with a maximum score of 2, the government’s standardized score on that criterion would be 0.50; if we awarded 1 for a criterion with a maximum score of 3, the government’s standardized score on it would be 0.33. Maximum scores include the additional point awarded for releasing estimates on the same day as the budget, for explaining variance from budget projections in the financial statements, and for comparing results to budget projections in fiscal updates. We then weighted the standardized score based on our judgment of each criterion’s importance and summed the weighted scores to produce a percentage.11Subjectivity is inevitable in any weighting system of this kind, and it is natural to wonder how sensitive the results are to the weights we chose. A simple test of their importance to our grades is to compare them with those that would have resulted from placing equal weight on each criterion. That exercise produces an average absolute change across the 14 governments of one degree – equal, for example, to a change in a score from B to B-. The correlation between the rankings using weighted and non-weighted criteria is 81 percent, while the correlation between the numerical grades using weighted and non-weighted criteria is 96 percent. We converted the percentages to letter grades on a standard scale: A+ for 90 percent or more, A for 85-89 percent, A- for 80-84 percent, B+ for 77-79 percent, B for 73-76 percent, B- for 70-72 percent, C+ for 67-69 percent, C for 63-66 percent, C- for 60-62 percent, D+ for 57-59 percent, D for 53-56 percent, D- for 50-52 percent and F for less than 50 percent. Our assessments for each criterion and the resulting letter grades for each government appear in Table 1.
The Grades from A+ to D-
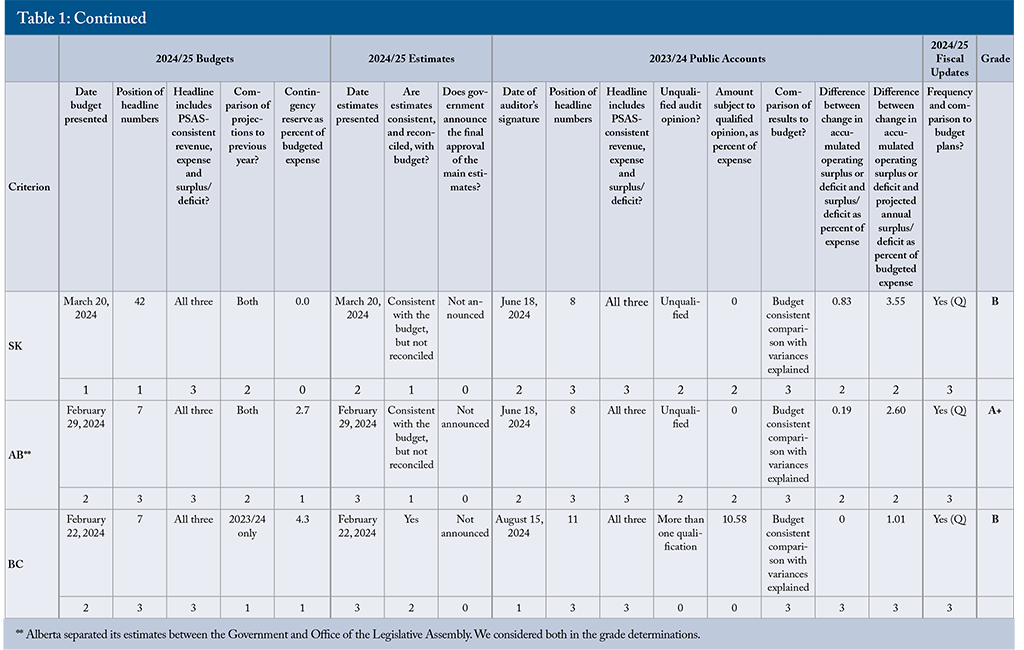
Alberta topped the class with an A+ grade. It tabled its budget more than 30 days before the start of the fiscal year simultaneously with its main estimates. It presented key numbers early in both its budget and public accounts and used consistent accounting in all its documents.12Alberta released two estimates documents: Government Estimates and Estimates for the Offices of the Legislative Assembly. Taken together, these documents reconcile with the budget, but any reader, expert or not, would find a single document easier to understand. Alberta also compared results to its original budget numbers and published in-year updates.
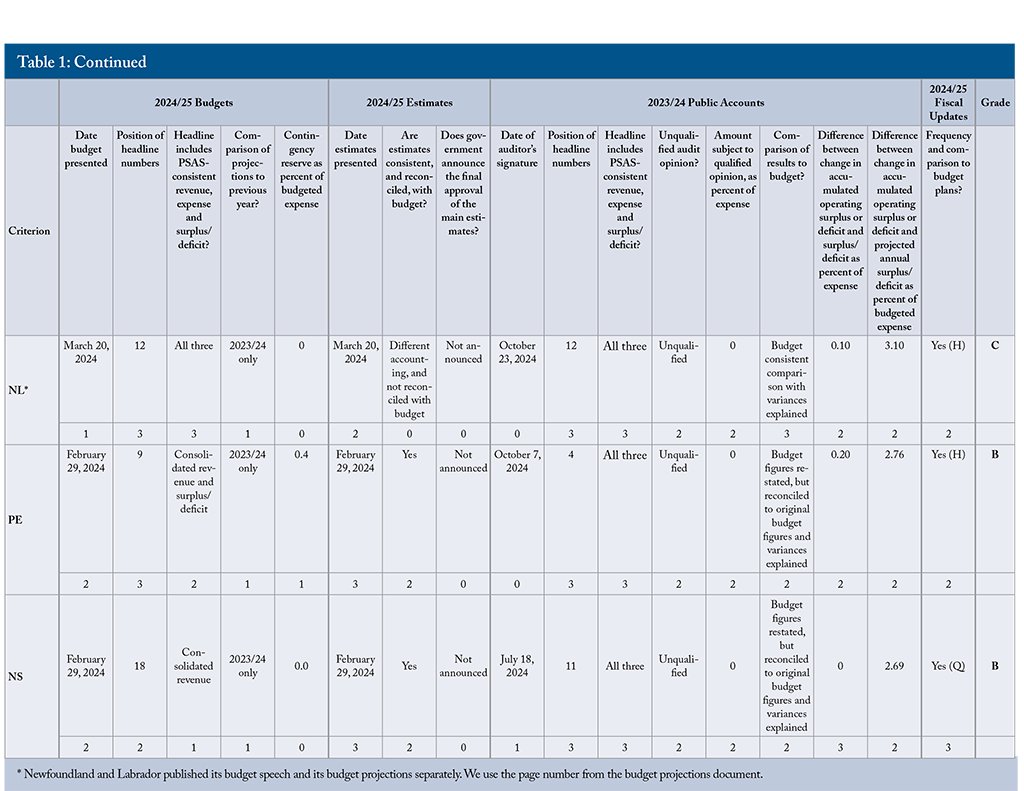
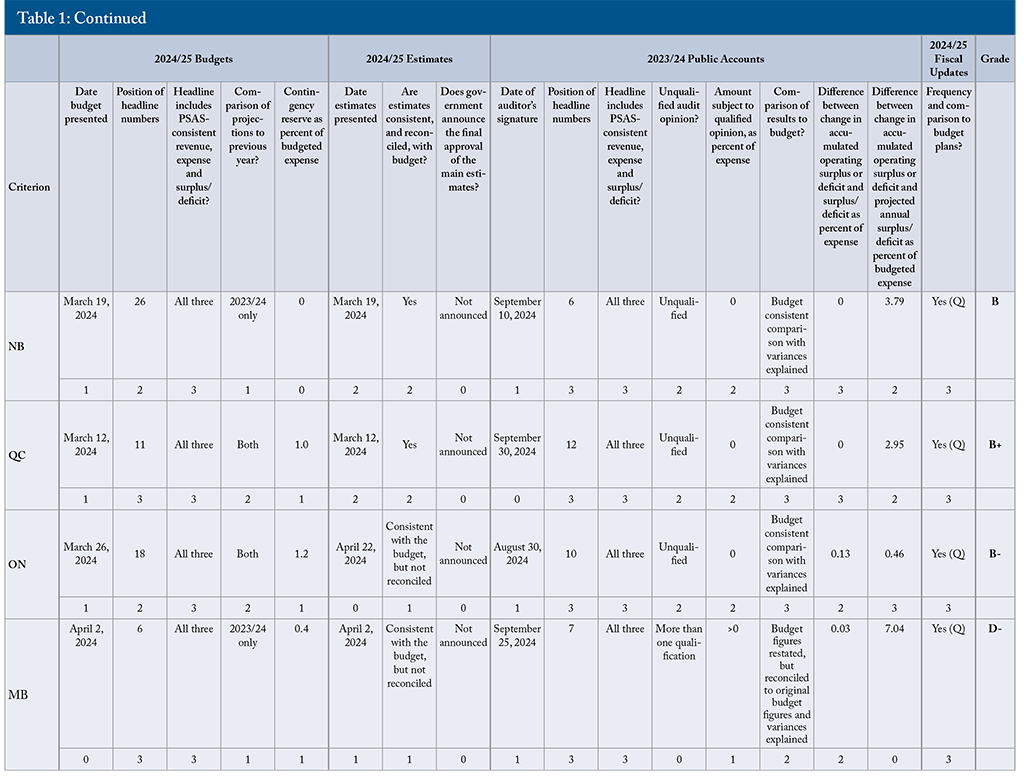
In the B tier were Quebec (B+), Prince Edward Island (B), Nova Scotia (B), New Brunswick (B), Saskatchewan (B), British Columbia (B), Yukon (B), Nunavut (B), and Ontario (B-). Except for Ontario, all presented their budgets and estimates simultaneously before the start of the fiscal year. Key numbers appeared early in their budgets and public accounts. Quebec, Ontario, Yukon and Nunavut showed forecasts for the year about to end, and results from 2022/23 alongside their budget projections. All except Nova Scotia and New Brunswick had modest contingency reserves in their budgets. All used consistent accounting in their main estimates. All except Prince Edward Island and Ontario had no gaps between their annual deficits and changes in their accumulated operating deficits.
Lack of timeliness was a frequent reason for B-level governments not achieving higher grades: Quebec’s auditor did not sign its financial statements until September 2024, and Ontario did not release its main estimates until after the start of the fiscal year. Incomplete or incompletely reconciled numbers were also a common problem. Nova Scotia and New Brunswick restated budget projections in their public accounts; and British Columbia got a qualified opinion from its auditor.13For consistency, we evaluated governments based on items referenced in the auditor’s opinion for the 2023/24 financial statements, even if the main focus of the qualification was not on that year. Yukon suffered from an unusually large gap between its projected and actual results.
Next were Newfoundland and Labrador with a C and the federal government with a D. Newfoundland and Labrador’s budget was timely, but its financial statements were late. The federal government was late with both. In addition, both governments presented estimates using different accounting than in their budgets and financial statements. The federal government buried the key numbers deep in its budget, failed to present consolidated expenses, and had a large gap between its projected and actual results.
At the bottom of the class were Manitoba and the Northwest Territories, each earning D- grades. Both governments had major problems with the timeliness of their budgets, estimates and public accounts. Manitoba’s financial statements received multiple qualifications from its auditor and it restated its budget projections in its public accounts. The Northwest Territories’ budget did not contain consolidated projections for revenue or expenses and its public accounts showed restated budget projections with no reconciliation to the original numbers.
Changes in Grading and Grades
Despite the problems just highlighted and the instances of backsliding we discuss below, the quality of financial reporting by Canada’s senior governments has tended to improve over the years. There has been more meaningful and consistent accounting in financial statements, better alignment with that presentation in budgets and, more recently, better alignment with that presentation in estimates as well.
Before the establishment of PSAS in the late 1980s, Canada’s senior governments largely budgeted and reported on a cash basis. They recorded revenues when cash flowed in and expenses when cash flowed out, even if the activity related to the receipts and payments did not occur in the relevant fiscal year. PSAS use accrual accounting, which records revenues and expenses when the relevant activity occurs. Amortizing long-lived assets over the period they deliver services, for example, makes more sense than showing their up-front cash costs, and recording deferred compensation such as pensions for government employees as it accrues makes more sense than showing it when the payments occur.
These governments first adopted PSAS in their year-end financial statements. Confusingly, they continued presenting budgets and estimates on a cash basis in the early years of PSAS, but most governments now present PSAS-basis budgets. Increasingly, they are moving to PSAS presentations and better reconciliations with PSAS in their estimates as well.
A troubling feature of most governments’ estimates process is that the main estimates get intermittent and often incomplete legislative attention. We cannot compare amounts formally approved across governments or over time, so we resort to high-level transparency measures of their estimates processes.
In last year’s report card, we asked if governments presented a formal timeline for the approval of their estimates. However, feedback from governments and other readers noted that presenting a timeline gives no comfort that the considerations and approvals will actually occur. Accordingly, this year we instead asked whether the government announced that the main estimates had been approved.
Another adjustment in this year’s report card is a change in the rounding used to convert percentages to letter grades. We previously required a percentage score to be at or above the relevant threshold for a given letter grade to award that grade. This year’s report card uses the more common convention of rounding decimal places of 0.5 or more up to the next whole number.
Changes in criteria and weights can affect governments’ relative standings. To gauge the size of those impacts, we compared each government’s 2025 grade with both its 2024 grade and with the grade it would have received in 2024 if that year’s report had used the current 2025 scoring system (Table 2).
Changes in our criteria and how we scored them matter, but not much. Only one government’s 2024 letter grade would have been different with the new system. The direction of every change between what we published in 2024 and this report card for 2025 reflect changes in governments’ financial reporting. On balance, positive changes were more common than negative ones.
Extending this comparison further into the past allows for some more observations. Although New Brunswick’s overall score has slipped, it has a strong record for presenting timely budgets. For several years, it was unique in presenting a January budget, and it has consistently presented its budget before the start of the fiscal year. Saskatchewan’s strong record is also worth noting – a result of timeliness, prominent presentation of key numbers, clean audits and small gaps between annual results and changes in accumulated operating deficit. Alberta has been a solid performer for years, and timeliness helped it top the class this year.
British Columbia was an A-level performer in the past but has slipped lately. The size of the discrepancy flagged by its auditor general is an ongoing problem. Timelier budgets have moved Yukon up from the C tier to a top performer in recent years. February tabling of budgets helped Prince Edward Island and Nova Scotia move up this year.
The federal government’s grade slipped this year. Hurting it were its exclusion of amortization of pension costs from expenses in its main presentations, key numbers buried hundreds of pages deep in its budget, inconsistent accounting in its estimates and the December release of its financial statements.

The 2025/26 Budget Cycle and a Preview of 2026 Results
The timing of this report allows a preview of next year’s scores based on the 2025/26 budget round. The bad news is some deterioration in the timeliness of budgets and estimates. Three provinces failed to table budgets before the start of the fiscal year and the federal government’s announcement of a budget in November of 2025 means it has effectively produced no budget for the 2025/26 fiscal year.
This slippage in timing is a reminder that past improvements in fiscal accountability are no guarantee of future improvements. Four of the 13 senior governments that tabled budgets at the time of writing failed to show consolidated expenses in their budgets. Newfoundland and Labrador did not use consistent accounting in its budget and estimates, and only half of Canada’s senior governments reconciled their main estimates with their budget projections.
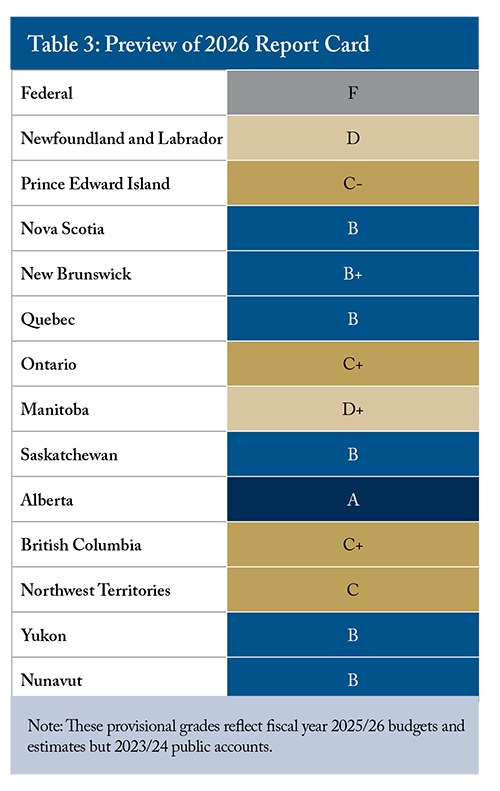
Table 3 shows our preliminary grades for next year’s report card. The grades reflect an update of the scores in Table 1, using fiscal year 2025/26 budgets and estimates, assuming the same performance in each government’s 2024/25 public accounts (not all of which were available at the time of writing) as its performance in 2023/24. The final scores will depend on the timing and quality of each government’s public accounts, but based on the beginning-of-year documents, the federal government would get an F, while Alberta would top the class again with an A.
Does Fiscal Accountability Matter?
Timely, reliable and accessible financial reports are critical links in the chain of accountability that ensures governments serve the public interest. Without them, citizens and taxpayers, and the legislators who represent them, lack key information about what governments are planning, how they performed relative to their plans, or the consequences of their performance for their future capacity to deliver services. Good numbers alone cannot guarantee accountability, but they give citizens, taxpayers and legislators an essential foundation for understanding fiscal plans, monitoring progress and addressing problems.
Budget Hits and Misses
Canada’s senior governments have a notable tendency to overshoot their budget targets. Over the past couple of decades, both revenues and expenses have come in over budget projections far more often than not.14Robson and Wu (2021) document this phenomenon; Robson (2020) discusses it for healthcare spending in particular. The COVID-19 crisis triggered massive increases in spending and borrowing, particularly by the federal government. Governments provided far too little information about how the money was spent and about how much of the resulting deviations from budget plans resulted from COVID particularly, or reflected other fiscal decisions that coincided with, or occurred under cover from, the pandemic (Robson and Dahir 2023).
The deterioration in governments’ fiscal capacity since then will make scrutiny of their finances more intense in the years ahead. Ensuring that fiscal plans accurately inform decision-makers about the consequences of their revenue and expense choices is critical to maintaining diligent stewardship of public funds. Estimates that are timelier and more consistent with budgets, and interim reports and financial statements that allow easier comparisons between intentions and results, could help contain the gap between targets and results in the future.
Financial Reporting Affects Decisions
Because financial documents are tools for decision-making, poor presentations have real-world consequences. Municipal financial management offers an example. Although cities’ financial statements are consistent with PSAS, most cities’ budgets are not (Robson and Dahir 2025), with cash accounting for capital being common. The daunting up-front outlays cash accounting produces in municipal budgets likely discourage capital investments in general and encourage excessive upfront charges for the projects that do proceed. Notwithstanding annual angst about city budgets, the financial statements of most Canadian municipalities show sizable surpluses, and many have excessive holdings of financial assets because they collected money for capital projects far in advance of the actual outlays. Budgets prepared using the same accounting standards and presentations as financial statements could help cities tax and spend more effectively. The same is true for senior governments.
Disagreements over financial presentations offer indirect but powerful testimony to their importance. Why would governments fight with their legislative auditors and risk qualified opinions unless a misleading presentation offers some political reward?
When the PSAS were newer in the 1990s, auditors’ reservations were more common. Salient examples occurred at the federal level in the late 1990s and early 2000s when Ottawa pre-booked increasingly large amounts of spending, artificially reducing surpluses (Robson 1999). As the auditor general complained (see, for example, Receiver General for Canada 2001, 1.29-1.34), the federal government’s financial statements reflected neither what Parliament voted nor the government’s true fiscal position. Here, also, misleading financial documents distorted real-world decisions. Ottawa taxed more and spent more on programs that lent themselves to financial manipulation than it would have done had it shown better information.
Ontario and Quebec provide more recent examples of problematic accounting. Ontario had two years of qualified opinions from its auditor general – in 2015/16 and 2016/17 for including pension plan assets that the government did not control and in 2016/17 for treating accounts of its Independent Electricity System Operator as assets. Subsequently, Ontario’s 2017/18 financial statements garnered an unqualified opinion – and showed a larger deficit than the previous treatment would have done.
Quebec’s auditor general issued qualified opinions on the province’s financial statements each year between 2012/13 and 2019/20, noting that the government was not properly reporting subsidies to third parties for the construction of fixed assets and other expenditures. By the end of the period, the auditor estimated an understatement of the province’s accumulated deficit of nearly $13 billion (Vérificateur général du Québec 2022).
A current example of muddying the waters is the federal government’s decision to move the amortization of its unfunded pension liabilities out of compensation costs in the expense numbers of its budgets, public accounts and fiscal monitors, instead showing them as a charge below a conceptual “operational balance” line. This presentation diverts attention from a major component of the cost of federal employees (Laurin and Robson 2020). It also makes these charges look like the result of circumstances outside the government’s control, which they are not. The government records its accruing pension obligations using an unrealistically high discount rate that reduces the present value of those future obligations. As later valuations adopt more reasonable rates, the obligations will need to be revised upward to reflect what should have been recorded in the first place. Although the federal auditor general has not objected to this presentation – the pension costs do appear in other tallies of expenses and in the deficit – it remains an unfortunate example of a government taking advantage of the complexities of pension accounting to flatter its performance.
In all three of these instances, it is fair to ask if the governments concerned wanted better-looking bottom lines than cleaner presentations would have produced, to provide cover for more spending and/or lower revenues than they would otherwise have felt obliged to achieve.
Improving Fiscal Accountability in Canada
The good news is that many of Canada’s senior governments have improved their financial presentations and, before the pandemic, tended to achieve results closer to their budget projections. The bad news is continuing tension between the requirements of good financial reports and obscure, misleading or missing numbers. We conclude our 2025 report card with some suggestions to improve transparency and accountability.
All Documents Should Follow PSAS
All Canada’s senior governments should publish financial statements that are consistent with PSAS and that highlight consolidated revenues, expenses and surpluses or deficits. Budgets, estimates and in-year updates should also follow PSAS and provide tables and explanations for changes from past results and deviations from past projections. In particular, presenting the estimates on a PSAS basis also facilitates the approval process, as committee members and legislators can easily compare the estimates within the context of the fiscal plan and against past projections and results.
Governments Should Present Budgets Before the Start of the Fiscal Year
Budgets should be timely, giving time to understand and respond to – and, in the case of legislators, vote on – the fiscal plan before the year is already underway. It is an affront to accountability to ask legislators to approve a plan after money has already been spent. Elections, events such as natural disasters, and other uncertainties do not justify doing an end-run around the legislature. Provincial legislation requires tabling Alberta’s budget in February, a deadline it achieved in fiscal 2024/25.
Our preference is for a legislated budget date, preferably before the end of January.15The OECD (2002) says governments submit draft budgets – equivalent to the actual budget in Canadian practice – no less than three months before the fiscal year starts, and legislators should approve the budget – the estimates in Canadian practice – before the fiscal year starts. For its part, the independent International Budget Partnership’s Open Budget Survey on Canada’s federal government says Ottawa should “[e]nsure the Executive’s Budget Proposal is provided to legislators at least two months before the start of the budget year and that the budget proposal and the Main Estimates are better aligned” (International Budget Partnership 2020). Timeliness is particularly important for the federal government, since its transfers to provinces and territories are material in provincial and territorial budgets. Indeed, provinces and territories have often cited late federal budgets to justify their own tardiness. The federal government’s proposed shift to a November budget cycle would address this concern, but we do not know if this new schedule will prove more durable than its predecessors.
Estimates Should Reconcile with Budgets and Receive Timely Consideration
Governments that present estimates inconsistent with their budgets and/or their financial statements create information gaps for legislators. Showing consolidated expenses on the same accounting basis as the budget, with clear reconciliation of any aggregation differences between the two, gives them important context.
For similar reasons, governments should release their main estimates simultaneously with their budgets. Many provinces already do so, and countries with comparable legislative systems – such as Australia and New Zealand – release estimates consistent with their budget projections simultaneously with their budgets (House of Commons 2019). All Canada’s senior governments should follow this example.
Consistent accounting and timely release mean less if legislators do not study and approve the main estimates. This important link in legislative control happens largely out of public view and does not appear to function reliably. The federal government has a process that often appears perfunctory (House of Commons 2019): major sums are routinely deemed approved rather than scrutinized by the relevant legislative committee.16Moss, Neil. 2024. “Ten Parliamentary Committees Forgo Scrutiny of $25-Billion in Spending Estimates.” The Hill Times. June 19. https://www.hilltimes.com/story/2024/06/19/ten-parliamentary-committees-forgo-scrutiny-of-25-billion-in-spending-estimates/425697/.
Ideally, main estimates should include a schedule of the process from tabling to approval, and governments would publish comparisons of what was initially tabled versus what was approved by committees and the legislature in the context of the overall fiscal plan.17Saskatchewan provided a document that tracks the progress of the main estimates, noting when they are tabled, linking which items in the tabled document pertain to which committees, recording when they are referred, reviewed and finally approved. However, this document was updated as the elements of the main estimates are approved. Only continual monitoring would let a member of the legislative assembly or a citizen know if or when the main estimates had been approved. Pending such a reform, our approach to the estimates in this report card departs from our general approach of grading the contents of the documents themselves. Our alternative criterion – looking for announcements of approval of the main estimates – reveals problems. Only one government, the Northwest Territories, issued a clear press release announcing the legislature’s approval of the main estimates. No government provided an accessible summary of the differences between the estimates tabled and approved.
Key Numbers Should Be Accessible and Recognizable
Relevant and accurate numbers are less useful if readers cannot easily find them. Clearly labelled numbers in the opening pages of a document help understanding and engagement. Obscure numbers hundreds of pages deep, or tucked away in an annex, do not.
In this respect, we urge governments to declutter their budgets. The federal government has for years set a terrible example by burying the key revenue, expense and deficit numbers in an annex, after hundreds of pages of political spin, repetition and irrelevant material. Experts know to keep searching until they find the summary statement of transactions that includes the effects of the budget measures. A non-expert exploring the budget might give up before finding the numbers – or find them but think such obscurely placed numbers must not be important. The federal public accounts feature the key numbers prominently and early; federal budgets should be the same.
The presentation of prudent financial cushions and contingency reserves also requires attention. Although we prefer explicit amounts to less transparent approaches such as downward-biased revenue projections, their size must be reasonable and they should appear in the fiscal plan in a format that indicates they are there to protect a target for the surplus or deficit and are not cash reserves for a government to spend as it pleases.
Year-End Results Should Be Timely
Every organization needs timely information to detect and fix problems. The public accounts of Canada’s senior governments let legislators and citizens compare end-of-year results with budget plans to see if the government fulfilled its promises and to understand the size of, and reasons for, deviations from targets. Quick production of financial statements encourages faster gathering and compilation of data, which should improve the quality of the numbers in the budget plan for the year underway and, by extension, for the baseline fiscal position in the future.
At the beginning of this century, the OECD (2002) recommended publishing audited financial statements no more than six months after year-end to allow legislators to scrutinize the prior year’s outcomes before voting on the next budget. With improvements in information technology since then, we think that the interval between year-end and publishing of financial statements should be no more than six months, and three months would be a reasonable standard.18The Ontario Securities Commission’s deadline for annual results from listed companies is three months after year-end (OSC 2024). Former federal auditor general Michael Ferguson (2017) has elaborated on this point with reference to the federal government: We all know how much work it takes to prepare and audit a set of financial statements for a senior government. But I looked at the financial statements of Exxon Mobile Corporation for the year ended 31 December 2016. Over the years 2012 to 2016, Exxon had revenue of between $451 billion and $219 billion, which is in the same range as the Government of Canada’s revenue totaling about $293 billion for the year ended 31 March 2017. In Exxon’s management discussion and analysis, about seven pages explain critical estimates and uncertainties they have to deal with in their accounting. They have to make estimates in complex areas, such as oil and natural gas reserves, impairments, asset retirement obligations, suspended exploratory well costs and tax contingencies. Let us also not forget that their financial information will be relied on by users to make investment decisions. Despite all that, Exxon’s audit report for its 31 December 2016 financial statements is dated 22 February 2017, less than two months after its year-end. Governments should reform any practices that impede timely presentation, such as Newfoundland and Labrador’s relatively late date for final recording of transactions. Faster production of tax data by the federal government would help the other governments that rely on it to produce their own statements.
Alberta requires its public accounts to appear before the end of June, but most governments receive their auditor’s approval and produce their reports far later. Ontario’s legislated date for tabling its public accounts is 180 days after the end of the fiscal year – September 27 – while Manitoba’s deadline is September 30.
The federal government’s legislated date for tabling its public accounts is December 31. That is too late – and if federal budgets appear in November each year, it could let governments present budgets without final numbers, not just for the year about to end, but for the year before it. The Parliamentary Budget Officer’s criticism of the December 2021 release of the 2020/21 public accounts included a recommendation of the end of September as a new deadline (PBO 2022). Why not the end of August, July or even June? In our view, September 30 should be the latest date on which any government tables and releases its public accounts, with releases before the end of June being ideal.
Legislators Should Review the Public Accounts
Legislative oversight is no less important at the end of the fiscal cycle than at the beginning. Most senior legislatures have a standing committee with responsibility for scrutinizing governmental effectiveness and efficiency, ensuring that the public accounts are timely and accurate, and taking up concerns raised by the relevant auditor general.
Legislative scrutiny can help ensure that the differences between the annual surplus or deficit – on which members have more direct say – and the changes in a government’s accumulated operating surplus or deficit are not too big. When they are big, legislators should ask why. If a change in PSAS has brought something to light – a previously undisclosed obligation, for example – proper stewardship of public money requires legislators to understand the issue and act if they learn that the government’s capacity to deliver public services is subject to a risk that never appeared in a budget. If a government owns assets, such as financial instruments or Crown corporations, or has liabilities that might be bigger than what it has been reporting, legislators cannot vote on budgets confident that they understand what the government’s position will be at the end of the year. Divesting or otherwise simplifying the government’s balance sheet would give them greater control.
Canada’s Senior Governments Should Do Better
Canada’s senior governments play a massive role in our economy and our lives. The chains of accountability that link citizens’ wishes through their elected representatives with the officials who tax, regulate and serve them are long and complicated. Reliable and accessible numbers are essential links in that chain.
A motivated but non-expert citizen seeking to understand a government’s fiscal situation and plans should be confident in identifying the key numbers in budgets, estimates and public accounts. The user of those documents should be able to see what that government plans to do before the year starts and to compare that with what it did shortly after the year has ended.
As this report card shows, governments that do not meet these standards could make some straightforward changes to improve. The grades of the top performers reflect consolidated financial statements consistent with PSAS, and budgets, estimates and interim reports prepared on the same basis. All governments can do that. They also reflect presentations that make the key numbers readily accessible early in the relevant documents. All governments can do that. And they reflect timely presentations: budgets presented before the fiscal year starts and public accounts tabled shortly after fiscal year-end. All governments can do that.
Modern social media message control in the offices of premiers and prime ministers does not help the officials and elected representatives who take their work on budgets, estimates and public accounts seriously. But legislatures have the power to scrutinize and decline to consent, if they choose to use it. The impairment of governments’ fiscal capacity post-pandemic, combined with upward pressure on demographically sensitive program costs and revenues constrained by slower economic growth, will likely raise the profile of this work in the future. The attention garnered by reports of legislative auditors – and by this annual C.D. Howe Institute report card – shows that people who insist on transparency and accountability for public funds can make a difference.
For legislators to effectively fulfill their role as responsible stewards of public money, they need better financial reporting. If Canadians insist on better financial reporting from their governments, they can get it.
The authors extend gratitude to Alexandre Laurin, John Lester, Jim McCarter, Khal Noor, and several anonymous referees for valuable comments and suggestions. The authors retain responsibility for any errors and the views expressed.
References
See the Online Appendix for Budget, Public Accounts and Estimates Documents Referenced.
Ferguson, Michael. 2017. “Why Is More Attention Not Paid to Government Financial Statements?” Presentation to the CPA Canada Public Sector Conference. Ottawa. October 23.
House of Commons. Standing Committee on Government Operations and Estimates. 2019. Improving Transparency and Parliamentary Oversight of the Government’s Spending Plans. 16th Report, 42nd Parliament, 1st Session. Ottawa: House of Commons. January. https://www.ourcommons.ca/DocumentViewer/en/42-1/OGGO/report-16.
International Budget Partnership. 2020. The Open Budget Survey 2019. Washington, DC.
______________. 2024. The Open Budget Survey 2023. Washington, DC.
Laurin, Alexandre, and William B.P. Robson. 2020. “Under the Rug: The Pitfalls of an ‘Operating Balance’ Approach for Reporting Federal Employee Pension Obligations.” E-Brief 309. Toronto: C.D. Howe Institute. November. https://cdhowe.org/publication/under-rug-pitfalls-operating-balance-approach-reporting-federal-employee-pension-obligations.
Office of the Parliamentary Budget Officer (PBO). 2022. Economic and Fiscal Update 2021: Issues for Parliamentarians. Ottawa: Government of Canada. January 19. https://www.pbo-dpb.ca/web/default/files/Documents/Reports/RP-2122-027-S_E.pdf.
Ontario Securities Commission (OSC). 2025. “Filing Due Dates Calendar for Annual and Interim Filings by Reporting Issuers.” Ontario Securities Commission. https://www.osc.ca/en/industry/companies/reporting-issuer-and-issuer-forms/filing-due-dates-calendar-annual-and-interim-filings-reporting-issuers.
Organisation for Economic Co-operation and Development (OECD). 2002. OECD Best Practices for Budget Transparency. Paris. https://internationalbudget.org/wp-content/uploads/OECD-Best-Practices-for-Budget-Transparency.pdf.
Public Sector Accounting Board (PSAB). 2022. The Conceptual Framework for Financial Reporting in the Public Sector. December.
Receiver General for Canada. 2001. Public Accounts of Canada 2001, Volume I. Ottawa: Government of Canada. September.
Robson, William B.P. 1999. “Hiding the Good News: Ottawa’s Book-Cooking Is a Troubling Sign for the Future.” Backgrounder. Toronto: C.D. Howe Institute. February. https://cdhowe.org/publication/hiding-good-news-ottawas-book-cooking-troubling-sign-future.
______________. 2020. There Is No Try: Sustainable Healthcare Requires Reining in Spending Overshoots. Commentary 566. Toronto: C.D. Howe Institute. February. https://cdhowe.org/publication/there-no-try-sustainable-healthcare-requires-reining-spending-overshoots.
Robson, William B.P., and Miles Wu. 2021. Trouble on the Bottom Line: Canada’s Governments Must Produce More Reliable Budgets. Commentary 611. Toronto: C.D. Howe Institute. November. https://cdhowe.org/publication/trouble-bottom-line-canadas-governments-must-produce-more-reliable-budgets.
Robson, William B.P., and Nicholas Dahir. 2023. Fiscal COVID: The Pandemic’s Impact on Government Finances and Accountability in Canada. Commentary 643. Toronto: C.D. Howe Institute. July. https://cdhowe.org/publication/fiscal-covid-pandemics-impact-government-finances-and-accountability-canada.
______________. 2025. Could Do Better: Grading the Fiscal Accountability of Canada’s Municipalities, 2024. Commentary 681. Toronto: C.D. Howe Institute. April. https://cdhowe.org/publication/could-do-better-grading-fiscal-accountability-canadas-municipalities-2024.
Vérificateur général du Québec. 2022. Rapport du Vérificateur général du Québec à l’Assemblée nationale pour l’année 2021–2022. Quebec City. March.