





by Roger Pizarro Milian, David Zarifa, David Walters and Fatemeh Ameli
- This Commentary examines how bachelor’s degree outcomes vary across Ontario institutional types, focusing on graduates’ early-career earnings and participation in graduate and second-entry programs.
- Among bachelor’s degree graduates who enter the labour market directly, early-career earnings are broadly similar across institutional types. Graduates of medical doctoral universities earn modestly more than graduates of other institutional types, while earnings are largely comparable across comprehensive universities, primarily undergraduate universities, and colleges.
- Graduates of medical doctoral universities are also substantially more likely to enrol in graduate and second-entry programs than graduates of other institutional types, while college bachelor’s graduates are much less likely to pursue these pathways.
Roger Pizarro Milian is Assistant Director of Student Data and Advanced Analytics at the University of Toronto. This research was conducted independently of that role, received no funding from the university, and does not represent its views.
This research was conducted at McMaster University’s Research Data Centre, which is part of the Canadian Research Data Centre Network (CRDCN). The authors are grateful for the valuable feedback provided by anonymous reviewers, which markedly improved the contents of this report. As always, remaining errors and omissions are our sole responsibility. Any opinions or recommendations expressed through this report are solely those of the authors and should not be assumed to reflect those of their employers, the C.D. Howe Institute, or other affiliated organizations.
Introduction
Does it matter where you get your bachelor’s degree from? Is there a detectable advantage to graduating from one type of institution over another? This question has preoccupied researchers across several countries for decades.
For prospective students and their families, understanding which institutions offer the strongest labour market returns can help them evaluate their options. Survey data show that employability is top of mind for many applicants to Canadian colleges and universities (e.g., Crocker, Hall, and Janzen 2025), despite sparse information being available on this topic. In jurisdictions like Ontario, the complexity of the degree-granting market has only grown in recent decades (Skolnik et al. 2018), as colleges have also been granted the authority to offer bachelor’s degrees in applied areas of study (e.g., business, health, technology) – an opportunity that some institutions are embracing with open arms. Information on graduate employment outcomes is particularly useful for families from lower socio-economic backgrounds that may lack in-depth knowledge of, or personal experience with, the postsecondary education
(PSE) system.
For institutions, the employment outcomes of recent graduates directly influence their standing in certain influential international rankings (such as the QS World University Rankings), while also serving as a valuable signal for attracting prospective students. Information on graduates’ labour market outcomes also serves as a key factor during program feasibility studies and cyclical reviews at many institutions. In Ontario, indicators like median employment earnings and employment rates in a related field of study were also key performance indicators in the third iteration of the Strategic Mandate Agreements (SMA3) between the province and its 45 publicly assisted colleges and universities.1SMAs are a key component of the province’s accountability framework. They are designed to focus institutional attention on initiatives that will drive specialization in pre-existing areas of strength and improve graduate employability, among other factors. These indicators are also included in the SMA4, the current iteration of the agreements, which is in place from 2025 to 2030.
Lastly, and perhaps most importantly, for policymakers entrusted with the governance of the PSE system, graduate labour market outcomes indicate whether institutions are adequately preparing students to succeed in the world of work. In times of fiscal constraint, when difficult decisions must be made about public resource allocation, evidence on which programs facilitate graduate success can inform discussions about system reforms. Given the value of this information to a wide range of stakeholders, it is both unfortunate and surprising that we know so little about how the labour market outcomes of graduates vary in Ontario based on where they obtain their bachelor’s degrees. To date, the authors are aware of only a handful of academic studies that explore this topic in Canada. Public reporting of these outcomes at the institutional level also remains minimal.
This report begins with an updated review of the existing academic literature on institution-based differentials in the labour market outcomes of bachelor’s degree graduates. We then present early findings from a broader project that analyzes patterns in the early earnings and educational trajectories of bachelor’s degree graduates across Ontario colleges and universities, drawing on Statistics Canada’s Education and Labour Market Longitudinal Platform (ELMLP). Our empirical analyses indicate that graduates from “medical doctoral” universities outperform their peers across both these measures. However, there is relative parity among the remaining institutional types, including “comprehensive” universities and “primarily undergraduate” universities, as well as colleges.2Table 1 defines each of these institutional types. Notably, graduates from these three institutional types who directly enter the labour market earn roughly the same amount three years after graduation – net of demographic, academic, and other available controls. This pattern runs counter to long-standing stereotypes that portray Ontario colleges as “second-rate” options (Colleges Ontario 2009; HESA 2012; Panacci 2014). At the same time, we observe that graduates of university bachelor’s degree programs are more likely to enrol shortly after graduation in coveted graduate and second-entry programs (e.g., law, pharmacy), many of which are known to have excellent long-term earnings trajectories.
Our findings have important policy implications. First, the modest net earnings differences observed across institutional types raise the question of whether, for most of the students intending to directly enter the labour market after bachelor’s degree completion, attending a higher-status university in Ontario justifies the costs (e.g., housing, food) associated with geographic relocation. This finding arguably supports efforts to further localize participation in undergraduate-level education in Ontario. At the same time, the parity we observe across broad institutional types suggests Ontario’s differentiation policy should be guided by far more granular, program-level information.3Ontario’s differentiation policy is the province’s strategy of encouraging colleges and universities to develop distinct institutional missions and areas of strength, rather than duplicating one another. The policy is implemented primarily through SMAs between the province and publicly assisted institutions. Second, the relatively strong earnings performance of college bachelor’s graduates indicates that these programs have not evolved into a lower-tier credential, as some initially feared (e.g., Marshall 2008), and partially validates the provincial government’s decision to extend degree-granting authority to the college sector. Third, the large disparities in graduate and second-entry program participation highlight the need for future research to examine potential structural or perceptual barriers faced by college graduates and consider strategies to improve their skills development.
Institutional Hierarchies and Graduate Outcomes
Conventional wisdom suggests that Canadian universities enjoy comparable levels of prestige, contrasting the steep hierarchies that exist in the American and some stratified European higher education systems, such as those in France and the United Kingdom (e.g., Davies and Hammack 2005; Davies and Zarifa 2012; Pizarro Milian and Zarifa 2023). In the latter systems, elite universities tend to tower over their peers in reputation, admissions selectivity, and financial resources. There is also some evidence that these institution-level differences translate into variation in graduates’ labour market outcomes, even net of high school grades and demographics (e.g., Eide, Brewer, and Ehrenberg 1998; Witteveen and Attewell 2017).4There has also been contradictory evidence produced by the likes of Dale and Krueger (2014). Most recently in the United States, Chetty, Deming, and Friedman (2023) estimated that graduating from an “Ivy Plus” institution5“Ivy Plus” is defined by Chetty et al. (2023) as consisting of the Ivy League, a group of eight highly selective US universities, plus a small number of other elite institutions (such as Stanford, MIT, Chicago, and Duke). rather than an average public flagship university made individuals 50 percent more likely to reach the top 1 percent of the earnings distribution, almost doubled their chances of enrolling in an elite graduate program, and nearly tripled their odds of working at a prestigious firm.6There is also evidence that various actors alter their behaviour in response to these steep national institutional hierarchies, as families go to great lengths to help their children gain admission into elite universities in the hopes of securing them lifelong advantages (e.g., Aurini, Pizarro Milian and Missaghian 2023; Stevens 2009). These are sizable net labour market advantages that are not commonly observed in other jurisdictions.
North of the border, the datasets available to the research community – such as the National Graduates Survey (NGS), Labour Force Survey (LFS), and census – have not historically contained the identifiers required to report graduate labour outcomes at the institutional level. Other data sources containing this information, such as the Ontario University Graduates Survey (OUGS), have not been made accessible to the research community. As a result, researchers have produced only limited labour market information at this level. In Ontario, the provincial government first required colleges and universities to report their graduates’ median employment earnings two years after graduation during the third round of the Strategic Mandate Agreements (2020-25) (see Figure 1). These estimates are produced using Statistics Canada’s Education and Labour Market Longitudinal Platform (ELMLP), a new platform that provides access to administrative enrolment files (with institutional identifiers) for nearly every publicly funded post-secondary institution in Canada, linked to federal income tax records.
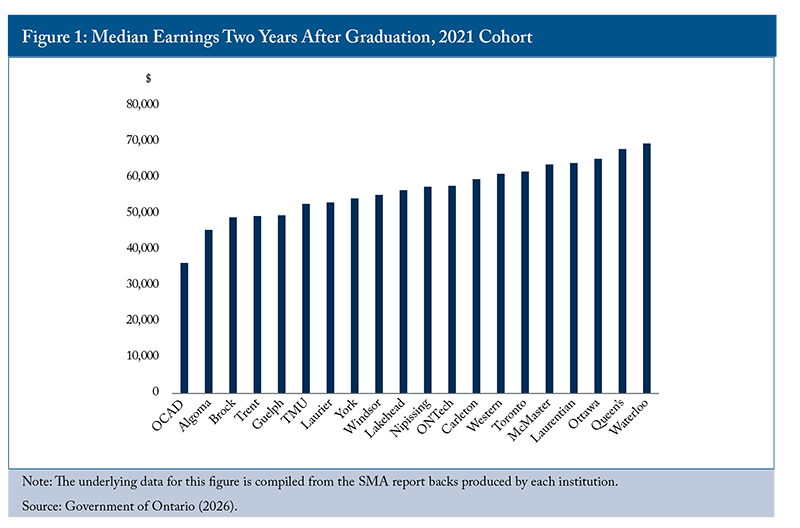
While this recent reporting is a useful step toward accountability and transparency, it has notable limitations for assessing institutional variation in graduate employment outcomes. First, it combines entire graduating cohorts regardless of the credential they acquired. Since the credential mix at each institution varies markedly, both by credential level and field of study, these are “apples-to-oranges” comparisons. Second, these estimates do not account for the substantial variation in the demographic composition and regional labour markets entered by graduates from each institution. As such, they provide no clear sense of institutional differences in earnings or other outcomes net of these confounders.
Perhaps unsurprisingly, given the dearth of available data sources, empirical studies modelling institutional variation in graduate labour market outcomes in Canada are sparse. Betts, Ferrall, and Finnie’s (2013) analyses of the 1982, 1986, and 1990 National Graduate Surveys7Betts et al. (2013) were granted special access to university identifiers with the NGS that, as far as we know, no other researchers have ever been granted. led them to conclude that: “Certainly, Canadian universities are spread quite widely in terms of earnings of their graduates. But visual inspection suggests that the national system is not characterized by a handful of universities that completely dominate all the rest” (p. S100). More recently, Milla (2018) examined variation in university bachelor’s graduate earnings across the selectivity continuum in Canada using data from the Youth in Transition Survey – the only survey in Canada of which we are aware that has traditionally contained institutional identifiers. She found that graduating from more selective medical doctoral or comprehensive universities was associated with a 6-7 percent earnings premium relative to graduating from less selective universities within those categories and from primarily undergraduate universities.
In the most recent Canadian study of this genre, Zarifa, Sano, and Pizarro Milian (2025) leveraged the ELMLP to examine the relationship between a university’s position in the Maclean’s magazine rankings and annual earnings among university bachelor’s graduates during the 2010-2015 period. They found that a one-place improvement in the rankings was associated with only a 0.3 percent net increase in graduates’ annual earnings one and five years post-graduation, with meaningful differences appearing only when comparing universities at opposite ends of the prestige spectrum. A limitation of that study is that, by focusing on year-to-year changes in university rank, it did not capture differences between general types of universities (e.g., research versus teaching-intensive), or between university and college bachelor’s degree graduates.
The fact that colleges across multiple provinces are now offering bachelor’s degrees adds further complexity to both student decision-making and empirical research on the returns to these credentials in Canada. In Ontario, several factors prompted the provincial government to authorize public colleges to grant bachelor’s degrees in the early 2000s. First, employers have increasingly flagged chronic skills shortages in fields (e.g., engineering, nursing) traditionally served by bachelor’s-level education (e.g., ManpowerGroup 2025; Menardi, Sood, and Johnston 2026). Second, policymakers recognized that expanding existing universities to address the growing demand for bachelor’s degrees was not fiscally sustainable (Clark et al. 2009), and that building on the existing infrastructure within the college sector represents a “more economical” approach (Skolnik 2012, p. 2; Jones and Skolnik 2009). These factors prompted the provincial government to pass the Post-secondary Education Excellence and Choice Act in 2000, granting Ontario colleges the authority to offer bachelor’s degrees in applied areas with demonstrated labour market demand. A primary distinction between college and university bachelor’s degrees beyond the former’s practical orientation is that college degrees must include work placements relevant to the field of study totalling at least 14 weeks of full-time work (Wheelahan et al. 2017). No similar requirement exists for universities, despite many institutions investing heavily in co-op and internship programs (Peters and Pizarro Milian 2024) and leveraging these programs for recruitment purposes.8It is also worth noting that Ontario SMA agreements now include participation in experiential learning as a key performance indicator, a decision that has arguably augmented pressures for universities to systematically embed these experiences into degrees. To date, however, questions remain about whether this strategy has created a tiered degree system in Ontario (e.g., Colyar, Brumwell and Deakin 2022; Marshall 2008), whereby some students earn credentials with lower labour market value.
Using linked administrative graduate and income tax data, Frenette (2019) provided the first detailed comparison of the early earnings disparities associated with college and university bachelor’s degrees across three provinces in Canada. He found that college bachelor’s degree holders earned about 12 percent more annually than university counterparts. However, this gap reversed, with university graduates earning $1,000 more, once differences in field of study were taken into account. College graduates were much more likely to study business or health and far less likely to graduate from programs in the humanities and social and behavioural sciences. Most recently, Corral (2026a) analyzed earnings and student loan debt for Ontario bachelor’s graduates using the same administrative data and found that college degree holders from the 2010-2013 cohorts earned between 5 percent and 14 percent more annually than university graduates two years after graduation. Neither Frenette (2019) nor Corral (2026a) examined within-sector variation in the university sector, where studies have found that differentially ranked universities produce modestly disparate outcomes (e.g., Betts, Ferrall and Finnie 2013; Milla 2018; Zarifa, Sano and Pizarro Milian 2025).
Frenette’s (2019) work also examined disparities in educational trajectories, finding that university bachelor’s graduates were nearly five times more likely to enrol in graduate-level studies (11.9 percent versus 2.5 percent, or a 9.4 percentage point difference). This gap shrank to 3.1 percentage points once observable differences were accounted for. Evidence has since surfaced that the desire to participate in graduate-level studies may systematically vary among students who enrol in college or university bachelor’s programs. Data collected through Academica Group’s 2025 University/College Applicant Study (UCAS) indicates that applicants seeking a bachelor’s degree at an Ontario college are roughly twice as likely (59 percent versus 30 percent) as university counterparts to indicate that a bachelor’s is the highest degree they plan to attain (Pizarro Milian and Grant 2026). However, scholars have long speculated that the college bachelor’s degree in Ontario will struggle to gain recognition among graduate program admissions committees (Skolnik 2005). The limited qualitative evidence suggests this has historically been the case (Hurley and Sa 2013, p. 170-171). Similarly, the singular quantitative study on this topic by Malatest and Associates (2010) found that among those Ontario college bachelor’s graduates who had applied to master’s programs, 36 percent reported that their degree had not been recognized by the university they applied to (p. vi). These findings suggest that both aspirations and institutional recognition likely shape the educational trajectories of college bachelor’s graduates.
Data and Methodology
Through this report, we evaluate graduate and second-entry program participation rates, as well as the early earnings of bachelor’s degree holders from Ontario colleges and various types of universities during the 2013-2019 period. Our study draws on linked data from several large administrative datasets housed in Statistics Canada’s ELMLP:
- Postsecondary Student Information System (PSIS): A set of annual snapshots providing census-level coverage of all students and graduates from nearly all colleges and universities funded by provincial governments in Canada. These files contain basic demographics (e.g., age, sex, immigration status) and detailed academic information (e.g., field of study, institution codes).
- Canada Student Loans Program (CSLP): Administrative files providing census-level coverage of all individuals who received student loans from the federal government. The files include information on how much they borrowed, as well as borrower demographics (e.g., sex, parental income).
- T1 Family File: Administrative files covering roughly 95 percent of the Canadian population, including both tax filers and non-filing spouses or children (Frenette and Handler 2026). The files contain both demographic (e.g., immigration, marital status, dependents in the home) and income information for both graduates in our sample and their families.
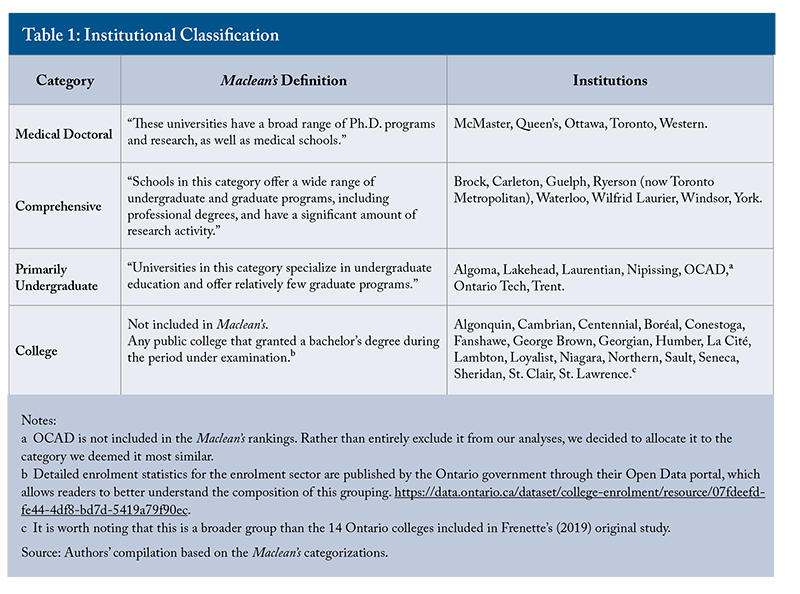
We use the institutional identifiers in the PSIS to segment Ontario university graduates according to the popular categorizations used by Maclean’s.9There are multiple potential ways to segment Ontario universities (e.g., U15). Our decision is inspired by previous use of the Maclean’s category by Milla (2018), along with research demonstrating its relevance to applicants (Pizarro Milian and Zarifa 2025). As colleges are not in the Maclean’s classification scheme, they constitute a separate category in our institutional typology.10Sample sizes prevent us from segmenting college graduates any further. This will become possible in future years as additional graduating cohorts become available through the PSIS files and more programs potentially emerge in the sector. Table 1 presents the correspondence between individual institutions and our institutional categories, along with category definitions.
Our first dependent variable comes from the PSIS and indicates whether a student enrolled in a graduate (e.g., master’s, doctorate) or second-entry level (e.g., law, pharmacy) program at a public university in Canada in the three years following their graduation. Because we focus on access to credential tiers known to be associated with earnings premiums over a bachelor’s degree, this measure excludes graduates who enrol in college postgraduate certificate or diploma programs or who pursue a second first-entry bachelor’s degree. We estimate these participation models using logistic regression, a standard technique for binary dependent variables.
We derive our second dependent variable from the T1FF: paid employment income three years after graduation,11In other published work evaluating the impact of Maclean’s ranking changes on graduate earnings (Zarifa, Sano and Pizarro Milian 2025), we have found comparable results at both the one- and five-year marks. Nevertheless, it is possible that we could observe different patterns if we looked at earnings further into graduates’ careers, given that on-the-job performance could play a relatively more important role in salary determination. This is a topic that requires further scrutiny. as reported by employers for nearly all employees on T4 slips. This measure excludes those with missing or zero reported earnings.12Note that this would exclude those who left the country after graduation and did not file income taxes. Choi, Crossman and Hou (2021) estimated that 52 percent of international bachelor’s graduates (2010-2016) did not file income taxes in Canada a year after their graduation, whereas 10 percent of domestic counterparts did not file. Given the uneven distribution of employment income,13Earnings are inflation adjusted to 2022 dollars. we regress the natural logarithm of earnings on institutional type using the ordinary least squares (OLS) technique.
We estimate our models using a broad set of control variables to account for theoretically relevant differences among students who graduate from each institutional type.14For details on the categories for each of these variables, see Table A1 in the Online Appendix.
- Demographics: Age, sex, immigration status, marital status, parental income, and geographical region.
- Academic information: Field of study groupings associated with the bachelor’s degree, length of enrolment, and whether they transferred during their studies.
- Student loans: Amount borrowed from the Canada Student Loans Program (CSLP) during the first year of study.
- Recent work experience: Measured using the total amount of T4 employment-related income reported by students during the four years preceding their graduation.15Both models discussed above utilize robust standard errors.
We restrict all analyses to individuals aged 21 to 23 years old at the end of the calendar year in which they graduated to ensure greater sample homogeneity.16This restriction is bound to impact college more than university groupings. Pizarro Milian and Grant (2026) find that applicants to college bachelor’s degrees in Ontario are roughly 3.7 years older than university counterparts. Corral (2026b) also finds that age is among the strongest predictors of enrolling in a college bachelor’s degree (as opposed to university) in Ontario. Given that older graduates are most likely to have previous work experience, and that experience is positively associated with earnings, we imagine this places downward bias on their earnings relative to Frenette’s (2019). The models predicting graduate or second-entry program enrolment include this entire age cohort, excluding only observations with small amounts of missing data on certain covariates.
For our earnings models, we apply several additional restrictions to ensure comparability in subsequent human capital acquisition and labour market attachment. First, following Frenette (2019), we exclude graduates who enrolled in further studies during the three-year post-graduation window using the PSIS. Second, because private institutions, as well as other forms of upskilling, are not covered by the PSIS, we exclude those with positive tuition tax credits in their T1FF records within three years of graduation. Third, we exclude graduates who received Employment Insurance (EI) benefits17Colyar, Brumwell and Deakin (2022) found that 18.8 percent of college and 15.9 percent of university bachelor’s degree graduates in Ontario from the 2011-2015 graduating cohorts received EI benefits within three years of graduating (p. 24). or social assistance during the tax year used to measure T4 earnings, as their labour market participation is likely reduced. Fourth, we exclude those who reported positive self-employment income three years post-graduation,18Sá, Cowley and Husain (2025) estimated that roughly 5.5 percent of Canadian university graduates are self-employed three years post-graduation; and 1.8 percent reported they owned a business. Their models suggested that graduates who were women, Black, and non-citizens were less likely to be self-employed (p. 9). as they may have been focused at least in part on entrepreneurial activities (e.g., building a small business) rather than traditional T4 employment. Finally, we trim extreme values in the top and bottom 0.5 percent of the logged earnings distribution to reduce the influence of outliers on our parameter estimates.19All the syntax used to produce our analytical files and subsequent regression models was written by the first author and subsequently verified by the fourth author. All our work was done within the RDC environment, which currently does not include generative artificial intelligence tools (e.g., Claude, ChatGPT). While these restrictions improve comparability, they also produce a sub-sample of graduates that is not representative of the broader population of graduates and exclude groups that may merit separate analysis (e.g., mature students).
Our data and methodological approach also have limitations. Chiefly, our observational data and statistical methods allow us to estimate only the unexplained differences in our dependent variables across institutional types. To be clear, our estimates should not be interpreted as causal. While we include a rich set of controls for potential confounders, selection bias will likely remain because students who apply to and are admitted to bachelor’s programs at colleges and universities differ in ways we do not observe (see Pizarro Milian and Grant 2026). These differences include academic preparation, such as high school grades, as well as attitudinal factors that may shape the outcomes of interest.20We return to these issues later in the report in our discussion of areas for future inquiry. Lastly, some structural imbalances across institutional types cannot be overcome, such as the uneven distribution of institutions across Ontario. As a result, our institutional type coefficients are primarily identified in areas where all four institutional types operate.
Findings
Graduate and Second-Entry Program Participation
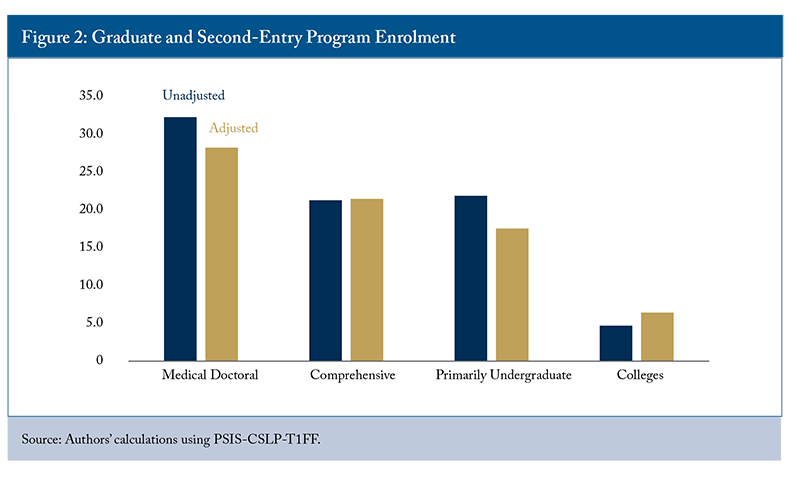
We begin by examining the share of individuals in our sample who enrolled in a graduate or second-entry program within three years of graduating from their bachelor’s degree (see Figure 2). Graduates from medical doctoral institutions have the highest rate (32.3 percent), followed by those from primarily undergraduate (21.9 percent) and comprehensive (21.3 percent) institutions. In contrast, only about one in 20 college bachelor’s graduates enrol in either graduate or second-entry programs within the observation period.
It is worth noting that the participation rate for university graduates in our sample is substantially higher than that reported by Frenette (2019), while the college rate appears relatively unchanged.21There are several likely reasons for this divergence. First, we look at participation over a longer window (three years) than Frenette’s (2019) study (two years). Second, we exclude older graduates who are less likely to participate in graduate or second-entry programs (see Zarifa 2012). Third, we focus on more recent graduating cohorts that may be exposed to greater pressure to acquire further credentials. As we see through the regression model in Table A2 in the Online Appendix, each successive cohort is more likely to enrol in a graduate or second-entry program. Fourth, we include second-entry programs (e.g., LLBs) in our dependent variable not flagged in Frenette’s (2019) work. We thank an anonymous reviewer for highlighting these potential reasons for the discrepancies. Our figures align more closely with those published by the province through the Ontario University Graduates Survey (OUGS) for the 2019 graduating cohort – the most recent cohort covered by our sample.22An important difference between ours and the OUGS sample is that the latter includes several programs which are second-entry, such as dentistry, law, optometry, and pharmacy. For many of these programs, subsequent degree acquisition rates are likely structurally low given the normative professional sequence of credential acquisition. According to the Ontario Ministry of Colleges and Universities,23Results from this fielding of the OUGS are no longer hosted on the MCU websites, but have been archived here: https://web.archive.org/web/20230312182836/https:/www.iaccess.gov.on.ca/OsapRatesWeb/enterapp/overview.xhtml. 20 percent of respondents to the OUGS reported being enrolled in a graduate (13.5 percent) or professional (6.5 percent) degree program six months after completing their degrees. Similar figures are reported after two years, despite many master’s programs in Canada requiring only one year to complete.
Graduates from these institutional types vary across a range of characteristics associated with participation in further study. Accordingly, our models control for these observed differences. We then estimate the probability that a graduate from each institutional type enrols in a graduate or second-entry program while holding all control variables at their sample means. In effect, this assumes that each institutional type graduates the “typical” student in the sample. These probabilities are also plotted in Figure 2 alongside the unadjusted rate.
The predicted rates for medical doctoral (28.3 percent) and primarily undergraduate universities (17.6 percent) are noticeably lower, while the predicted rate for college graduates increases slightly (to 6.4 percent).24We convert the predicted probabilities into percentages for interpretability. We thank an anonymous reviewer for this suggestion. The rate for comprehensive universities remains virtually unchanged. Overall, these controls make graduate and second-entry program participation rates more comparable among institutional types, but do not eliminate the previously observed gaps. Moreover, the differences among these adjusted estimates remain statistically significant.25We performed pairwise comparisons between each sector estimate using a Bonferroni adjustment for the multiple comparisons being made. All estimates were found to be statistically different (see Table A3 in the Online Appendix). Again, we caution against interpreting these unexplained differences as entirely attributable to an institutional “treatment” effect, as our models cannot fully account for selection into different types of institutions.
Earnings
Our second set of analyses focuses on the paid employment earnings of graduates who did not pursue further education within three years of graduation, whether at the graduate, second-entry, or lower level (e.g., college certificate), and who instead entered the labour market and maintained comparable levels of attachment to it. Specifically, these graduates did not receive EI or social assistance benefits or report self-employment income during the year when employment income was measured. This analysis therefore focuses on a restricted sub-sample of each graduating cohort at a specific point in their careers, and its findings may not reflect longer-term labour market outcomes or the broader graduate population.26The sizable group of high-ability graduates who enrolled in graduate or second-entry programs are absent from these earnings analyses. They come disproportionately from the university sector. It is possible that if we ran these analyses with earnings measured later in the life course, the re-introduction of these individuals into the sample would put upward pressure on the earnings estimates for the university categories.
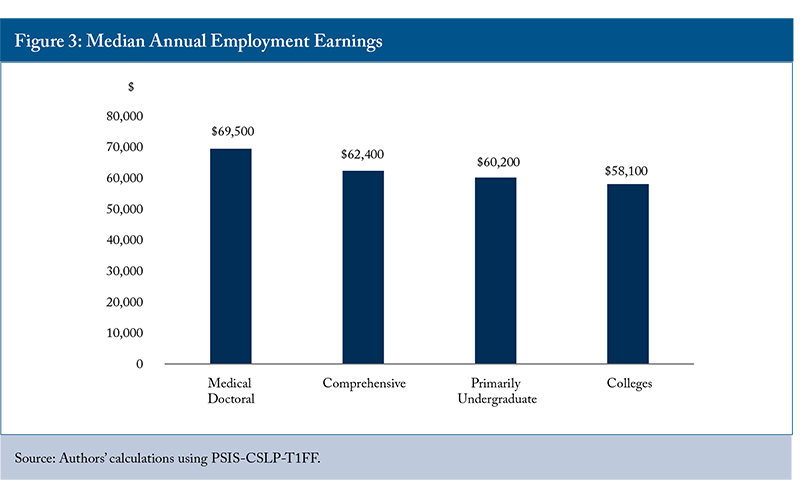
We begin by presenting descriptive trends, focusing on the median annual employment earnings of graduates from each institutional type in Figure 3. We see that graduates of medical doctoral universities have the highest median earnings ($69,500). They are followed by counterparts from comprehensive universities ($62,400), the sector’s second-most research-intensive institutional type. Next are primarily undergraduate ($60,200) and college ($58,100) graduates. This ordering is consistent with institutional prestige hierarchies (Pizarro Milian and Zarifa 2026), whereby more research-intensive and selective institutions are expected to produce higher earnings.
The earnings presented in Figure 3 are noticeably higher than those reported by Frenette (2019). Several factors likely explain this difference. First, we focus on a more recent set of graduating cohorts. Second, we examine earnings three rather than two years after graduation. Third, and as mentioned earlier, we apply an additional set of sample restrictions to ensure high levels of labour market attachment, which bias our earnings estimates upward. It is also worth noting that college graduates in Frenette’s (2019) report had higher unadjusted earnings than university counterparts, whereas they record the lowest unadjusted earnings in our analyses. This difference may reflect our focus on traditionally aged graduates, a sample restriction that likely places downward pressure on the earnings of college graduates, who tend to be older and have more work experience.
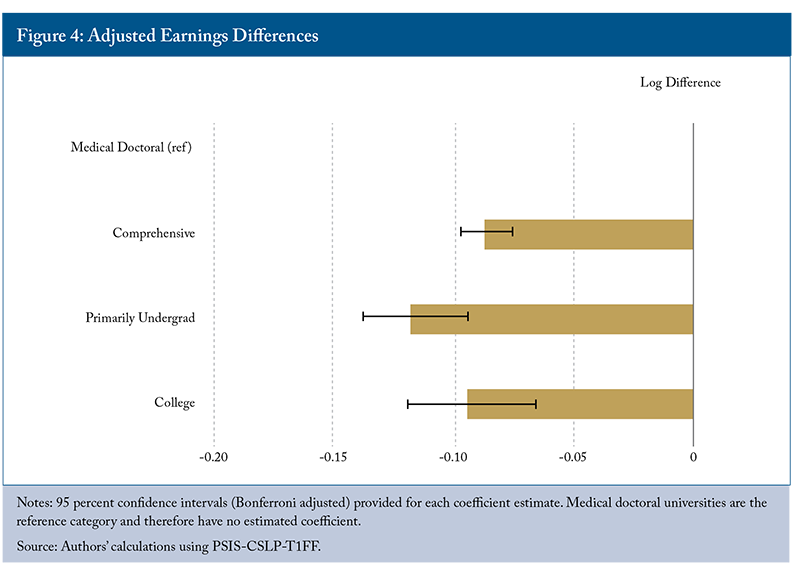
Shifting to estimates from our regression models (Figure 4), which focus on earnings differences at the conditional mean (as opposed to median), we find a pattern of adjusted coefficient estimates that is generally consistent with those presented in Figure 3.27The full regression model is presented in Table A2 in the Online Appendix. Once again, there is a notable gap between the estimated earnings for graduates from medical doctoral universities (our reference category) and those from every other institutional type. Graduates of comprehensive universities earn roughly 8 percent less (equivalent to -0.087 log points), those from colleges about 9 percent less, and those from primarily undergraduate universities about 11 percent less. However, it is worth emphasizing that there is relative parity among the non-medical doctoral institutional types. For example, the gap between comprehensive and primarily undergraduate universities amounts to only about a 3 percent difference. To translate this range into a more intuitive metric, we followed the approach in Betts et al. (2013, p. s105), predicting average earnings for each institutional type while holding all covariates at their sample means (see Table A4), and then exponentiating the resulting log earnings. Using this approach, the gap between comprehensive and primarily undergraduate graduates corresponds to a roughly $1,700 difference per year.
As it may already be apparent, our segmentation of the university grouping using the Maclean’s categories offers a more nuanced understanding of between-sector differences in graduate earnings than previously observed through either Frenette’s (2019) or Corral’s (2026a) binary contrast of these sectors. Our findings show that, although college bachelor’s graduates earn less than graduates from medical doctoral universities, their adjusted earnings are comparable to those from other university types.
Generally, our findings on earnings are more consistent with Frenette’s (2019) than Corral’s (2026a). The former estimated that, conditional on demographics and field of study, university bachelor’s degree holders earned roughly $1,000 more than college counterparts. Had we grouped universities into a single category, we anticipate that the broader university sector earnings estimate would fall between that of the medical doctoral and the other university types, nudging it slightly above the college estimate. This would contrast with Corral’s (2026a) general finding that Ontario college graduates out-earned university counterparts by 5 percent to 14 percent, net of covariates.
Discussion
Through this report, we examine variation in the educational trajectories and early earnings of Ontario bachelor’s degree graduates across broad institutional types. Our work merely scratches at the surface of these rich administrative files in Statistics Canada’s ELMLP, presenting a first set of unadjusted and regression-adjusted estimates that require further empirical scrutiny. Nevertheless, given the underdeveloped state of both academic research and public reporting on this topic, these findings represent an advancement that should inform future academic and policy discourse.
Our first set of models show substantial disparities in graduate and second-entry program participation rates across institutional types. University bachelor’s degree graduates, particularly those from medical doctoral universities, are far more likely to enrol in graduate and second-entry programs than their college counterparts. This finding persists even after we account for available controls, including several known predictors of these educational trajectories (e.g., Zarifa 2012) like parental income and field of study.
Before we can determine how to act on these disparities, there is a need to better understand the forces driving them. If they reflect differences in student interest, as recently documented by Pizarro Milian and Grant (2026), there may be no need for government intervention. College graduates could already be following expedient and desired pathways into specialized occupational fields (e.g., construction management) that do not require more advanced credentials. In this scenario, it may still be worth considering whether new graduate-level offerings could be developed to serve the specialized training needs of these graduates and the industries they enter. The new applied master’s degrees that Ontario colleges have been authorized to offer may represent one such opportunity.
If the disparities are not a function of interest, they may be driven by systemic barriers. These two explanations are not mutually exclusive, and could plausibly operate simultaneously. As mentioned earlier, it has long been speculated that graduate school admissions committees do not perceive college bachelor’s degrees in Ontario as providing the necessary academic preparation for graduate-level studies (Hurley and Sa 2013; Malatest and Associates 2010). Given that, to our knowledge, this topic has not attracted empirical attention in over a decade, it should be revisited. If such biases persist, institutions and the province should develop strategies to address them. While Canada is an international leader when it comes to PSE access and attainment, it continues to lag in the acquisition of advanced credentials. Clearing any potential “clogs” in the pipeline from college bachelor’s degrees to more advanced credentials could be a beneficial move here.
However, the observed disparities in graduate and second-entry program participation may also reflect the academic profiles of those students graduating from the four institutional types we examine. We know that admissions requirements and self-selection substantially shape entry into these institutional types during undergraduate admissions (e.g., Davies, Maldonado and Zarifa 2014; Pizarro Milian and Zarifa 2025). It is reasonable to expect that this early filtering shapes the composition of graduating cohorts and the proportion from each institutional type that succeeds in the highly competitive graduate or second-entry admissions process. If this is the case, it may not require intervention.
Our second set of models shows modest institution-based variation in the early earnings of a subset of bachelor’s degree graduates who directly enter the labour market and maintain high levels of attachment. These differences are not fully explained by demographics, academic, and other observable characteristics in the administrative files. Our results on the university side are generally consistent with previous research (Zarifa, Sano and Pizarro Milian 2025), given that more research-intensive institutional types are associated with slightly higher earnings, conditional on covariates. Three years after graduation, moving from the lowest to the highest earnings institutional type corresponds to an annual earnings increase of roughly 11 percent or $6,700 for the typical student. This difference pales in comparison to disparities observed in other nations.28Consider, as a crude example, some of the extreme disparities in bachelor’s graduate median earnings seen through the US Department of Education’s College Scorecard (https://collegescorecard.ed.gov/). Princeton University graduates have reported median earnings four years after graduation of roughly US$109,000. Meanwhile, counterparts from four-year institutions in the same state that are within commuting distance, such as The College of New Jersey (US$72,000) or Rider University (US$63,000), make dramatically less. Moreover, outside of the medical doctoral grouping, we observe general parity, with only about a 3 percent spread across institutional types. Overall, we find broad earnings parity, with the only meaningful inequality occurring between graduates of medical doctoral universities and the rest of the system.
This second set of findings has several plausible policy implications. Given the relative earnings parity we observe, does it make financial sense for students to move away to complete a degree program that is offered locally? The historical tendency for Canadian high school students to enrol at institutions close to their family home already reflects the cost-benefit decisions many families are making (e.g., Davies, Maldonado and Zarifa 2014; Drewes and Michael 2006). It is worth considering whether the provincial government should incentivize more localized transitions into post-secondary education. If undergraduate education in Ontario proves to be largely substitutable within program areas, a rational human capital development strategy would aim to minimize the cost to both students and the province (through loans and grants) by encouraging students to attend local institutions where it makes sense. This would, however, need to be weighed against the personal and developmental benefits students derive from leaving home, as well as potential effects on smaller, rural-serving institutions that rely on drawing students from outside their immediate catchment.
The observed parity in early earnings should also prompt careful reflection on efforts by the province to promote differentiation among Ontario universities (Pizarro Milian, Davies and Zarifa 2016). Differentiation in undergraduate education should be informed by more granular analyses of program-level labour market outcomes. Moreover, it requires consideration of a broader set of indicators than those examined in this report. For example, mining the T1FF and CSLP databases for additional outcomes, such as exposure to EI, social assistance, or student loan repayment rates, could provide a more holistic picture of graduate outcomes. It would also be useful if the province made data from future respondents to the Ontario University Graduate Survey (OUGS) available and linkable within the ELMLP, as this survey contains vital subjective indicators (e.g., job-relatedness to education, overqualification) that could complement what is captured in administrative data.
The performance of the college sector is also worthy of celebration and closer inspection. Early concerns (e.g., Colleges Ontario 2009) about weak employer recognition of college bachelor’s degrees no longer appear to be warranted. Nor have fears (e.g., Marshall 2008) that these degrees would constitute a new and lower tier of Ontario PSE materialized. Their relative success, despite lacking the longstanding reputation of older university counterparts, suggests that they compete successfully based on their technical orientation and alignment with regional demand across underserved program areas (e.g., construction management). Further investigation into their structures and operating practices may provide lessons for the broader PSE system. It could also be argued that the success of these programs reflects well on the provincial government’s decision to allow colleges to participate in degree-granting through the Post-secondary Education Choice and Excellence Act.
It is important to emphasize that differences in admission requirements (e.g., high school courses or grades) across Ontario colleges and universities will explain some of the modest variation in earnings we observe. The high levels of selectivity of many programs within medical doctoral universities (e.g., Health Sciences at McMaster University) likely contribute to the higher earnings of their graduates, reflecting pre-existing student aptitude or preparation rather than an institutional treatment effect. To examine this dynamic more fully, the next step in our ongoing project will incorporate high school course completion and performance data recently added to the ELMLP by the Ontario Ministry of Education. These are measures that have been found to be associated with graduate earnings, even net of general postsecondary pathways (Pizarro Milian et al. 2024).
Finally, it is worth pointing out that in comparing variation among bachelor’s graduates alone, we exclude the many other PSE pathways currently available to prospective students. These include college certificate and diploma programs in addition to the entire apprenticeship system. In doing so, our work greatly simplifies student decision-making. Existing work using data from both Toronto District School Board (Pizarro Milian et al. 2025) and British Columbia (Pullman et al. 2024) students finds that, on average, those entering the apprenticeship system outperform bachelor’s graduates with respect to short-term earnings. However, bachelor’s graduates outperform those completing lower-level college certificates or diplomas. The broader picture of inequality in postsecondary graduate outcomes is therefore more nuanced than the scope of this report allows us to examine.
Conclusion
Advancements in Canadian data infrastructure over the past decade have opened new avenues for researchers to map graduate outcomes with far greater precision than previously possible. Our work builds on existing studies to better understand the relationship between the type of institution from which students earn a bachelor’s degree and their subsequent short-term educational pathways and labour market outcomes in the Ontario context. We hope these findings help inform policy discussions on human capital development and institutional differentiation in Ontario over the coming years. We also hope this study encourages greater use of these data for policy-relevant research.
References
Aurini, J., R. Pizarro Milian, and R. Missaghian. 2023. “The Micro-Foundations of Predictable Stability: How Multigenerational Achievement Informs Upper-Middle-Class Parenting.” Qualitative Sociology 46(1): 109–128. https://doi.org/10.1007/s11133-023-09529-7.
Betts, J., C. Ferrall, and R. Finnie. 2013. “The Role of University Characteristics in Determining Post-Graduation Outcomes: Panel Evidence from Three Canadian Cohorts.” Canadian Public Policy 39(Supplement 1): S81–S106. https://doi.org/10.3138/CPP.39.Supplement1.S81.
Chetty, R., D. Deming, and J. Friedman. 2023. “Diversifying Society’s Leaders? The Determinants and Causal Effects of Admission to Highly Selective Private Colleges.” https://doi.org/10.3386/w31492.
Clark, I., G. Moran, M. Skolnik, and D. Trick. 2009. Academic Transformation: The Forces Reshaping Higher Education in Ontario. Montreal and Kingston: McGill-Queen’s University Press.
Colleges Ontario. 2009. Expanding Degree Opportunities to Meet the Needs of the New Economy. https://files.eric.ed.gov/fulltext/ED524016.pdf.
Colyar, J., S. Brumwell, and J. Deakin. 2022. Exploring Postsecondary Credentials and Labour Market Alignment in Ontario. Toronto: Higher Education Quality Council of Ontario. https://heqco.ca/wp-content/uploads/2022/08/Final-Exploring-Postsecondary-Credentials-and-Labour-Market-Alignment-in-Ontario.pdf.
Corral, D. 2026a. “Are All Degrees Worth the Same? A Comparative Analysis of Community College and University Baccalaureate Graduates’ Financial Outcomes.” Community College Review 54(2): 119–140. https://doi.org/10.1177/00915521251398470.
________. 2026b. “Who Enrolls in Ontario College Bachelor’s Degrees?” Presentation at the annual meeting of the Canadian Society for the Study of Higher Education. June.
Crocker, B., C. Hall, and R. Janzen. 2025. “Deciding on Postsecondary: What Drove Applicant Choices in 2024?” Academica Forum. March 7.
Dale, S. B., and A. B. Krueger. 2014. “Estimating the Effects of College Characteristics over the Career Using Administrative Earnings Data.” Journal of Human Resources 49(2): 323–358. https://doi.org/10.3368/jhr.49.2.323.
Davies, S., and F. M. Hammack. 2005. “The Channeling of Student Competition in Higher Education: Comparing Canada and the U.S.” The Journal of Higher Education 76(1): 89–106. https://doi.org/10.1353/jhe.2005.0003.
Davies, S., V. Maldonado, and D. Zarifa. 2014. “Effectively Maintaining Inequality in Toronto: Predicting Student Destinations in Ontario Universities.” Canadian Review of Sociology/Revue canadienne de sociologie 51(1): 22–53. https://doi.org/10.1111/cars.12032.
Davies, S. and Zarifa, D.. 2012. "The Stratification of Universities: Structural Inequality in Canada and the United States." Research in Social Stratification and Mobility 30 (2): 143–158. https://doi.org/10.1016/j.rssm.2011.05.003.
Drewes, T., and C. Michael. 2006. “How Do Students Choose a University? An Analysis of Applications to Universities in Ontario, Canada.” Research in Higher Education 47(7): 781–800. https://doi.org/10.1007/s11162-006-9015-6.
Eide, E., D. J. Brewer, and R. G. Ehrenberg. 1998. “Does It Pay to Attend an Elite Private College? Evidence on the Effects of Undergraduate College Quality on Graduate School Attendance.” Economics of Education Review 17(4): 371–376. https://doi.org/10.1016/S0272-7757(97)00037-X.
Frenette, M. 2019. Obtaining a Bachelor’s Degree from a Community College: Earnings Outlook and Prospects for Graduate Studies. Ottawa: Statistics Canada. https://files.eric.ed.gov/fulltext/ED605369.pdf.
Higher Education Strategy Associates. 2012. Changing Times, Changing Places: The Global Evolution of the Bachelor’s Degree and the Implications for Ontario.
Hurley, P., and C. M. Sá. 2013. “Higher Education Policy and Legitimacy Building: The Making of a New Academic Credential in Ontario.” Higher Education Quarterly 67(2): 157–179. https://doi.org/10.1111/hequ.12010.
Jones, G., and M. Skolnik. 2009. Degrees of Opportunity: Broadening Student Access by Increasing Institutional Differentiation in Ontario Higher Education. Toronto: Higher Education Quality Council of Ontario. http://www.heqco.ca/SiteCollectionDocuments/Degrees%20of%20Opportunity.pdf.
Marshall, D. 2008. “Differentiation by Degrees: System Design and the Changing Undergraduate Environment in Canada.” Canadian Journal of Higher Education 38(3): 1–20.
Menardi, S., S. Sood, and C. Johnston. 2026. Analysis on Employee Skills Gaps, First Quarter of 2026. Ottawa: Statistics Canada.
Milla, J. 2018. “The Canadian University Selectivity Premium.” Review of Economic Analysis 10: 313–349. https://papers.ssrn.com/sol3/papers.cfm?abstract_id=3387420.
Panacci, A. 2014. “Baccalaureate Degrees at Ontario Colleges: Issues and Implications.” College Quarterly 17(1).
Peters, J., and R. Pizarro Milian. 2024. Mapping the Terrain: A Synthesis of Recent Research and Future Directions. Ottawa: CEWIL Canada.
Pizarro Milian, R., and D. Grant. 2026. “Who’s Applying to College Bachelor’s Degree Programs in Ontario?” Academica Group. https://forum.academica.ca/forum/whos-applying-to-college-bachelors-degree-programs-in-ontario.
Pizarro Milian, R., R. Brown, D. Walters, G. Parekh, R. Collis, C. E. Mishra, and F. J. Abdulkarim. 2025. "Breaking the Stigma: The Economic Returns to Trades Education in Canada." Education + Training 67(7–8): 786–801. https://doi.org/10.1108/ET-01-2025-0014.
Pizarro Milian, R., D. Zarifa and Y. Sano. 2024. “Do Transfers into the Community College Sector Graduate at the Same Rate? Evidence from Ontario, Canada” Community College Journal of
Research and Practice, 79:e12578. DOI.
Pizarro Milian, R., and D. Zarifa. 2023. “The Stratification of Universities Revisited: Status, Followers, and the Shape of National Hierarchies.” Canadian Journal of Higher Education 53(2): 32–48. https://doi.org/10.47678/cjhe.v53i2.189881.
______________. 2025. “Effectively Maintained Inequality in Canada Revisited.” Canadian Review of Sociology 62(5): 281–298.
______________. 2026. “Beyond Universities: Structural Stratification in Canadian Tertiary Education.” Canadian Review of Sociology 63(2), e70027.
Pizarro Milian, R., S. Davies, and D. Zarifa. 2016. “Barriers to Differentiation: Applying Organization Studies to Ontario Higher Education.” Canadian Journal of Higher Education 46(1): 19–37.
Pullman, A., M. Dubois, R. Ford, and R. Feng. 2024. Effects of Student and Family Background Characteristics on Post-Secondary Education Access, Persistence, and Completion, and Labour Market Outcomes in British Columbia: Final Report. Ottawa: Social Research and Demonstration Corporation. https://www.srdc.org/wp-content/uploads/2022/11/BC-PSE-outcomes-report-FINAL.pdf.
Sá, C., S. Cowley, and A. Husain. 2025. “Who Becomes an Entrepreneur after University? Evidence from Canada.” PLOS ONE 20(1): e0308949. https://doi.org/10.1371/journal.pone.0308949.
Skolnik, M. L. 2005. "The Community College Baccalaureate in Canada: Addressing Accessibility and Workforce Needs." In The Community College Baccalaureate: Emerging Trends and Policy Issues, edited by D. L. Floyd, M. L. Skolnik, and K. P. Walker, chap. 4.
Skolnik, M. 2012. College Baccalaureate Degrees and the Diversification of Baccalaureate Production in Ontario. https://utoronto.scholaris.ca/server/api/core/bitstreams/65256082-61f0-4184-b4a0-8c1d438d357a/content.
Skolnik, M., L. Wheelahan, G. Moodie, Q. Liu, E. Adam, and D. Simpson. 2018. “Exploring the Potential Contribution of College Bachelor Degree Programs in Ontario to Reducing Social Inequality.” Policy Reviews in Higher Education 2(2): 176–197. https://doi.org/10.1080/23322969.2018.1455532.
Stevens, M. 2009. Creating a Class: College Admissions and the Education of Elites. Cambridge, MA: Harvard University Press.
Wheelahan, L., G. Moodie, M. Skolnik, Q. Liu, E. Adam, and D. Simpson. 2017. CAAT Baccalaureates: What Has Been Their Impact on Students and Colleges? Toronto: Centre for the Study of Canadian and International Higher Education. https://utoronto.scholaris.ca/items/30dc392b-48b4-44fe-b287-dd44ed75363e.
Witteveen, D., and P. Attewell. 2017. “The Earnings Payoff from Attending a Selective College.” Social Science Research 66: 154–169. https://doi.org/10.1016/j.ssresearch.2017.01.005.
Zarifa, D. 2012. “Persistent Inequality or Liberation from Social Origins? Determining Who Attends Graduate and Professional Schools in Canada’s Expanded Postsecondary System.” Canadian Review of Sociology/Revue canadienne de sociologie 49(2): 109–137. https://doi.org/10.1111/j.1755-618X.2011.01286.x.
Zarifa, D., Y. Sano, and R. Pizarro Milian. 2025. “Stratification in Countries with Flatter (Institutional) Hierarchies? Insights from Administrative Data in Canada.” Sociology of Education. https://doi.org/10.1177/00380407241311551.