





by G. Kent Fellows
- This Commentary estimates how Alberta’s Technology Innovation and Emissions Reduction (TIER) system, the province’s industrial carbon pricing system for large emitters, affects the marginal costs of oil sands production. Using project-level production and emissions data, it estimates carbon pricing costs in 2023 and projects how those costs evolve under the recently updated federal-Alberta carbon pricing agreement.
- In 2023, carbon pricing changed marginal production costs by between -$1.09 (with the negative implying an effective net subsidy) and $4.05 per barrel, depending on a facility’s emissions intensity. For nearly all oil sands producers, these costs represent only a small share of overall operating costs, while lower-emitting facilities receive net benefits under the TIER system.
- Under the updated carbon price and TIER stringency schedules, projected net carbon pricing costs remain modest despite higher headline carbon prices, with no oil sands facility projected to face costs above $5 per barrel by 2050. The analysis intentionally adopts assumptions that overstate carbon pricing costs, so the estimates should be interpreted as an upper bound.
Introduction
Following the 2025 removal of Canada’s consumer-facing carbon price, federal attention has shifted to industrial carbon pricing systems for large emitters across Canada. The Official Opposition campaigned on a promise to “repeal the entire carbon tax law, including the federal industrial carbon tax backstop, restoring our industrial base and taking back control of our economy from the Americans.”1Conservative Party of Canada. 2025. “Poilievre Promises to Axe the Entire Carbon Tax.” https://www.conservative.ca/poilievre-promises-to-axe-the-e Additionally, the federal government and the province of Alberta have recently signed a memorandum of understanding (MOU)2Prime Minister of Canada. 2025. “Canada-Alberta Memorandum of Understanding.” November 27. https://www.pm.gc.ca/en/news/backgrounders/2025/11/27/canada-alberta-memorandum-understanding; Prime Minister of Canada. 2026a. “Canada and Alberta Strike Agreement to Diversify Our Exports, Reduce Emissions, and Build a Stronger Economy.” May 15. https://www.pm.gc.ca/en/news/news-releases/2026/05/15/canada-and-alberta-strike-agreement-diversify-our-exports-reduce; Prime Minister of Canada. 2026b. “Implementation Agreement for the Canada-Alberta Memorandum of Understanding of November 27, 2025.” May 15. https://www.pm.gc.ca/en/news/backgrounders/2026/05/15/implementation-agreement-canada-alberta-memorandum-understanding. with several clauses related to carbon pricing.
Despite this shift in focus and the ongoing negotiations between the federal government and Alberta on a carbon pricing agreement, there is little publicly accessible quantitative analysis on how the current and proposed large-emitters system affects costs in Canada’s largest energy subsector, the oil sands. A notable exception is the analytical work done by Dave Sawyer (2026), which Dale Beugin and Ross Linden-Fraser discuss (2026).
The Alberta oil sands represent the largest single emitting sector in the Canadian economy, and as a result, the oil sands are a primary focus of climate change policies provincially and federally (Leach 2022). With specific reference to the oil sands, the renewed interest in industrial carbon pricing indicated by public commentary and the MOU suggests that policymakers need to understand the past, present, and future implications of existing and planned carbon pricing schemes on cost structures in the oil sands. The analysis below fills this gap.
The Alberta-federal MOU agreement calls upon the parties to:
Work collaboratively to design and commit to globally competitive, long-term carbon effective prices, carbon levy recycling protocols, and sector-specific stringency factors for large Alberta emitters in both the oil and gas and electricity sectors through Alberta’s TIER system. The TIER system will ramp up to a minimum effective credit price of $130/tonne. The parties will conclude an agreement on industrial carbon pricing on or before April 1, 2026.
Examples of issues to be addressed in the new agreement include the date for introduction of the effective price and the price increases over time.
This industrial carbon pricing agreement will include a financial mechanism to ensure both parties maintain their respective commitments over the long term to provide certainty to industry, and to achieve the intended emissions reductions.
Recognizing Alberta’s jurisdiction over the TIER system, Canada and Alberta agree to work co-operatively to ensure the Alberta carbon market functions reliably and provides a predictable basis for decision-making by industry and investors. This includes a shared undertaking that following the completion of this Memorandum of Understanding, the two governments will work co-operatively to ensure the application of Alberta’s carbon pricing system (including pricing and stringency) is adapted to the specific circumstances of the electricity sector, the oil and gas sector, and other large emitters such as fertilizer and cement sectors.3Prime Minister of Canada. 2025. “Canada-Alberta Memorandum of Understanding.” November 27.
A May 2026 update stipulates:
Canada and Alberta have agreed to an effective carbon price of $130 per tonne by 2040.
- This will be achieved by agreed upon annual benchmarks for the headline carbon price, including $115 by 2030 and $130 by 2035.
- The headline carbon price will increase to $140 per tonne by 2040.
- Canada and Alberta have also agreed to annual tightening, or “stringency” rates under the Technology Innovation and Emissions Reduction (TIER) system. These tightening rates will gradually strengthen emissions benchmarks over time.
Alberta has committed to enforcing a minimum floor price for TIER credits beginning in 2030. This is a critical “insurance policy” that will prevent carbon markets from collapsing and will provide a binding price for investment certainty.4Prime Minister of Canada. 2026a. “Canada and Alberta Strike Agreement to Diversify Our Exports, Reduce Emissions, and Build a Stronger Economy.”
The analysis below demonstrates that industrial carbon pricing from the $65/tonne headline price in 2023 generally added less than $1.12 per barrel (bbl) to the marginal cost (the cost of producing one more barrel) of dilbit in the Alberta oil sands. At the extreme upper end, some oil sands projects currently face net carbon pricing costs of $4.05/bbl, while projects with low emissions intensities benefit from industrial carbon pricing, reducing (effectively subsidizing) their effective marginal costs of production by up to $1.09/bbl (see Table 2). This is in line with other estimates of the per-barrel cost, such as Sawyer (2026), who projects a cost of “a Timbit per barrel” as noted by Beugin and Linden-Fraser (2026).5While the Sawyer (2026) projection quoted by Beugin and Linden-Fraser (2026) is lower than the estimates produced here, the difference is due to a subtle distinction between what each of us is estimating. Sawyer estimates how much TIER reduced net revenues, whereas my analysis examines how much TIER increases costs. When looking at competitiveness, I prefer the cost approach due to variability in the royalty rate. The royalty rate is variable and directly proportional to Western Canadian Select (WCS) and West Texas Intermediate (WTI) pricing. As a simple example, if the bitumen price falls to a point where it is equal to marginal cost for a post-payout oil sands facility, they pay no royalties. So, the royalty system can reduce the impact TIER has on profitability, but it does not shield projects from TIER-related costs. That said, scaling my results by Sawyer’s tax shield parameter generates similar results.
This paper relies heavily on a methodology adapted from Fellows (2022). In addition to adapting that methodology to the present issue of assessing the impact of carbon pricing on oil sands economics, the arguments developed below implicitly rely on the importance of basing policy decisions on marginal cost (as opposed to average cost) in the Canadian oil sands. Specifically, they rely on the idea that the lengthy capital cycles for oil sands projects imply short-run thinking about legacy production instead of long-run thinking, within the formal economics definition of the short run as the longest period during which the amount of physical capital in a production function is fixed. Readers may gain additional insight from the previous paper if they are familiar with the arguments and assessments presented in Fellows (2022).
In considering the methodology employed below, readers should note that the analysis and results are presented as costs of delivered diluted bitumen (dilbit) rather than bitumen. Bitumen is a viscous crude oil (roughly the consistency of peanut butter) extracted from the Canadian oil sands. To ship bitumen by pipeline, it is mixed with a diluting agent. The blended product, called dilbit, can then be shipped to a heavy oil refinery to be processed into refined petroleum products, or to an upgrader to be “upgraded” into synthetic crude oil, a light sweet crude suitable for further processing.6Oil Sands Magazine. 2020. “Products from the Oil Sands: Dilbit, Synbit and Synthetic Crude Explained.” https://www.oilsandsmagazine.com/technic. Special attention should be paid to the distinction between bitumen and dilbit metrics discussed below.
Additionally, the analysis focuses primarily on marginal costs. As argued in Fellows (2022), short-run marginal costs are the most appropriate metric for assessing the competitiveness of existing (brownfield) oil sands facilities. Prices above short-run marginal cost imply that existing facilities will find it more profitable to continue producing or expand, whereas prices below short-run marginal cost imply that it is more profitable to shut-in production (this is commonly referred to as the “short-run shut down” condition in elementary microeconomic theory).
For new greenfield projects, the average total cost rather than the short-run marginal cost is the more relevant competitiveness metric. Any firm facing a price below average cost is earning a negative profit. As a result, new entry is not expected unless the expected prevailing price for oil sands bitumen exceeds the expected average cost of production for a new entrant.
That said, examining how carbon pricing affects the marginal cost of production also provides insight into how carbon pricing affects the average total cost of production. Carbon pricing alone has no impact on the fixed costs of a new oil sands project. A project may choose to adjust its capital expenditures to lower emissions (such as investing in carbon capture technology), which would increase fixed costs; however, a rational profit-maximizing firm would only choose to do so if that decision proved more cost effective than paying the carbon pricing costs associated with avoided emissions. That is, given a choice between reducing emissions intensity (to reduce carbon pricing payments) and simply paying the carbon tax, a rational firm will do whichever is cheaper. As a result, the per-barrel carbon pricing impacts represent an upper limit on the overall impact carbon pricing might have on average total costs, since any investment in intensity reductions will cost less than simply continuing to pay the carbon price.7Consider a simplified cost function where total cost can be represented by: [(average variable cost + carbon price per barrel) X (quantity) + (total fixed cost)]. The average total cost can then be represented by: [(average variable cost + carbon price per barrel) + (total fixed cost) / (quantity)]. Whereas the average variable cost including the carbon price is: [(average variable cost + carbon price per barrel)]. So, it follows that for an individual oil sands project, the per barrel carbon price increases average total cost by the same amount it increases average variable cost (and, by extension, short-run marginal cost, which in this case is equivalent to average variable cost).
A Crash Course on the Technology Innovation and Emissions Reduction Regulation
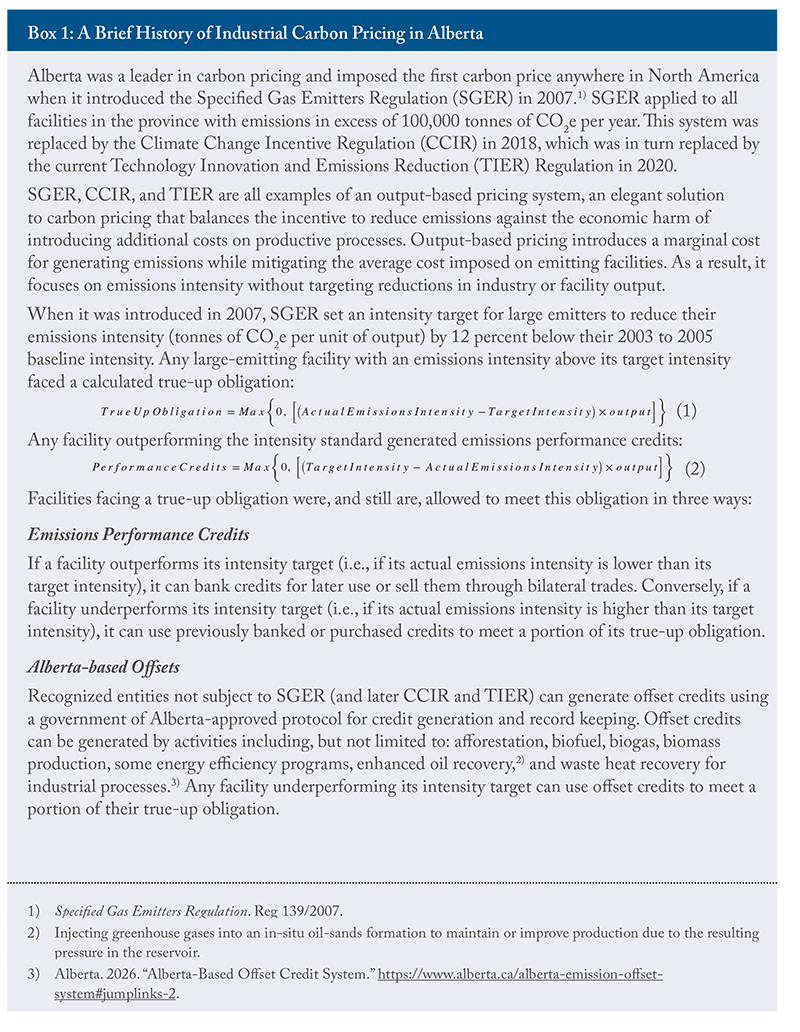
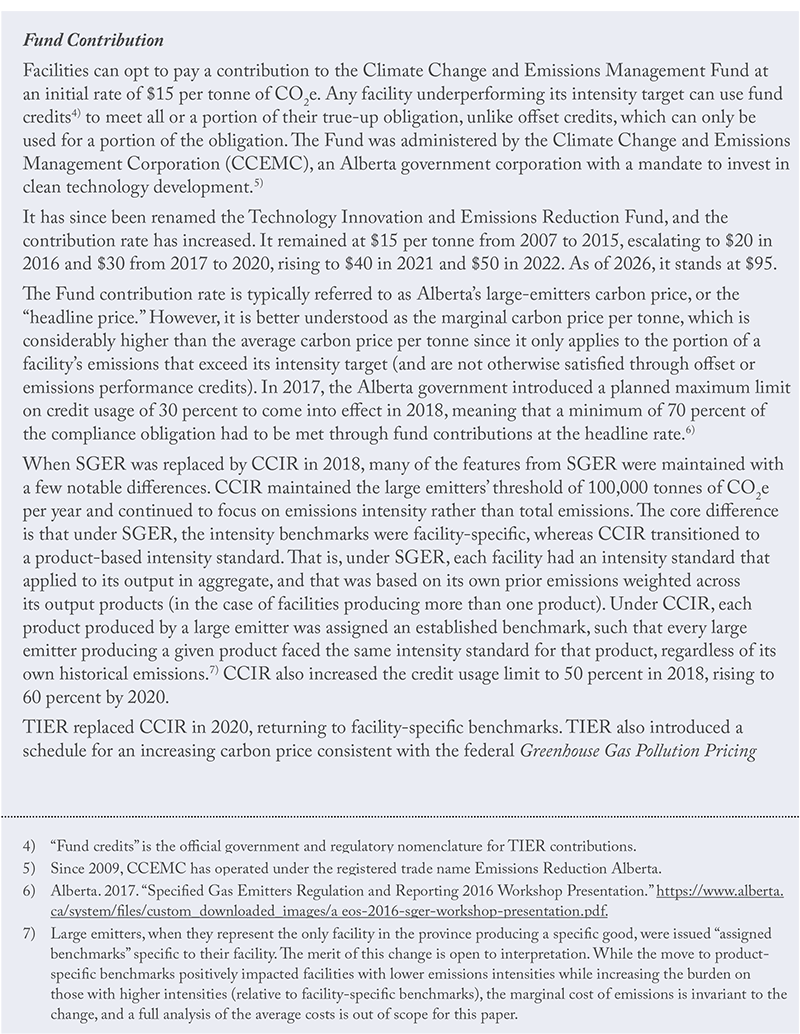
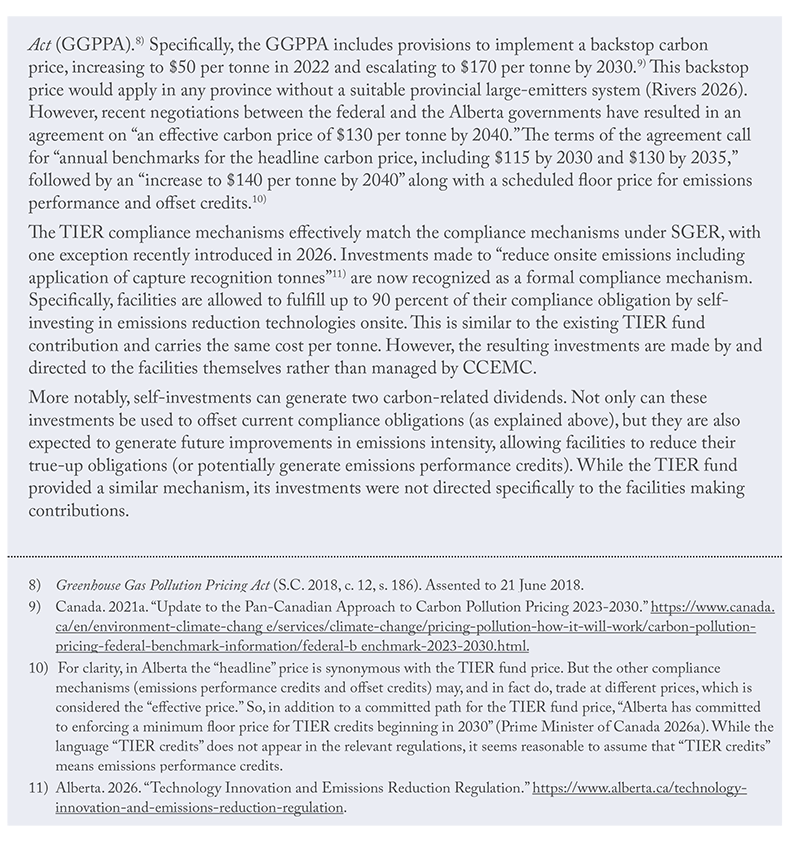
Alberta’s current approach to reducing emissions from large emitters employs a hybrid model, incorporating some aspects of a traditional Pigouvian-style carbon price (Pigou 1932) and a traditional cap-and-trade market. While the current legislation covering large emitters in Alberta has only been in place since 2020,8Technology Innovation and Emissions Reduction Implementation Act. Bill 19, Statutes of Alberta 2019. the province has a lengthy history of pricing emissions from large emitters.9For more context on how output pricing works under different implementations, see: Dobson et al. (2017).
Average versus Marginal Costs Associated with TIER
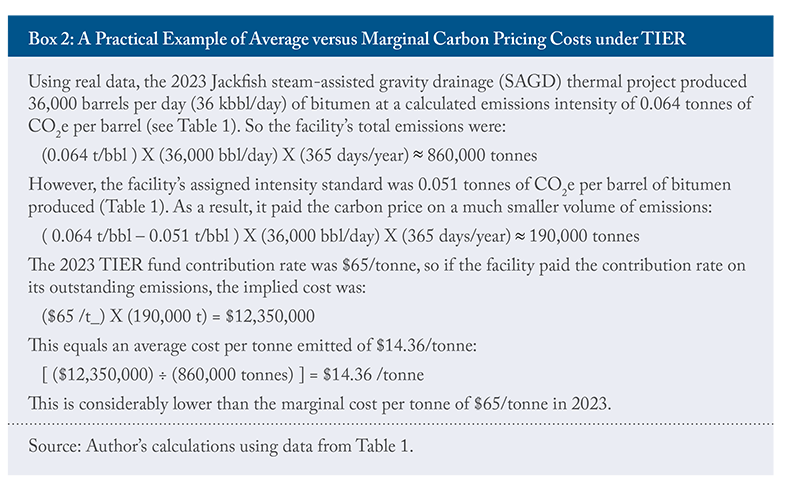
With TIER, as with all output-based carbon pricing systems, there is a critical distinction between the average and marginal carbon price per tonne. The marginal price per tonne is the additional cost associated with an additional tonne of emissions, whereas the average cost is the total carbon pricing-related cost divided by total emissions. The online Appendix describes the distinction for TIER in detail; however, the following practical examples illustrate the difference between average and marginal costs.
Consider a facility currently producing 100,000 tonnes of regulated emissions a year, facing a carbon price of $95/tonne and with an intensity standard that is 90 percent of its existing emissions intensity.
The current carbon pricing cost for that facility is:
($95/tonne) x (100,000 tonnes) x (1-0.9) = $950,000
The average cost per tonne is then:
$950,000 / 100,000 = $9.5/tonne
But if the facility increases emissions by one tonne (holding production constant), it faces an additional cost of $95. The marginal cost is therefore $95/tonne.
Planned Escalation in the Headline Carbon Price
As discussed above, both the federal carbon pricing backstop and the current TIER regulations call for an annual escalation in the TIER contribution carbon price. The recent Alberta-federal agreement on carbon pricing10Prime Minister of Canada. 2026a. “Canada and Alberta Strike Agreement to Diversify Our Exports, Reduce Emissions, and Build a Stronger Economy.” modifies this schedule. While the original federal backstop price schedule called for a linear increase up to $170/tonne by 2030, the newly agreed schedule is more gradual. The new agreement also includes a price floor for credits. This is important since the credits can, and recently have, traded at prices below the headline TIER fund contribution price. Figure 1 shows price schedules consistent with these changes.

Planned Changes in the Stringency of Reduction Targets
Under TIER, the intensity standards for individual oil sands projects fall into one of two approaches: a facility-specific benchmark (FSB) or high-performance benchmark (HPB). FSBs are based on a facility’s own historic emissions intensity during a benchmarking period, whereas the HPB is based on the best-performing facility or facilities in the sector. Large emitters under TIER are subject to the least stringent of the two targets.
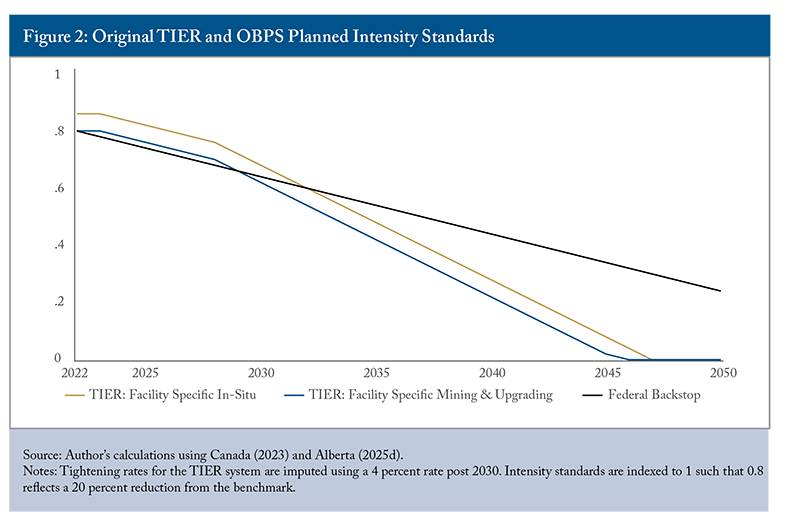
In addition to an escalating headline carbon price, the federal Output-Based Pricing System (OBPS) includes a schedule for tightening the credit allocation rate.11Greenhouse Gas Pollution Pricing Act. Assented to 21 June 2018. Alberta’s TIER system similarly includes a schedule for tightening the credit allocation rates for both in-situ (oil extracted from underground without mining) and mining, and upgrading oil sands facilities.12Alberta. 2026. “Standard for Developing Benchmarks: Technology Innovation and Emissions Reduction Regulation. Version 2.4.” https://open.alberta.ca/publications/standard-developing-benchmarks-tier-version-2. However, the TIER schedules will be adjusted to reflect the 2026 Alberta-federal MOU. Figure 2 shows the credit allocation rates for the federal backstop and the old (facility-specific) rates under TIER as they were defined prior to the MOU. Figure 3 shows the old and new TIER tightening rates as of June 2026 for mining facilities (panel A) and in-situ facilities (panel B). As the figures demonstrate, the new rates will apply distinctly to oil sands facilities in three groups:
- firms that are members of the Oil Sands Alliance (a consortium of oil sands companies cooperating on a proposed carbon capture and storage network in northeastern Alberta);
- large oil sands operators; and,
- small oil sands operators.
Comparing Figures 2 and 3, it is evident that the new TIER rates will reduce the burden on oil sands firms beyond 2030. The vertical axis in both figures essentially measures the free allocation of emissions performance credits accruing to an oil sands project (relative to a benchmark). While the new rates fall faster during the first few years after 2026, the old rates (those in the regulations prior to May 2026) fall significantly faster after 2030. As a result, there will be a larger wedge between the headline or marginal carbon price and the average carbon price going forward under the new rates. As the target intensity increases, a facility’s true-up obligation decreases (see equation 1). Since the average carbon price is directly proportional to the true-up obligation, the average carbon price also declines as the true-up obligation falls. The headline carbon price, however, is invariant to the size of a facility’s true-up obligation. As a result, a declining true-up obligation reduces the average carbon price while leaving the headline carbon price unchanged, widening the gap between the two.

Additional Practical Considerations
The simplified discussion above assumes that the marginal carbon price is equal to the headline carbon price ($15 per tonne in 2007, now $95 per tonne in 2026). But this is an oversimplification used for exposition.
Recall that facilities can satisfy their true-up obligations through TIER fund contributions (the headline carbon price), emissions performance credits, or Alberta-based offsets. While the prices for performance credits and offsets are not public, proprietary market tracking indicates that these credits trade at a deep and increasing discount relative to the headline carbon price. Figure 4 shows a reconstruction of credit market prices using prior work for pre-2024 prices (Dizon and Bishop 2024) and a commercial carbon market tracking service13Carbon. 2026. “Alberta Technology Innovation and Emissions Reduction Market Pricing Dashboard. Online dashboard for carbon market pricing data.” https://www.ccarbon.info/marketcategory/cap-and-trade/#alberta-tier. for prices after July 2024. The credit market price series is based on samples of individual carbon exchange prices, rather than a formal spot price. Comprehensive data on market prices in Alberta’s carbon credit markets are not collected centrally or made publicly available, so these should be treated as illustrative estimates, not definitive values.
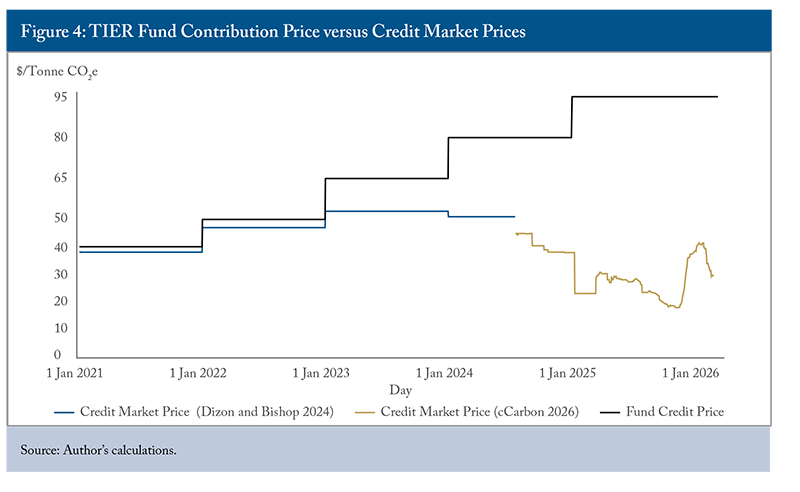
As the figure demonstrates, the TIER fund contribution and credit market prices track very closely through to the end of 2022, after which they diverged considerably. Since credit market prices reflect the average price across multiple transactions (rather than a single posted price), the minimal discount between the credit market and TIER fund prices in 2021 and 2022 suggests that many, perhaps most, credits traded at the same price as the TIER fund, with only a few trading below that level and pulling the average down slightly. In those years, the TIER fund price likely acted as a binding price cap on many or most credit market transactions. Starting in 2023, the TIER price escalation effectively relaxed this price cap, allowing the credit market to find its own equilibrium price. By 2024 and beyond, increases in supply and/or decreases in the demand for credits have further suppressed the market price for credits.
Once more, the Alberta-federal MOU includes a commitment to “a minimum floor price for TIER credits beginning in 2030.”14Prime Minister of Canada. 2026a. “Canada and Alberta Strike Agreement to Diversify Our Exports, Reduce Emissions, and Build a Stronger Economy.” This will bring the effective credit price closer to the headline price.
As mentioned above, facilities with a true-up obligation are required to use TIER fund contributions to satisfy a minimum portion of that obligation (at least 40 percent in 2023, 30 percent in 2024, 20 percent in 2025, and 10 percent in 2026 and beyond). Figure 5 shows the use of emissions performance credits, offset credits, and TIER fund contributions to satisfy the aggregate true-up obligation across all of Alberta’s large emitters (not just the oil sands) from 2007 to 2024. It illustrates that, in 2023 and 2024, facilities used essentially the minimum required amount of TIER fund credits. This reflects the higher TIER fund contribution cost relative to the lower credit market prices.

Despite this, the modelling exercise assumes that the TIER fund contribution price is the marginal price faced by any oil sands firm with a true-up obligation, and that emissions performance credits can be sold at a price equal to the TIER fund contribution price. While this assumption is demonstrably flawed, it is adopted for four reasons:
- Due to the lack of market transparency and the lack of available public pricing data, the sources for the credit market price data in Figure 4 differ by period, and the presented averages do not represent all traded prices.
- This pricing assumption simplifies future projections for carbon pricing costs, avoiding the implicit error in attempts to forecast future credit market prices.
- As noted, the new MOU defined a price floor for credits that, as discussed below, will close much of the gap between the headline price and the prices at which permits are traded.
- The assumption gives an upper bound on the impacts of TIER.
This final point is perhaps the most relevant since it establishes the results below as a known upper bound on TIER price impacts. This is preferable to introducing an unknown bias or forecasting error into the analysis.
Methodology, Data Limitations, and Assumptions
The methodology used in this analysis borrows heavily from Fellows (2022). Specifically, I adopt that same methodology to calculate project-specific marginal costs of production for oil sands bitumen and dilbit using 2023 data.15Alberta. 2025b. “Alberta oil sands royalty data. Open Government Portal.” https://open.alberta.ca/opendata/alberta-oil-sands-greenhouse-gas-emission-intensity-analysis. I then estimate the carbon pricing costs using additional data on emissions compliance true-up obligations available from the Alberta government.16Alberta. 2025a. “Alberta oil sands greenhouse gas emission intensity analysis. Open Government Portal – Royalty Data.” https://open.alberta.ca/opendata/alberta-oil-sands-greenhouse-gas-emission-intensity-analysis.
While the province’s royalty transparency data provides a very rich source for calculating production costs by oil sands project, the available data on carbon compliance costs is significantly more limited. As noted above, facilities have multiple options for meeting their compliance obligations, including emissions performance credits, offset credits, contributions to the TIER fund, and, more recently, investments in on-site emissions reductions. The per-tonne costs in the credit markets are historically unobservable and not easily forecastable going forward.
A related limitation of this methodology is that I am unable to identify the portion of remaining marginal costs associated with already introduced decarbonizing activities. As shown by Birn and Hwang,17Birn, K., and C. Hwang. 2025. “Absolute Oil Sands Emissions Continue on Slower Growth Track. Market Briefing, S&P Global Commodity Insights.” S&P Global. October 28. https://www.spglobal.com/energy/en/news-research/blog/crude-oil/102825-canada-oil-sands-greenhouse-gas-intensity-emissions-slower-growth. the oil sands have reduced average per-barrel emissions intensities since at least 2009. These efforts presumably have introduced additional production costs that are captured in the marginal cost projections below. As a result, the focus here is on the identifiable compliance costs that facilities face to meet their true-up obligations.
The available data is sufficient to reconstruct benchmark intensities for each facility.18While there is no publicly available data source that indicates which facilities are subject to facility-specific benchmarks versus the high-performance benchmark, Alberta does have public data on the “true-up obligation” for each facility to meet its intensity standard (as measured in CO2e) and overall emissions per facility per year. As a result, the assigned intensity standard can be recovered and combined with the known tightening rates to reconstruct the benchmark intensities. Recognizing that the true-up obligation is the difference between the facility’s observed emissions intensity (G/Q) and an intensity standard, which is the product of the benchmark intensity (ỹ ) and a scalar
  (a) representing the benchmark reduction in a given year, it follows that:


Given the known tightening rates (Figure 2 and Figure 3), it is possible to determine an appropriate value for a  . It is then straightforward to use the known emissions intensity (G/Q) and the known true-up obligation for an oil sands project in any year to recover the initial benchmark intensity ỹ
 .
.
To determine the intensity target for a specific facility in any given year, it is a simple matter of multiplying the calculated benchmark ỹ by the appropriate intensity standard from Figure 2. In the projections below, I use the Pathways Project rate for any oil sands project associated with an Oil Sands Alliance member firm. As the existing documentation does not define large and small facilities, I assign the large intensity standard to any oil sands project producing more than 100,000 bbl/day, which is roughly equivalent to the average daily production across projects in the dataset. Separate intensity standards are assigned for mining and in-situ facilities as appropriate.
To avoid ambiguity, I adopt assumptions that overestimate costs whenever assumptions are required. This is intentional as it replaces an unknown bias or error with a known bias. In effect, the assumptions and the analysis that follow represent an upper limit on the cost impact of carbon pricing. To overcome the remaining data limitations, the analysis below makes use of three assumptions.
Assumptions
First, I assume that the cost per tonne for all compliance options is equal to the headline carbon price. This approach seems relatively accurate looking at past data for 2023 and earlier (Bishop and Bernstein 2022; Dizon and Bishop 2024),19Also see: Tuttle, Robert. 2024. “Weak Carbon Prices in Oil-sands’ Home Seen Slowing Climate Gains.” Bloomberg News. September 18. https://www.bloomberg.com/news/articles/2024-09-18/weak-carbon-prices-in-oil-sands-home-seen-slowing-climate-gains. but may be less accurate for future projections if the currently observed credit oversupply conditions persist. However, the implementation of a price floor after 2030 will limit the overall error here (see Figure 1).
Second, I assume that all facilities are currently subject to FSB rather than a single HPB. The true-up obligation data are available up to 2023, and applying the equation presented earlier in this section generates a distinct intensity standard for each oil sands facility in the available dataset. Since the HPB would not differ between facilities, it seems reasonable to assume that all the facilities (or at least more than one) are subject to FSB, not the HPB.20The HPB are set relative to the average emissions intensity of the top 10 percent facilities in the sector, benchmarked product over reference years, while the FSB are relative to a facility’s own historic emissions. Under the existing regulations, facilities are subject to the less strict of the two benchmarks. Since oil sands mines are treated as a different industry as in-situ facilities, and since there is substantial variance in emissions intensities across the sector, it is possible, or even likely that most facilities would default to FSB standards as the weaker of the two. Regardless, absent additional information, assuming these facilities are subject to FSB does not materially change the analysis.
Finally, I assume no further improvements in emissions intensities for oil sands producers. While the sector has shown improvements since the introduction of carbon pricing,21Birn, K., and C. Hwang. 2025. “Absolute Oil Sands Emissions Continue on Slower Growth Track. Market Briefing.” S&P Global. October 28. https://www.spglobal.com/energy/en/news-research/blog/crude-oil/102825-canada-oil-sands-greenhouse-gas-intensity-emissions-slower-growth. future reductions, if they occur, will almost certainly be associated with increases in oil sands project marginal costs. However, a rational profit-maximizing firm will only adjust their production techniques if the associated marginal cost is less than the avoided TIER costs.
While these assumptions represent potential inaccuracies in the analysis below, any resulting errors will exaggerate the impact of carbon pricing on oil sands marginal costs per barrel. To the extent that facilities can meet their compliance obligations through credits priced below the headline carbon tax, their average carbon pricing-related costs will be lower. Additionally, since facilities are subject to the less stringent of the HPB versus FSB approaches, assuming a facility is subject to FSB is either accurate (if FSB is less stringent than HPB) or exaggerates the compliance cost (if FSB is more stringent than HPB).22While the assumption that all firms are subject to FSB rather than HPB has no impact on calculations of the current or past cost burden associated with carbon pricing, there may be a material impact on projected future burdens. This is because current and past calculations are based on reported rather than projected intensity standards. The FSB versus HSB assumptions are required to recover the initial benchmarks for each facility, which are only required here to support future projections.

Results
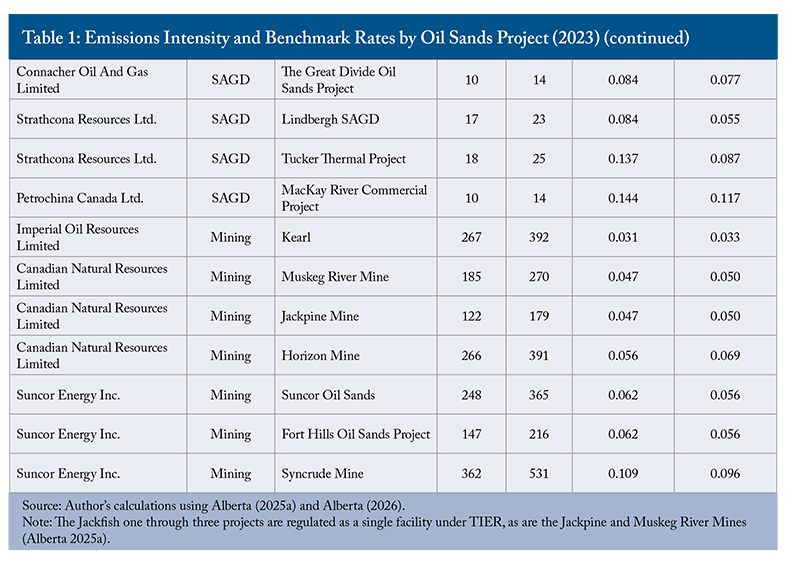
The calculated benchmark intensities ( ) and observed intensities (γ) for oil sands facilities in 2023 are shown in Table 1. On a production-weighted basis, about a third of all oil sands facilities have emissions intensities below their benchmark rate intensity target.
The different technologies used in oil sands extraction are grouped into three categories here: cyclic steam stimulation (CSS), SAGD, and surface mining (mining). Despite the differences in technology and geology, the emissions intensity ranges are similar for all three technologies. As shown in Table 1, the intensity range for mining is 0.03-0.11 tonnes of CO2e/bbl. For SAGD, it is 0.04-0.14. CSS is tighter, but similar at 0.10-0.13.
TIER Impact on Marginal Cost Per Barrel in 2023
To determine the portion of an oil sand facility’s marginal costs attributable to carbon pricing, I first scale the benchmark intensities calculated in Table 1 by the credit allocation rates illustrated in Figure 1. The product of the benchmark intensity and the allocation rate determines the facility’s per-barrel emissions intensity target (a ỹ). Subtracting the intensity target from the observed intensity produces the emissions compliance true-up obligation  where Q is the quantity of production measured in barrels. Then, assuming an effective carbon price per tonne (τ), the carbon tax per barrel can be calculated as:


Disaggregating carbon pricing costs from the rest of the oil sands marginal costs serves two purposes. First, it allows a comparison of observed historical costs in the oil sands with counterfactual costs, were the TIER large-emitters system not in place. Second, it allows an assessment of future scenarios under planned increases in the headline carbon price and changes in facility emissions intensity targets.
Figure 6 shows the marginal cost curves for production of dilbit (including sustaining capital, diluent, and transportation charges to transport it to the Western Canadian Select [WCS] hub) with (actual) and without (counterfactual) $65/tonne carbon pricing costs in place. The same results are presented in numerical form (indicating specific projects) in Table 2, which lists projects from lowest to highest marginal cost to match Figure 6.23Note that Figure 6 truncates the marginal cost curve to exclude the top 1 percent of production on a marginal cost basis to produce a meaningful scale for the vertical axis.
The shift in the marginal cost curves is not parallel because different projects have different emissions intensities and intensity targets. Consequently, the difference between actual and target intensities is also heterogeneous across projects (Table 1). As a result, the carbon price has a larger effect on projects with larger gaps between actual and target intensities than those with emissions intensities very close to target. The curves are constructed in merit order (lower overall costs on the left, higher on the right), so in some cases the impact of the carbon price is sufficient to push a project to a new position on the curve.
As Figure 6 shows, there is little visible difference between the marginal cost curve for operating expenditures (OpEx), shipping, and depreciation with or without the effect of the TIER carbon price. Put another way, the figure demonstrates that TIER has little to no impact on the oil sands marginal cost curve across most oil sands projects. Removing TIER causes the observed and counterfactual marginal cost curves to lie almost entirely on top of one another, indicating only small differences in per-barrel marginal costs.


Figure 6 and Table 2 jointly show that the per-barrel impact of carbon pricing across oil sands facilities ranged from a high of $4.05/bbl for the relatively small Tucker Thermal SAGD project, to a low of -$1.04/bbl for the larger Horizon Mine, and -$1.09/bbl for the relatively tiny Peace River CSS project. Negative values represent an effective subsidy.
Given that the operating costs for 99 percent of operators are between $21 and $65 per barrel, the carbon price represents a small portion of overall marginal costs in the oil sands. Some projects (including Jackpine Mine, Muskeg River Mine, Horizon Mine, Christina Lake Thermal, Hangingstone, Long Lake, Kearl, Sunrise, and Peace River) benefit from TIER on a per-barrel basis. Across all facilities, the carbon price added an average of $0.70 per barrel in 2023. However, the production-weighted average increase was $0.34 per barrel. This indicates that larger facilities perform better relative to their emissions targets than smaller facilities.

Future Projections
As discussed, planned changes to the headline carbon price and the stringency of performance credit allocations will impact the marginal and average carbon price per tonne. If individual projects can reduce their emissions intensity (that is, if the carbon price successfully incentivizes intensity reductions), true-up obligations will also shrink. In so doing, these planned policy changes and changes in facility emissions intensity will affect the carbon price per barrel for oil sands projects. As shown in Figure 1, the headline carbon price will be $115/tonne under the new price schedule, compared with $170/tonne (under the original federal backstop) by 2030. Similarly, Figure 3 shows the planned FSB intensity standards will be less stringent under the new MOU than under the previous schedule.24The results in this section refer to the per-barrel cost of producing dilbit and delivering it to the Western Canadian Select hub rather than the per-barrel costs for bitumen production at the royalty calculation point. For policymakers, the dilbit costs are more relevant because it is possible to more directly compare them to the public oil prices (i.e., WCS), whereas bitumen costs at the royalty calculation point would need to be compared to the price they are getting, or the bitumen valuation deemed price, at the royalty calculation point. This is different for every oil sands project. However, I do consider the bitumen costs below in the following section.
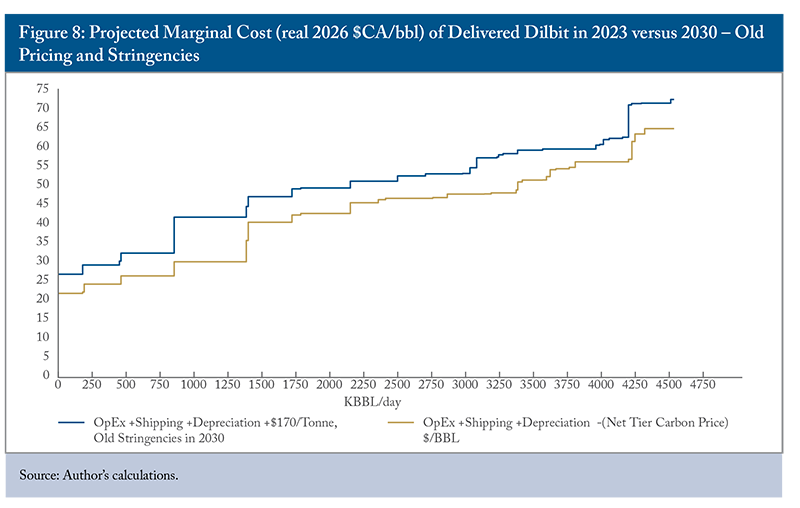


Figures 7 and 8 show the carbon pricing impacts under the new and old price and intensity target schedules projected to 2030, respectively. Figure 9 and Figure 10 also show the corresponding projections for 2050.
Figure 7 simulates the new MOU intensity standards and a headline carbon price of $115/tonne applied to the 2023 oil sands project marginal costs, assuming no further improvements in emissions intensities. As a result, this is essentially the cost imposed on the industry if the carbon price does not work to lower emissions. The changes to the headline carbon price and intensity standards agreed upon by Alberta and the federal government result in most projects facing cost increases well under $5 per barrel.
By comparison, Figure 8 shows that under the original intensity standards and a $170/tonne carbon price in 2030, most projects would still have faced cost increases of less than $5 per barrel.
Moving to 2050, the TIER fund price rises to $140 per barrel under the newly agreed schedule. At this new price and under the new intensity schedules, Figure 9 demonstrates only a modest difference between the marginal cost curves with and without the effect of the carbon price.
If intensity standards were allowed to become more stringent, falling by 4 percent past 2030 as scheduled under the old intensity schedules, both mining and in-situ facilities would reach full stringency by 2050. That is, these projects would no longer receive performance credits and would face a carbon price applied to 100 percent of their emissions. Assuming a carbon price at $170/tonne, this introduces a more dramatic increase to the per-barrel marginal costs as depicted in Figure 10. Even under this scenario, no project faces a cost increase of more than $10 per barrel.
If facilities invest in emissions reductions, it is logical to assume that these investments will cost less than paying the carbon tax they would otherwise pay. If reducing emissions costs more than paying the associated carbon price, a rational profit-maximizing firm will choose to pay the carbon price instead. Conversely, if reducing emissions is less expensive, firms will invest to lower emissions. To see this, note that if it costs more to reduce emissions than to pay the associated carbon price, a rational profit-maximizing firm would choose to pay the carbon price. The corollary is also true; if it is less expensive to reduce emissions than it is to pay the carbon price, firms will make investments and incur spending to reduce emissions. As a result, Figures 7 through 10 should be interpreted as upper bounds on the projected cost projections. To the extent that facilities spend to reduce their emissions intensities, the overall cost burden will be lower (even after accounting for those investments).
An alternative way to visualize these cost increases is to plot the distribution of net TIER costs across all oil sands barrels. Figure 11 shows the barrel-weighted distribution of net carbon pricing across oil sands barrels for 2026 (actual) and the projected distributions for 2030 and 2050, assuming the new intensity standards in Figure 3 apply and that the carbon price follows the new pricing schedule shown in Figure 1.
For comparison, Figure 12 shows the same distribution under the old prices and intensity standards in Figure 2. When the intensity targets are all set to zero, as they do in 2050, an oil sands project’s underlying emissions intensity becomes the sole determinant of variation in project-specific carbon pricing costs. The slightly bimodal distributions in the 2050 projections in Figures 11 and 12 therefore reflect the underlying bimodal distribution of barrel-weighted emissions intensities (Table 1).
Notably, the 2050 cost distribution in Figure 12 looks almost identical to the 2026 distribution, while the 2030 distribution is stretched and shifted to the right. Figure 2 helps explain this result. Under the old schedule, the intensity targets for both mining and in-situ facilities fall at 2 percent until the early 2040s, when they hit zero.
However, the nominal carbon price rises to $170 per tonne in 2030 and stays there. Since the figures throughout are denominated in real 2026 Canadian dollars, the analysis adjusts them for inflation using a 2 percent inflation rate (consistent with the Bank of Canada’s current inflation target). This means the real value of the headline carbon price is falling at 2 percent every year from 2030 to 2050.
If the distribution were examined for each year from 2030 to 2050, it would remain largely unchanged from 2030 to the early 2040s, as inflation reduces the real value of the carbon price by roughly the same amount that tightening intensity targets increase the burden on each facility. Once the intensity targets hit zero in the early 2040s, the inflation effect continues, further eroding the real value of the carbon price. In effect, inflation between the early 2040s and 2050 largely offsets the tightening of intensity targets between 2026 and 2030. However, this observation is mostly moot given the new price and intensity standard schedule.
Discussion
Interpreting and Summarizing the Analytical Results
The marginal cost curves indicate that the industrial carbon price is unlikely to have any real impact on crude oil prices in Western Canada. First off, the marginal (or highest cost) barrels currently face almost no net carbon pricing costs and will continue to face minimal net costs through 2030 under current policies. Second, individual Canadian oil sands producers are price takers. More than 80 percent of Canadian crude is exported to world markets and individual Canadian producers are far too small to exercise market power internationally (Fellows 2025). Since the domestic price for crude oil (absent pipeline capacity constraints) essentially represents the opportunity cost of not selling abroad, Canadian producers are no more able to pass carbon pricing costs through to domestic consumers than they are to export consumers.
As shown in Figures 8, 10, and 12, the old price and intensity standard schedules place a more significant burden on oil sands marginal costs by $2 to $12 per barrel in 2030, although inflation would erode this effect by 2050. However, the new price and intensity schedules further reduce these already modest costs. As shown in Figures 7, 9, and 11, all projected impacts are kept under $5 per barrel out to 2050, with the average substantially lower.25Recall that the above analysis assumes a marginal carbon price equal to the fund contribution price when, in reality, a significant portion of the true-up obligation can be satisfied through lower-priced offsets or emission performance credits (see Figure 3).
As explained in Fellows (2022), oil sands producers will continue to produce bitumen if the marginal cost of dilbit delivered to the WCS hub is lower than the price obtained there. Put another way, they will continue to produce as long as marginal revenue (the price) exceeds marginal cost.26Recall the earlier assertion that these producers are price takers with no or very little market power, such that marginal revenue is equal to price. While modest current and near-term net carbon pricing costs are very unlikely to have pushed the marginal cost above the WCS price, future costs are higher given the rising headline carbon price and more stringent intensity standards. Even so, they remain well under $5 per barrel by 2050. Furthermore, if carbon capture utilization and storage (CCUS) projects (such as the Pathways Project) significantly reduce emissions intensities across a sufficient volume of production, and if credit market prices are allowed to remain at lower rates through complementary policies, then the realized marginal cost impacts will be even lower than those projected here.
The current low prices in the TIER emissions credit market (Figure 4) and the low overall costs for the oil sands (even under the conservative assumption that facilities face the higher fund credit price) suggest that current decarbonizing price signals are weaker at the margin than often assumed.
The interpretation is that TIER’s intensity standards are not stringent enough. If intensity standards were tighter, there would be less supply of emissions performance credits and more demand for emissions performance and offset credits, and potentially a higher utilization of the currently more expensive TIER fund contribution compliance mechanism.
Another interpretation is that the offset market is working well in incentivizing decarbonization outside of the oil sands and other large emitters subject to TIER. Figure 5 shows that the use of offset credits to meet true-up obligations has grown substantially since 2022, despite (or perhaps because of) the decline in credit market prices shown in Figure 4. So, while the price signal within TIER (particularly for the oil sands) is weak, it is nonetheless generating lower-cost emissions reductions in the offset market.
Domestic Policy Implications
Fundamentally, large-emitters systems (TIER in Alberta and the federal OBPS backstop) may be ill-equipped to deliver net-zero outcomes in line with the Canadian Net-Zero Emissions Accountability Act,27Canadian Net-Zero Emissions Accountability Act (S.C. 2021, c. 22). which calls for Canada to reach net-zero emissions by 2050. Carbon pricing is based on the concept of a Pigouvian tax, which attempts to correct a market failure arising from a negative externality. Under the theory behind this kind of instrument, there is a “correct” amount of emissions at which the total social costs (including the externality) are equal to the total social benefits at the margin. That level may or may not be zero. If it is zero, however, a carbon price high enough to eliminate emissions would be functionally indistinguishable from a regulatory cap requiring zero emissions. As the results above indicate, such an approach could introduce a substantial economic cost on Canada’s emissions-producing sectors. Governments should consider this trade-off when evaluating climate legislation against national emissions goals.
International Competitiveness
Medium- and long-term crude oil forecasts fall well beyond the scope of this paper and are highly uncertain at present, given the war in Iran. However, echoing the arguments in Fellows (2022), oil sands producers can be expected to continue producing at any price above their marginal cost (including transportation to the WCS hub and sustaining capital). While oil sands production has shown persistent and incredibly stable growth over the last 20 years, the carbon price will account for a larger contribution to these marginal costs over time. For some facilities, marginal costs could eventually exceed the prevailing WCS price, particularly if it returns to its pre-war levels. Should that happen, oil sands output could decline, imposing economic costs on Alberta and Canada.
As the analysis above shows, domestic carbon pricing has not meaningfully affected global competitiveness in the past, at present, or in the near term.28It is worth noting here that, absent additional analysis, we cannot claim that Canada’s climate change policies (or common misunderstandings of them) have had no effect on investment in the oil sands. Uninformed analysis and misinformation on the overall costs associated with carbon pricing are common, and investors react to available information. As a result, rhetoric around the carbon price could impact investment decisions even if the underlying economic reality shows limited negative impact on the sector. However, by 2050, under current policies, these concerns become more salient if the industry cannot reduce emissions intensities in a cost-effective manner.
Impacts to Government Revenue
Finally, it is worth considering, now and in future, how carbon pricing currently affects and may increasingly affect provincial government revenues.
As oil sands projects age, their lifetime cumulative revenues also grow. A change in how their revenues are assessed for royalty purposes is triggered once cumulative net revenues are deemed sufficient to have paid off their initial capital costs. As projects move from the “pre-payout” royalty phase to the “post-payout” phase, the provincial government moves from taking a small share (1 to 9 percent) of annual project revenues to taking a larger share (25 to 45 percent) of annual profits.29See Fellows et al. (2023) for a full explanation of the royalty system applied to oil sands projects. In effect, the exact royalty rate depends primarily on the West Texas Intermediate benchmark crude oil price. TIER compliance costs are treated as “allowable costs” in this post-payout phase. As a result, the impact of carbon pricing on a post-payout project’s profit is further muted by the royalty system itself.
For example, at a WTI price of $70 per barrel, the post-payout royalty rate is around 30 percent. A rough calculation suggests that every dollar of carbon pricing costs implies a loss of $0.70 in profit and a loss of $0.30 in provincial royalties. That dollar is instead reallocated to a combination of (1) offset credit sellers, (2) emissions performance credit sellers (other large emitters with low current or historic emissions intensities), and (3) the TIER fund.
Corporate income tax revenues are also affected as TIER compliance costs are a deductible expense for corporate income tax purposes, while credit sales revenue is taxable as income. The aggregate effect is difficult to determine. But as long as projects make TIER contributions, overall expenses will likely exceed credit revenues, implying a modest reduction in corporate income tax revenues.
The provincial and federal governments should account for these effects when considering the future of carbon pricing in Alberta’s oil sands.
The Future of Industrial Carbon Pricing in Canada
In considering the future of carbon pricing in Canada, it is critical to understand the past. Alberta’s TIER system is now almost two decades old. While there have been disagreements on stringency and policy details, even with the transition from SGER to CCIR to TIER, the system has proven extremely resilient to changes in provincial and federal governments.
As federal legislation and the federal backstop draw more attention to provincial systems like TIER, policymakers and commentators should understand the systems already in place. TIER, as shown above, is far more complex than the recently repealed consumer-facing carbon tax, and that complexity exists for a reason. It provides more nuanced policy levers, including intensity targets, the headline fund contribution rate, and offset credit rules. Used effectively, these levers can continue to reduce emissions while limiting economic costs. The core question, common to all policy decisions, is how to fine-tune the tradeoffs.
Abolishing the industrial carbon price risks considerable financial damage to facilities in Alberta that have spent 20 years investing to reduce their emissions intensities, whereas dramatic increases in the headline price and/or intensity stringency risk increasing the overall economic burden of the system. TIER and the other large-emitters systems demonstrate a proven way through which policymakers can adjust this balance now and in the future.
Conclusion
The results above suggest the impact of industrial carbon pricing between now and 2035 ranges from an exceptionally small portion of the overall marginal cost of bitumen or dilbit production in the near term to between $0 and $5/bbl in the longer term under the recent MOU policy announcements. While this analysis is specific to the oil sands, other industries covered by large-emitters carbon pricing systems operate under similar policy structures and market conditions. As a result, these findings are likely to be qualitatively similar for other large-emitting facilities, such as oil refineries, fertilizer producers, and steel and aluminum manufacturers. However, the oil sands are perhaps the most convenient industry to analyze because Alberta’s Royalty Transparency initiative provides unusually transparent, publicly available facility-level cost data.
Another oil sands-specific consideration is the role of the Pathways Alliance, a group of five large oil sands companies that pool research and development related to carbon capture and storage. This resource pooling could lower the fixed and marginal costs of reducing emissions intensity for these firms, which would in turn reduce their carbon pricing burden.
Recent international developments, including Russia’s invasion of Ukraine and the current Iran war (which has led to a partial or full closure of the Strait of Hormuz), have implications for oil sands competitiveness. As noted in Fellows (2022), Canadian producers are price takers and have limited market power. Supply disruptions that raise global crude oil prices therefore make Canadian producers more competitive by widening the gap between price and marginal cost. This, in turn, makes carbon pricing costs less significant than they were in the recent past.
The author extends gratitude to Mawakina Bafale, Colin Busby, Kate Koplovich, and several anonymous referees for valuable comments and suggestions. The author retains responsibility for any errors and the views expressed.
References
Alberta. 2008. “Alberta-Based Offset Credit System.” https://www.alberta.ca/alberta-emission-offset-system#jumplinks-2.
Alberta. 2023. TIER Regulation: Fact Sheet. Technical Report.
Alberta. 2025a. “Alberta Oil Sands Greenhouse Gas Emission Intensity Analysis.” Open Government Portal. Government of Alberta. https://open.alberta.ca/opendata/alberta-oil-sands-greenhouse-gas-emission-intensity-analysis.
Alberta. 2025b. “Alberta Oil Sands Royalty Data.” Open Government Portal. Government of Alberta. https://open.alberta.ca/opendata/alberta-oil-sands-royalty-data1.
Alberta. 2025c. “Defending Alberta Industry During U.S. Tariffs.” Press release. https://ebs.publicnow.com/view/1E133B2E95AF0
D63343C46EF63876A29FB12F1E7.
Alberta. 2025d. “Standard for Developing Benchmarks: Technology Innovation and Emissions Reduction (TIER) Regulation.” Government of Alberta, Environment and Protected Areas. https://open.alberta.ca/publications/standard-developing-benchmarks-tier-version-2.
Alberta. 2026. “Standard for Developing Benchmarks: Technology Innovation and Emissions Reduction Regulation. Version 2.4.” https://open.alberta.ca/publications/standard-developing-benchmarks-tier-version-2.
Beugin, D., and R. Linden-Fraser. 2026. Industrial Carbon Pricing Will Cost Just a Timbit per Barrel for Canada’s Oil Sands Sector. Canadian Climate Institute. March 6. https://climateinstitute.ca/industrial-carbon-pricing-will-cost-timbit-per-barrel-canada-oil-sands-sector/.
Birn, K. and Hwang, C. 2025. “Absolute Oil Sands Emissions Continue on Slower Growth Track. Market Briefing, S&P Global Commodity Insights.” October 28. https://www.spglobal.com/energy/en/news-research/blog/crude-oil/102825-canada-oil-sands-greenhouse-gas-intensity-emissions-slower-growth.
Bishop, G., and M. Bernstein. 2022. Tightening TIER for Alberta’s Decarbonization. Toronto: Clean Prosperity. https://cleanprosperity.ca/wp-content/uploads/2022/09/Tightening_TIER_for_Albertas_Decarbonization.pdf.
Canada. 2007. Turning The Corner: Taking Action to Fight Climate Change. https://publications.gc.ca/site/eng/9.691100/publication.html.
Canada. 2021a. “Update to the Pan-Canadian Approach to Carbon Pollution Pricing 2023-2030.” https://www.canada.ca/en/environment-climate-change/services/climate-change/pricing-pollution-how-it-will-work/carbon-pollution-pricing-federal-benchmark-information/federal-benchmark-2023-2030.html.
Canada. 2023. “Regulations Amending the Output-Based Pricing System Regulations and the Environmental Violations Administrative Monetary Penalties Regulations.” Canada Gazette, Part II, 157(24) https://gazette.gc.ca/rp-pr/p2/2023/2023-11-22/html/sor-dors240-eng.html.
Dizon, E., and G. Bishop. 2024. Strengthening TIER for Alberta’s Low-Carbon Growth: Measuring Credit Oversupply Risks in Alberta’s Carbon Market. Clean Prosperity. https://cleanprosperity.ca/wp-content/uploads/2024/07/Strengthening-TIER-for-Albertas-Low-Carbon-Growth.pdf.
Dobson, S., G. Kent Fellows, T. Tombe, and J. Winter. 2017. “The Ground Rules for Effective OBAs: Principles for Addressing Carbon-Pricing Competitiveness Concerns Through the Use of Output-Based Allocations.” SPP Research Papers 10. https://journalhosting.ucalgary.ca/index.php/sppp/article/view/42633/30512.
Environment and Climate Change Canada. 2021. A Healthy Environment and a Healthy Economy: Canada’s Strengthened Climate Plan to Create Jobs and Support People, Communities and the Planet.
Fellows, G. K. 2022. Last Barrel Standing? Confronting the Myth of “High-Cost” Canadian Oil Sands Production. Commentary 635. Toronto: C.D. Howe Institute. https://cdhowe.org/publication/last-barrel-standing-confronting-myth-high-cost-canadian-oil-sands/.
Fellows, G. K. 2025. “Crude Oil Curtailment and Collusion: Heterodox Trade War Strategies for Canada.” The School of Public Policy Publications 18(1). https://journalhosting.ucalgary.ca/index.php/sppp/article/view/80954/58054.
Fellows, G. K., J. Winter, and A. Munzur. 2023. “An Analysis of Industrial Policy Mechanisms to Support Commercial Deployment of Bitumen Partial Upgrading in Alberta.” Energies 16(6): 2670. https://www.researchgate.net/publication/369216099_An_Analysis_of_Industrial_Policy_Mechanisms_to_Support_Commercial_Deployment_of_Bitumen_Partial_Upgrading_in_Alberta.
Fellows, G. K., R. Mansell, R. Schlenker, and J. Winter. 2017. “Public Interest Benefit Evaluation of Partial-Upgrading Technology.” SPP Research Papers 10(1). https://www.researchgate.net/publication/326548148_Public-Interest_Benefit_Evaluation_of_Partial_Upgrading_Technology.
Leach, A. 2022. “Canada’s Oil Sands in a Carbon-Constrained World.” Canadian Foreign Policy Journal 28(3): 285–304. https://aleach.ca/publications/cfpj.pdf.
Pigou, A. C. 1932. Divergences Between Marginal Social Net Product and Marginal Private Net Product. 4th ed. Macmillan, London.
Rivers, N. 2026. One Federation, Many Prices: A Price Floor for Carbon Pricing in Canada. Commentary 710. Toronto: C.D. Howe Institute. https://cdhowe.org/publication/one-federation-many-prices-a-price-floor-for-carbon-pricing-in-canada/.
Sawyer, D. 2026. “Methodology, & Key Assumptions: Alberta Oil Sands TIER Carbon Cost Model, Technical Documentation V4.” https://envireco.github.io/oil-sands-costs/methodology.html.
Tuttle, Robert. 2024. “Weak Carbon Prices in Oil-sands’ Home Seen Slowing Climate Gains.” Bloomberg News. September 18. https://www.bloomberg.com/news/articles/2024-09-18/weak-carbon-prices-in-oil-sands-home-seen-slowing-climate-gains.
Winter, J., B. Dolter, and G. K. Fellows. 2023. “Carbon Pricing Costs for Households and the Progressivity of Revenue Recycling Options in Canada.” Canadian Public Policy 49(1): 13–45. https://www.jstor.org/stable/27343249.