





The Study In Brief
When it comes to Canada’s retirement-income system, the Canada Pension Plan is the elephant in the room. At the provincial and federal level, debates are active on issues such as: the adequacy of CPP benefits, the eligibility age for CPP retirement benefits, the distributional impact of CPP benefits and the rate at which benefits are being phased in. The political stewards of the CPP should add another issue to the agenda: the financial sustainability of the plan under various risk scenarios. I have deep-seated concerns that the risks involved in managing the CPP are poorly understood. If unanticipated negative risks materialize, the Plan will be subject to significant political as well as economic risks
The best place to look are the valuation reports prepared by the Office of the Chief Actuary (OCA) that serve as working documents for the federal, provincial and territorial ministers of finance who exercise stewardship responsibilities in relation to the CPP. Every three years, these Actuarial Valuation Reports (AVRs) assess the longterm adequacy of the legislated contribution rate to the CPP, based on best-estimate assumptions about the future. They also provide estimates based on alternative plausible assumptions that provide an insight into the range of possible financial futures for the CPP. Importantly, they also estimate the minimum-contribution rate required from employees and the employers to keep the Plan in good health. Trouble arises if this minimum-contribution rate goes higher than the legislated.
This Commentary discusses the implications of these valuation reports, past and present, with a focus on the 30th AVR, the latest, issued in December 2019.
Among my findings:
- On best estimate assumptions, the minimum contribution rate is very close to the legislated rate and exceeds it with variations in most assumptions.
- Over both short and longer term futures, investment returns falling short of best estimate assumptions involve the greatest risk of causing the minimum rate to exceed the legislated rate.
- CPP history provides interesting examples of the long-term future appearing quite different today than when the Plan was established. Fertility, mortality and wage growth provide examples.
The valuation reports reviewed imply the need for regular CPP adjustments as does the actual history of the Plan. The legislation that governs the CPP is highly detailed, and the need to change the detail through legislation can limit the ability to adapt quickly. The legislation should be reviewed to determine what aspects could be moved safely to regulations while maintaining the Plan’s joint federal-provincial character.
Canada’s retirement-income system has a number of component parts that interact with each other – sometimes in ways that are complementary and sometimes not. They are also subject to a variety of demographic, labourmarket, financial and economic influences. There is a need to understand what happens to the whole system in the face of varying circumstances.
A significant outreach effort is needed to enhance public understanding of our retirement-income system. This means more than putting information on a website. Direct engagement with stakeholder groups is required. The OCA can make an important contribution to this process.
Introduction
From the time the Canada Pension Plan (CPP or the Plan) was established in 1966, the Office of the Chief Actuary (OCA) has assessed its long-term financial viability.
The reports prepared by the OCA have served as working documents for the federal, provincial and territorial ministers of finance who exercise stewardship responsibilities in relation to the CPP.11 The CPP’s daily administration is provided by the federal government. But the contribution rates and benefits can be changed only by an agreement between the federal government and two-thirds of the provinces with two-thirds of the population. Because Ontario has more than one-third of Canada’s population, it has a veto over changes in these vital areas. Quebec runs a parallel plan (the Quebec Pension Plan) but is a province for purposes of this voting formula. They also provide important information to MPs, CPP stakeholders and the general public.
The OCA produces regular actuarial valuation reports (AVR) every three years. These reports involve a reassessment of all assumptions about the future. The OCA also produces supplementary reports – as required by CPP legislation – that assess the impact of proposed CPP changes on the Plan’s finances. These supplementary reports rely on assumptions used in the most recent regular valuation report.
Preparing the valuations is not a small undertaking, as the Plan’s future health depends on assumptions about many variables that are unpredictable in the near future, and even more so over longer time frames.
Since 1997, finance ministers have made stabilizing the Plan’s contribution rate a major objective of CPP financing. AVRs since that time have assessed the long-term adequacy of the legislated contribution rate to the CPP, based on best-estimate assumptions about the future. They also provide estimates based on alternative plausible assumptions that provide an insight into the range of possible financial futures for the CPP.
The most recent AVR (30th) was issued in December 2019 and assesses the future financial situation of the Plan as of December 31, 2018. A pair of statements from that report help frame this Commentary.
Its conclusion includes the following statement: This report confirms that the legislated contribution rate of 9.9% is sufficient to finance the base CPP over the long term.22 A similar statement is also made about the newly established additional benefits.
But the 30th AVR also begins a discussion of the “Uncertainty of Results” as follows: This actuarial report on the Canada Pension Plan presents projections of its revenues and expenditures for both of its components, the base and additional CPP, over a long period of time. Both the length of the projection period and the number of assumptions required ensure that actual experience will not develop precisely in accordance with the best-estimate projections.
The first quotation indicates that if events unfold as assumed, the Plan will meet its financial commitments for decades into the future. But the second suggests that we should be prepared for the likelihood that experience will not unfold as anticipated in the best-estimate assumptions.
Indeed, future experience might depart from assumed experience in positive ways that make the Plan more affordable so that it might even be possible to lower contributions or increase benefits. Alternatively, actual experience may depart from assumed experience in negative ways that have the opposite effect.
This Commentary focuses on the risks and uncertainties associated with CPP finances and benefits that are visible in the 30th AVR and concentrates on the implications of negative experience. It does so out of concern that the risks are not widely appreciated and if adverse experience emerges and people have no forewarning that these experiences are even possible, the Plan will face political risks. The CPP’s sustainability rests on popular confidence in the Plan as well as its financial foundations.
The CPP is a complicated plan and the text of this Commentary inevitably reflects that reality. Therefore, in Section 2, I review some key aspects of CPP financial arrangements that help set the stage for later parts of the Commentary.
In Section 3, I note what happens if negative experience takes place and present some indicators of possible negative experiences.
In Section 4, I discuss three aspects of CPP management and their impact on CPP finances:
- How has actual experience compared to assumed experience?
- How have CPP benefit changes affected CPP finances? and
- How have changes in assumptions impacted CPP minimum-contribution rates?
In Section 5, I review individual assumptions used by the OCA.
Finally, I draw conclusions in Section 6.
Section 2: Some Key Features of CPP Financial Arrangements
For three decades, from 1966 to 1997, the CPP was financed on a largely pay-as-you-go (pay-go) basis. Most of the CPP’s contribution revenue was transferred directly from contributors to beneficiaries. Income from investments played a very minor role in CPP financing, and those investments took the form of loans to provincial governments. (Contribution rates in this type of financing are very sensitive to demographic and labour market changes).
In the period from 1998 to 2003, the contribution rate was increased at a more rapid rate than required by pay-go financing in order to build up a reserve fund for the CPP Investment Board (CPPIB) to invest in a diversified portfolio of assets. The objective of this new financing arrangement was to stabilize the contribution rate over the long term. This stabilized rate was to be known as the steady-state contribution rate.
Earlier, the federal and provincial finance ministers had pledged that future benefit increases would be fully funded. In 2016, when they agreed on a small increase in CPP benefits – often referred to as enhancements – it was to be fully funded.
The CPP benefits in place prior to 2016 are now called base benefits, and the newly created phased-in enhancements that started in 2019 are called additional benefits. While there are small differences in benefit calculations between base and additional benefits, they are not material to this Commentary.
What is material is that the financing arrangements are different for the two parts of the Plan. The financing of additional benefits relies much more heavily on investment income. The OCA estimates that by 2095 investment income will represent 42 percent of all base-benefit revenues and 72 percent of additional benefit revenues. (Contribution rates in fully funded plans are very sensitive to investment returns).
It is worth noting too, that the term fully funded when applied to the CPP – especially the base benefits – has a different significance than when applied to workplace pension plans.33 The term workplace pension plan refers to pension plans established for employees at individual workplaces or groups of workplaces. These plans are sometimes referred to as registered pension plans – alluding to their registration with the Canada Revenue Agency. Sometimes they are referred at as occupational pension plans. The term does not include reference to plans like the CPP that enrol virtually every employed and self-employed person. In the context of workplace plans, full funding means that the pension fund has financial assets that are equal to the present value of the benefits that plan members have earned up to the time that the assets and obligations are measured. (Financial assets equal plan liabilities.)
The first time CPP benefits were improved after 1997, the OCA used a methodology for assessing their financial impact that was very similar to what is applied to a workplace pension plan (OCA 22nd AVR). But in 2008, a peer review panel suggested that Canadians would be disturbed if they knew that the base CPP would never be more than onethird funded based on the meaning of full funding as applied to workplace pension plans. Instead, the panel argued that the CPP should adopt a methodology under which the present value of future contributions would be treated as an asset and that the present value of future benefit accruals would be treated as a liability (OCA 2008).44 This AVR’s peer reviewers argued that the adequacy of the steady-state contribution rate is a more important measure of the CPP’s sustainability than its funded status in the workplace pension sphere. The OCA endorsed this view in a 2010 Technical Paper (OCA 2010) noting that the “key financial measure for evaluating the Plan is the steady-state contribution rate.” The OCA refers to the newly adopted methodology as the open-group approach.55 The CPP Act offers no guidance on the appropriate method to be used in valuing the Plan. But the regulations governing the calculation of contribution rates anticipate something like the open-group approach without mentioning it directly.
This approach is consistent with the CPP’s overall financing and is, in fact, used quite widely by other social security pension plans around the world. But, as noted, it does differ from the approach commonly used in workplace pension plans, and the two approaches can produce very different perspectives on the Plan’s funded status.66 Using the open-group method adopted by the OCA, the base benefits are projected to be 100 percent funded, while they are only 30 percent funded under the method common to workplace pensions. Without understanding the open-group method used in assessing the CPP, it is easy to misunderstand what “fully funded” means when applied to the Plan.77 A different actuarial method that does not include the value of future contributions and benefits earned as assets and liabilities respectively has been adopted to assess the additional benefits of the Quebec Pension Plan (QPP). Like the CPP method, the QPP method is not used by workplace pensions. (Retraite Québec 2019) Under the CPP’s open-group methodology, future contributions and benefits earned by new CPP participants are accounted for over the coming 150 years. The different approaches used by the CPP and QPP deserve analysis that is beyond the scope of this Commentary.,88 The difference between the OCA’s actuarial approach and work plans is discussed more thoroughly in Robson and Laurin (2017).
Section 3: Risks in CPP Finances and Benefits if Best Estimates are Wrong
This section addresses two questions:
- What rules apply if negative experience emerges? and
- Is negative experience likely?
What Rules Apply if Negative Experience Emerges?
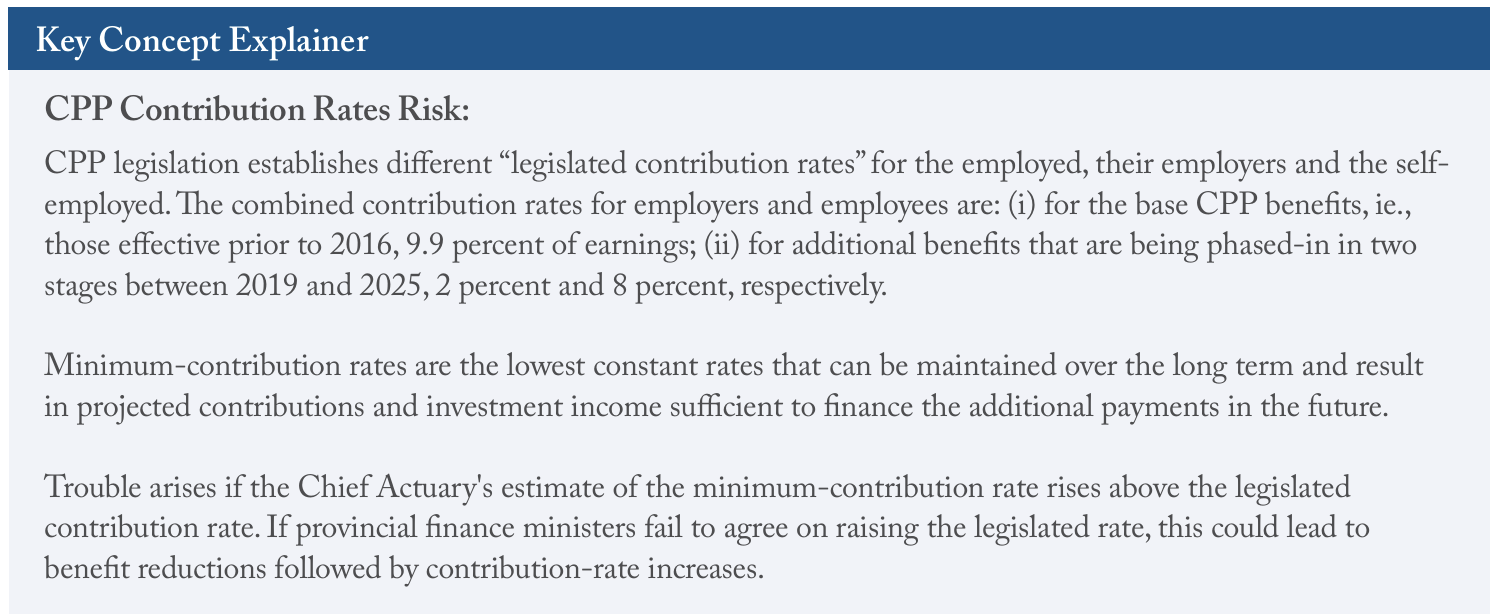
CPP legislation establishes different “legislated contribution rates” for the employed, their employers and the self-employed. The combined contribution rates for employers and employees are:
- Base benefits: 9.9 percent. (These are the benefits in place before the recent enhancement to CPP benefits.)
- First additional benefits: 2 percent. (These are the benefits that increase the retirement benefit rate from 25 percent to 33.3 percent on earnings up to the existing maximum contributory earnings.)99 CPP retirement benefits are calculated as a percentage of pre-retirement earnings. From the time of its establishment in 1966, the retirement benefit has been 25 percent of pre-retirement earnings. An additional benefit is now being phased in that will increase the retirement benefit rate to 33.3 percent.
- 3) Second additional benefits: 8 percent. (These are the benefits that result from raising the maximum level of contributory earnings by 14 percent and applying the 33.3 percent benefit rate to the new level of contributory earnings.)
Contributions related to the first additional benefits are being phased in from 2019 to 2023, and contributions for the second additional benefits will be introduced in 2024 and 2025.
These combined contribution rates are divided equally between employers and employees. The self-employed pay both the employee and employer shares.
In every actuarial valuation, the OCA establishes a minimum-contribution rate for each component of the CPP. For the base CPP benefits, the minimum-contribution rate includes the steady-state contribution rate, which is the lowest contribution rate that can cover the cost of benefits over the long-term future. If warranted, the minimum-contribution rate for the base benefits will also include payments to amortize the cost of benefit improvements that apply to service prior to the Plan’s amendment creating the improvements.
For the additional CPP benefits, the first and second additional minimum-contribution rates are the lowest constant rates that can be maintained over the long term and result in projected contributions and investment income sufficient to finance the additional payments. Again, if warranted, the additional minimum-contribution rates will also include payments to amortize the cost of past service benefit improvements.
If the OCA’s estimate of the minimumcontribution rate rises above the legislated contribution rate, finance ministers can agree on a higher legislated contribution rate or other measures to bring the minimum-contribution rate back in line with the legislated rate (based on the voting formula identified in footnote 1). But if the ministers fail to agree, a set of default measures that involve temporary benefit reductions comes into play for both components of the CPP.
It is important to note that the two components are assessed separately and that the default provisions differ between the Plan’s two components. In the case of the base benefits, indexation is eliminated, and a small contribution rate increase is imposed. These changes remain in place until a future valuation report shows the minimum rate to be less than the legislated rate.
In the case of additional benefits, the proposed default measures reflect their greater reliance on investment income. They also attempt to separate short-term disturbances from long-term change.
The proposed approach to adjusting additional benefits in a default situation establishes a range of departures from the legislated rates, both above and below them. In each case, there is a no-action zone, a warning zone and a take-action-now zone. The ranges for the first additional benefits are shown below. (Generally, contribution rates for the second additional benefits will be four times those for the first additional benefits). Following a phasing-in period when narrower ranges will be used, the ranges for the minimum-contribution rates starting in 2039 are:
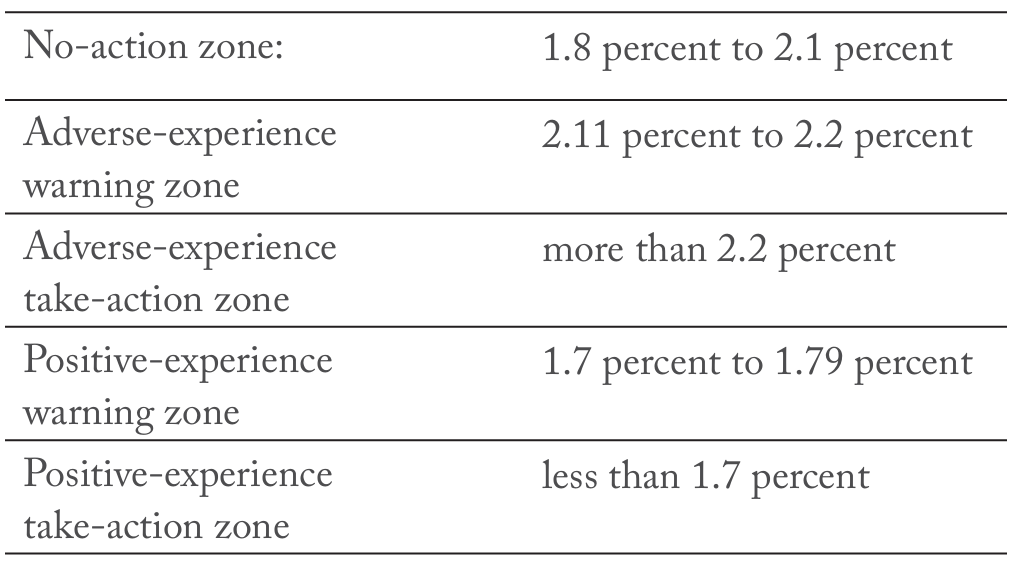
Two consecutive AVRs with additional minimumcontribution rates in the warning zone create a take-action situation.1010 The approach to defining risk is similar to what is now quite common in large Canadian workplace plans where it is more common to define risk ranges in terms of funding levels rather than contribution rates. This practice was started by the Ontario Teachers’ Pension Plan. A description of its funding management approach is provided in OTPP (2020).
Taking action in response to positive experience leads to benefit increases. Taking action in response to negative experience leads to benefit reductions followed by contribution-rate increases. Bearing in mind the small gap between the additional minimum-contribution rates and the legislated rates noted below, the consequences of adverse experience are of particular note.1111 For details, see the OCA’s Actuarial Study No. 20: Technical Paper on the Additional Canada Pension Plan Regulations.
As long as the minimum base-contribution rate stays below the legislated rate, the default rules do not come into play. The gap between the base CPP minimum-contribution rate and the legislated rate (assuming the minimum-contribution rate is lower) creates a cushion that protects against the application of the default provisions.
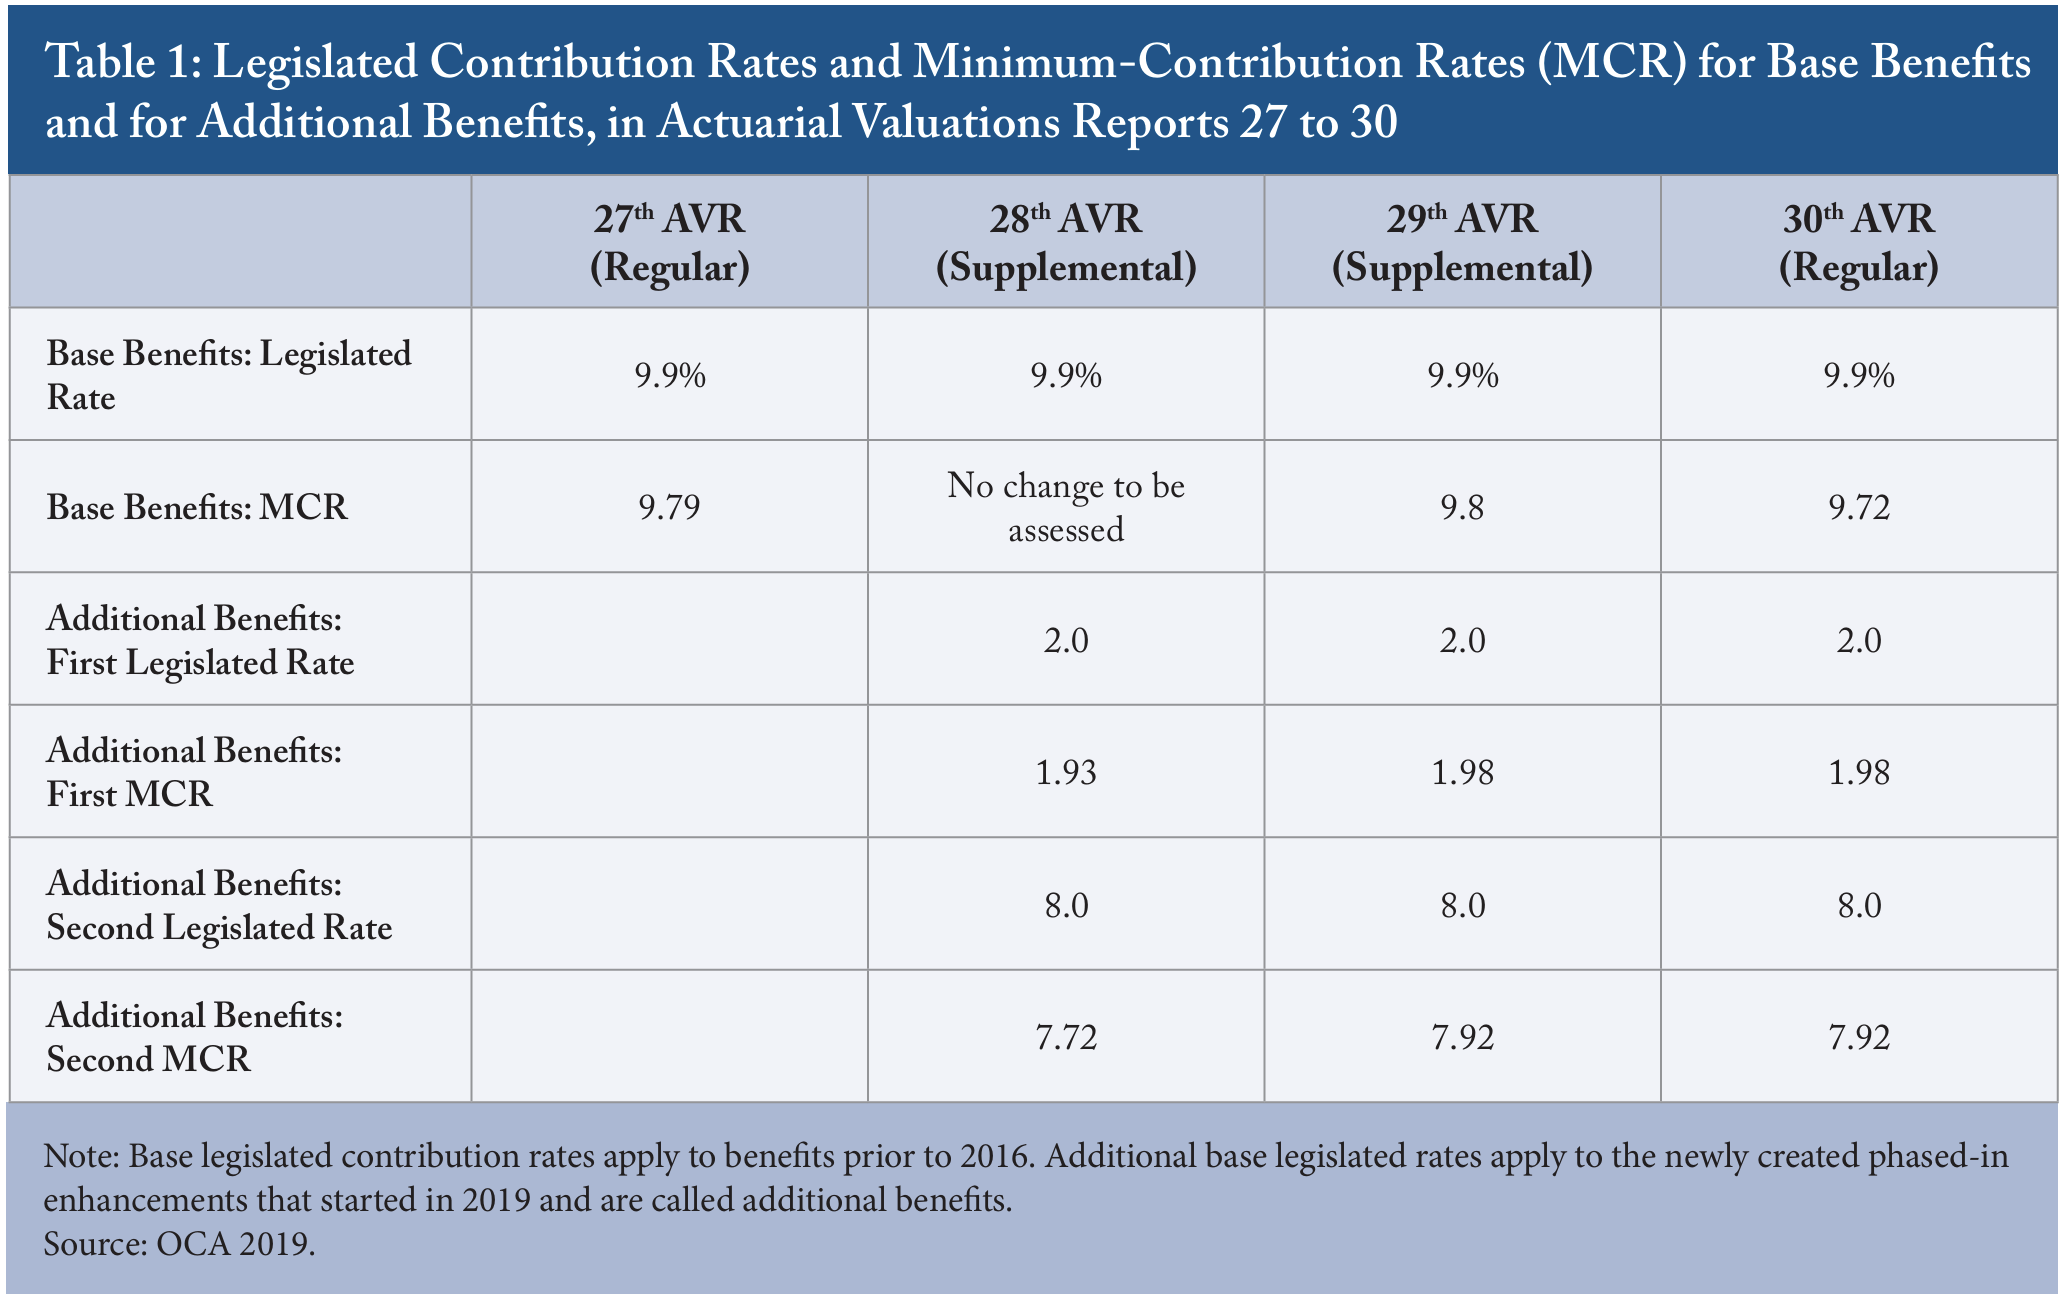
Table 1 above displays the relationship between the minimum-contribution rates and the legislated rates in the last several AVRs. The 27th and 30th reports are regular triennial reviews, while the 28th and 29th are supplemental reports.
In all cases, the gaps between the legislated and minimum-contribution rates are small. But there is a decrease in the gap for additional benefits between the 28th and 29th reports. The decrease is a result of controversy about CPP enhancements, as originally proposed and assessed in the 28thAVR. As originally proposed, the enhancements did not include equivalents to the child-rearing and disability dropouts that are part of the base benefits. (Within limits the dropout provisions protect the level of benefits from reductions due to low earnings while raising a child and/or being on CPP disability). As the controversy over these features was resolved, roughly equivalent provisions to the dropouts were included in the additional CPP benefits, and the narrow gaps between the legislated contribution rate and the minimum-contribution rates for the additional benefits got even narrower. No adjustment was made to the legislated contribution rate in light of the new provision.1212 Amendments to the additional benefits’ provisions were coupled with minor changes to the base benefits that resulted in a small increase in the minimum base-benefits contribution rate.
Is Negative Experience Likely?
An important question with respect to the relationship between the legislated and minimumcontribution rates is: how likely is it that the minimum-contribution rates will stay below the legislated rates? The 30th AVR provides several insights.
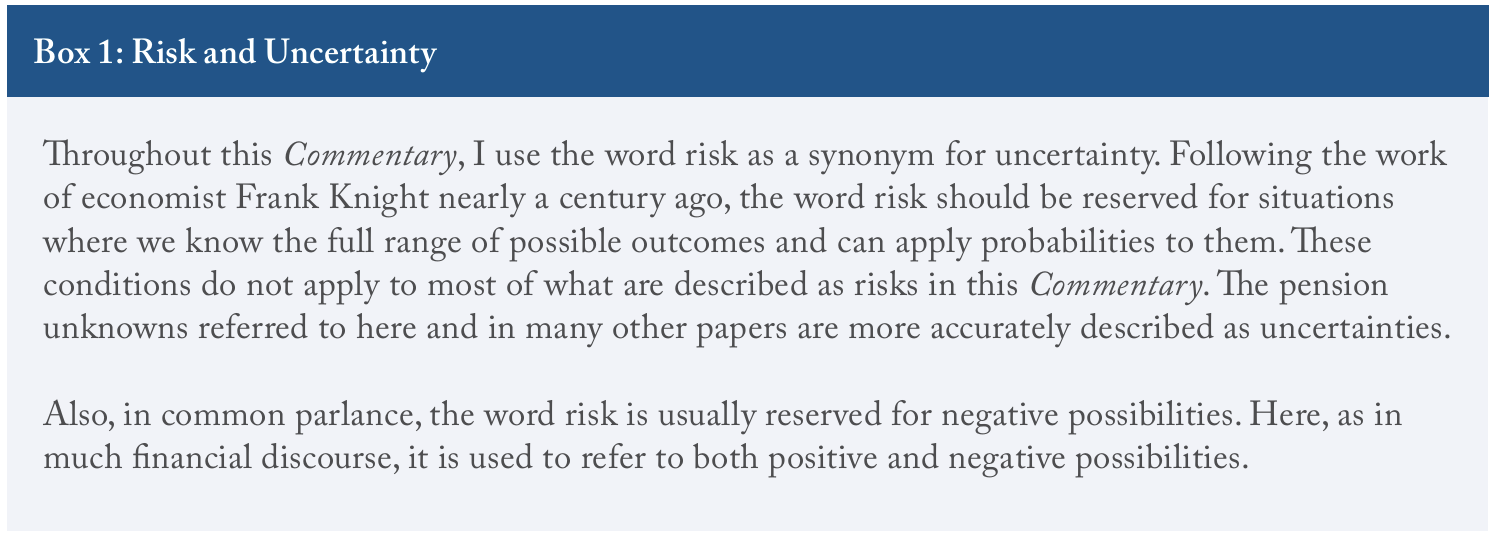
The Report illustrates the impact on the minimum-contribution rate of assumptions that differ from best-estimate assumptions. This form of testing is “sensitivity testing.” Indeed, the impact of the alternative assumptions also provides an indication of the impact of experience departing from best-estimate assumptions.
The sensitivity testing reported in the 30th AVR uses alternatives to best-estimate assumptions that attempt to capture the range of plausible experiences for each assumption. The assumptions and ranges reflect both the OCA’s internal deliberations and consultations with governmental and non-governmental experts.
For most assumptions, formal mathematical modelling is used to establish appropriate alternatives to the best-estimate assumptions. The technique used by the OCA is widely used and generates literally thousands of plausible outcomes as the values for each assumption are allowed to vary through projected time. The OCA uses the outcomes at the 10th and 90th percentiles of the modelling outcomes as a basis for choosing alternatives to best-estimate assumptions other than for fertility, mortality and wage growth. Baseline and alternative assumptions for fertility, mortality and wage growth are based on judgment and holding the assumptions constant through time.
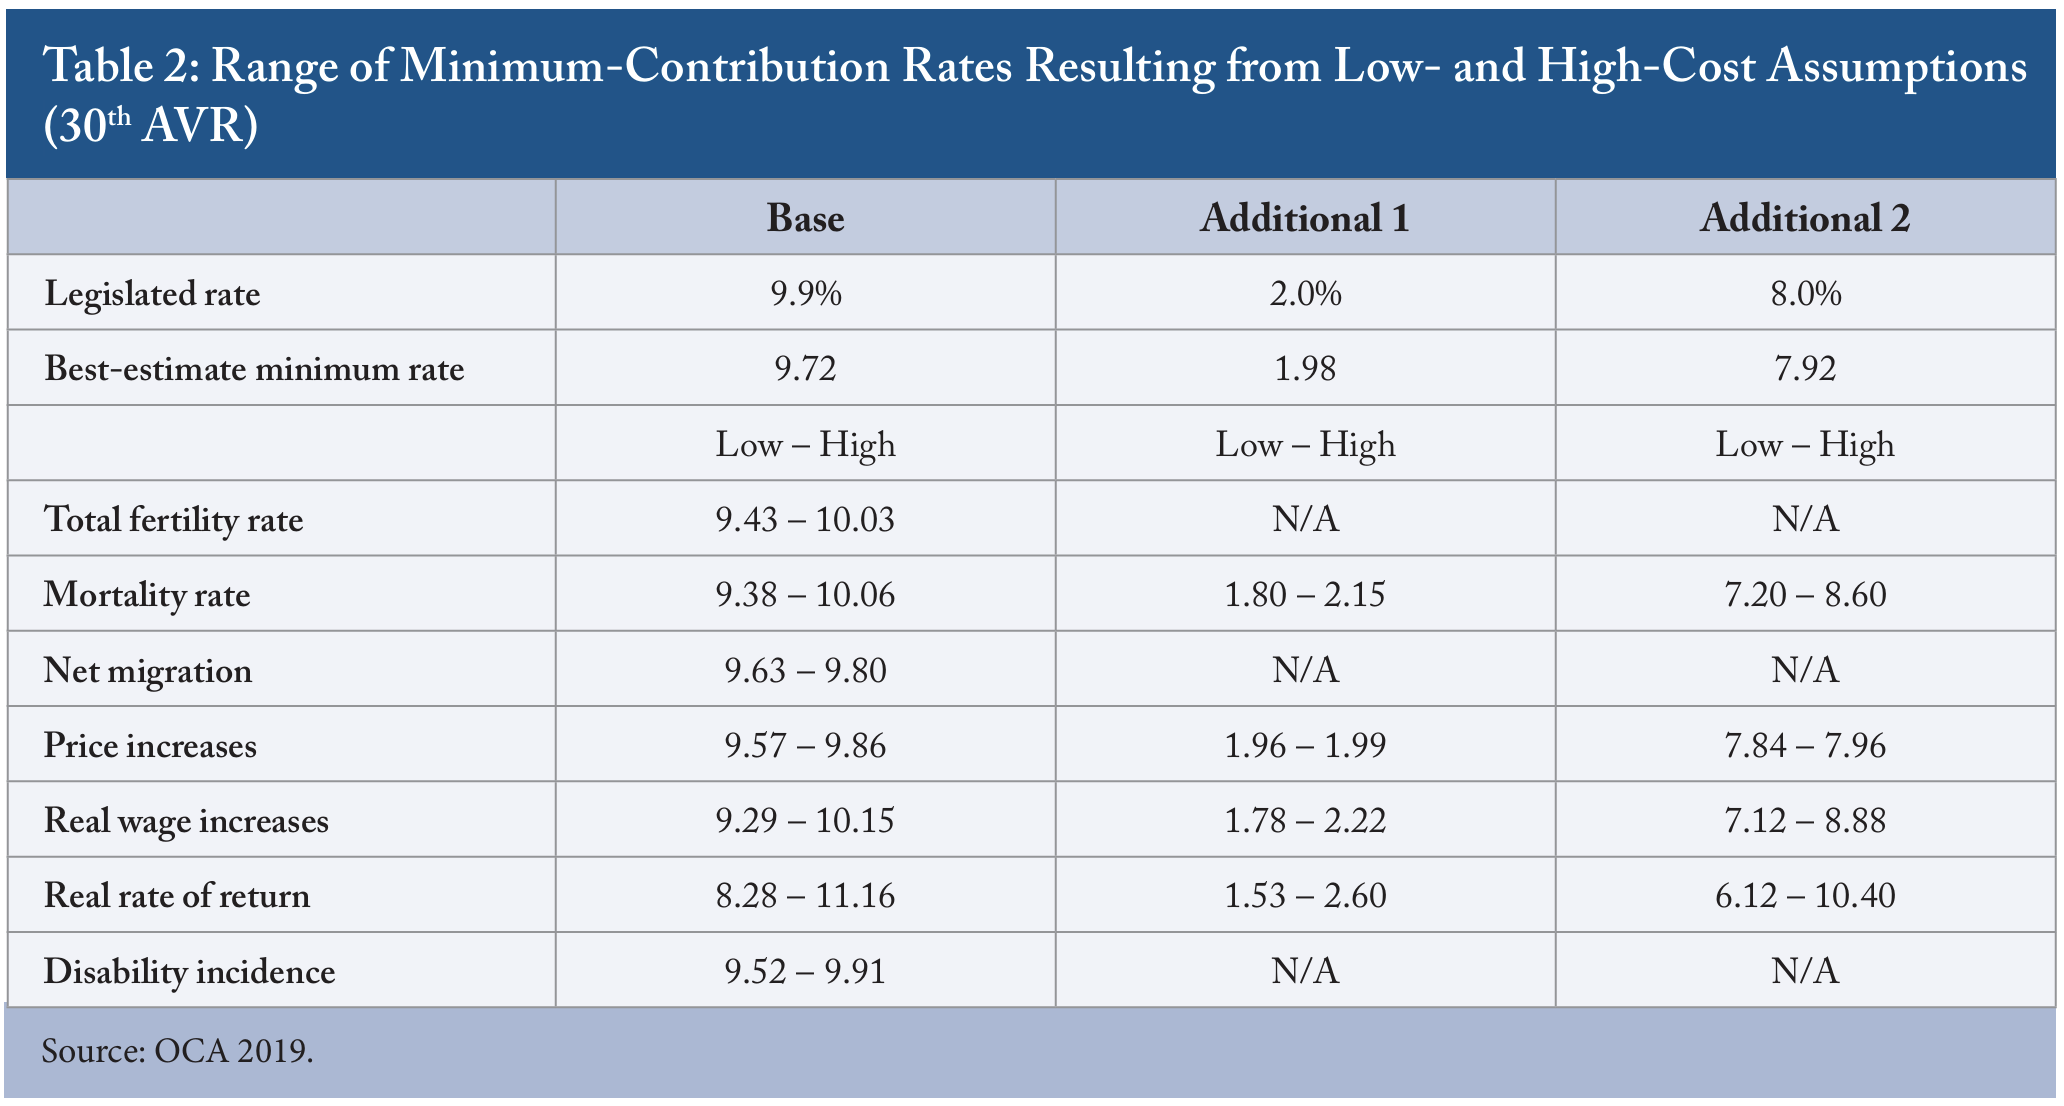
Departures from best-estimate assumptions are grouped based on whether they cause higher or lower minimum-contribution rates than the baseestimate assumptions. Separate tests are performed for base and additional benefits. The results are summarized in Table 2 below. Each cell indicates the range of minimum-contribution rates that result from the tests – entered from low cost to high cost.
For cells labelled N/A, the OCA has determined that changes in the assumptions do not have a material impact on the minimum-contribution rate.
There are two key things to note in Table 2:
- Most importantly, the high-cost projections almost all give rise to minimum-contribution rates above the legislated rates. In the basebenefit estimates, migration and price increases are the only exceptions. In the additional benefit estimates, price increases provide the only exception.
- In both the base and additional benefit estimates, the return on investment is the variable that produces the largest departure from the base-case, minimum-contribution rates. Proportionately, it produces bigger departures in the additional benefit estimates. This reflects the fact that additional benefits rely much more on investment returns. On the other hand, demographic and labour market variables are more important in the base-benefit estimates.
The 30th AVR also includes the results of tests that combine assumptions into variable economic growth and variable population age structures. The variable economic growth tests include changes in labour-market assumptions (e.g., participation rate, unemployment rate, age of benefit take up). The results of combining these variables are presented on their own and with variable wage growth.
In the base-benefit estimates, the labour market on its own produces minimum-contribution rates that vary from 9.16 (high growth) to 10.19 (low growth). When combined with variable wage growth, the range expands to from 8.8 to 10.67. The base-benefit estimate of minimum-contribution rates varies less with changes in population age structure. The population age includes varying fertility, mortality, net migration and labour-force participation rates, and the minimum-contribution rates vary from 9.3 (younger population) to 9.99 (older population).
For additional benefits, the range of minimumcontribution rates based on variable age range from 1.81 to 7.24 (younger population) to from 2.1 to 8.4 (older population). Proportionately, this is a somewhat wider departure from the best estimate than is true of the base-benefit estimates. If wage growth is ignored, there is little variation in the additional-benefit estimates based on economic growth. Minimum-contribution rates cover the range from 1.95 to 7.80 to from 1.99 to 7.96. This is the only case where the higher cost estimate remains below the legislated rate.
Things look different when variable wage growth is introduced. The additional-benefit estimate minimum-contribution rate with low-wage growth ranges from 1.8 to 7.2 and from 2.21 to 8.84 for high-wage growth. The high-wage growth assumption pushes the minimum-contribution rate beyond the legislated contribution rate to the borderline of the action-required zone noted above.
Higher wage growth lowers the minimumcontribution rate for base benefits and does the opposite for additional benefits. Again, this reflects the different financing methods applied to the Plan’s two parts.
Two specific findings in the 30th AVR merit attention.
Between the 27th and 30th AVRs, the real wagegrowth assumption was lowered from 1.1 percent to 1 percent. Lowering the real-wage growth assumption by 0.1 percentage point increased the minimum-contribution rate for the base Plan by 0.11 percentage points. But it lowered the first and second additional minimum-contribution rates by 0.031 and 0.124 percentage points respectively. Despite the small size of these reductions in the additional minimum-contribution rates, they were large enough to drop the minimum-contribution rates below the legislated rates.
The other noteworthy finding relates to the probability of the minimum-contribution rate for the base plan equaling the legislated rate as a result of unfavourable investment returns. According to the 30th AVR, there is a 30 percent chance of the base plan’s minimum-contribution rate reaching the legislated rate in the 31st report if the cumulative investment returns are 10 percentage points lower than the best-estimate assumption over the 2019-2021 period.
In the 2031 to 2033 valuation period, the probability of shortfall increases to 36 percent, assuming that cumulative returns over the threeyear period fall 6.4 percentage points below best estimate levels.1313 The estimates of the minimum-contribution rate rising above the legislated rate in the periods covered by specific valuation reports assume that rates of return equal best-estimate assumptions up to the start of the test periods. This likely limits the probability of the minimum-contribution rate reaching the legislated rate. (As noted in the 30th AVR, the probability of the additional minimum-contribution rate being driven above the legislative rate over the coming 20 years due to poor investment returns is very low. This is because the additional benefits are still in an immature state and contributions dominate investment returns as a source of revenue).
To this point, I have focused on changes in actuarial assumptions that could push the minimum-contribution rates above the legislated rates. It is equally true, of course, that changes in actuarial assumptions could have the opposite effect. The change in the assumption with respect to real-wage growth provides a case in point. In this respect, two other findings from the 30th AVR are worth noting.
First, the experience of the Plan with respect to investment performance was much stronger than the OCA’s best-estimate assumption over the threeyear period ending December 31, 2018. On its own, this allowed the OCA to reduce the base Plan’s minimum-contribution rates by 0.163 percentage points. The impact of investment performance on the minimum-contribution rate was much stronger than the impact of any other change in assumptions or experience.
Second, having experience that is more favourable than the best estimates of the minimumcontribution rate is to be welcomed. Nonetheless, it may create a political management issue. The gap between the minimum-contribution rate and the legislated rate provides a buffer that protects the Plan against adverse experience. But if the minimum-contribution rate drops below the legislated rate for a prolonged period of time, it may well provoke a lively – and appropriate – debate about whether some portion of the buffer should be translated into benefit increases or contribution-rate reductions.
Section 4: Managing CPP Finances: Experience Differing from Assumptions, Changes in Benefits and Assumptions
Here, I discuss three factors related to managing CPP finances:
- Has the Plan’s overall experience and the investment returns had a positive or negative impact on the minimum-contribution rate?
- How have benefit changes affected minimumcontribution rates? and
- How have changes to assumptions and analytical methods impacted the minimum-contribution rates?
Two further aspects of this section should be noted:
- I focus exclusively on base benefits since the additional benefits have been in place for too short a time to support a meaningful discussion of experience versus assumptions; and
- The impact of assumptions and changes to them are dealt with in the aggregate. Individual assumptions will be discussed in Section 5.
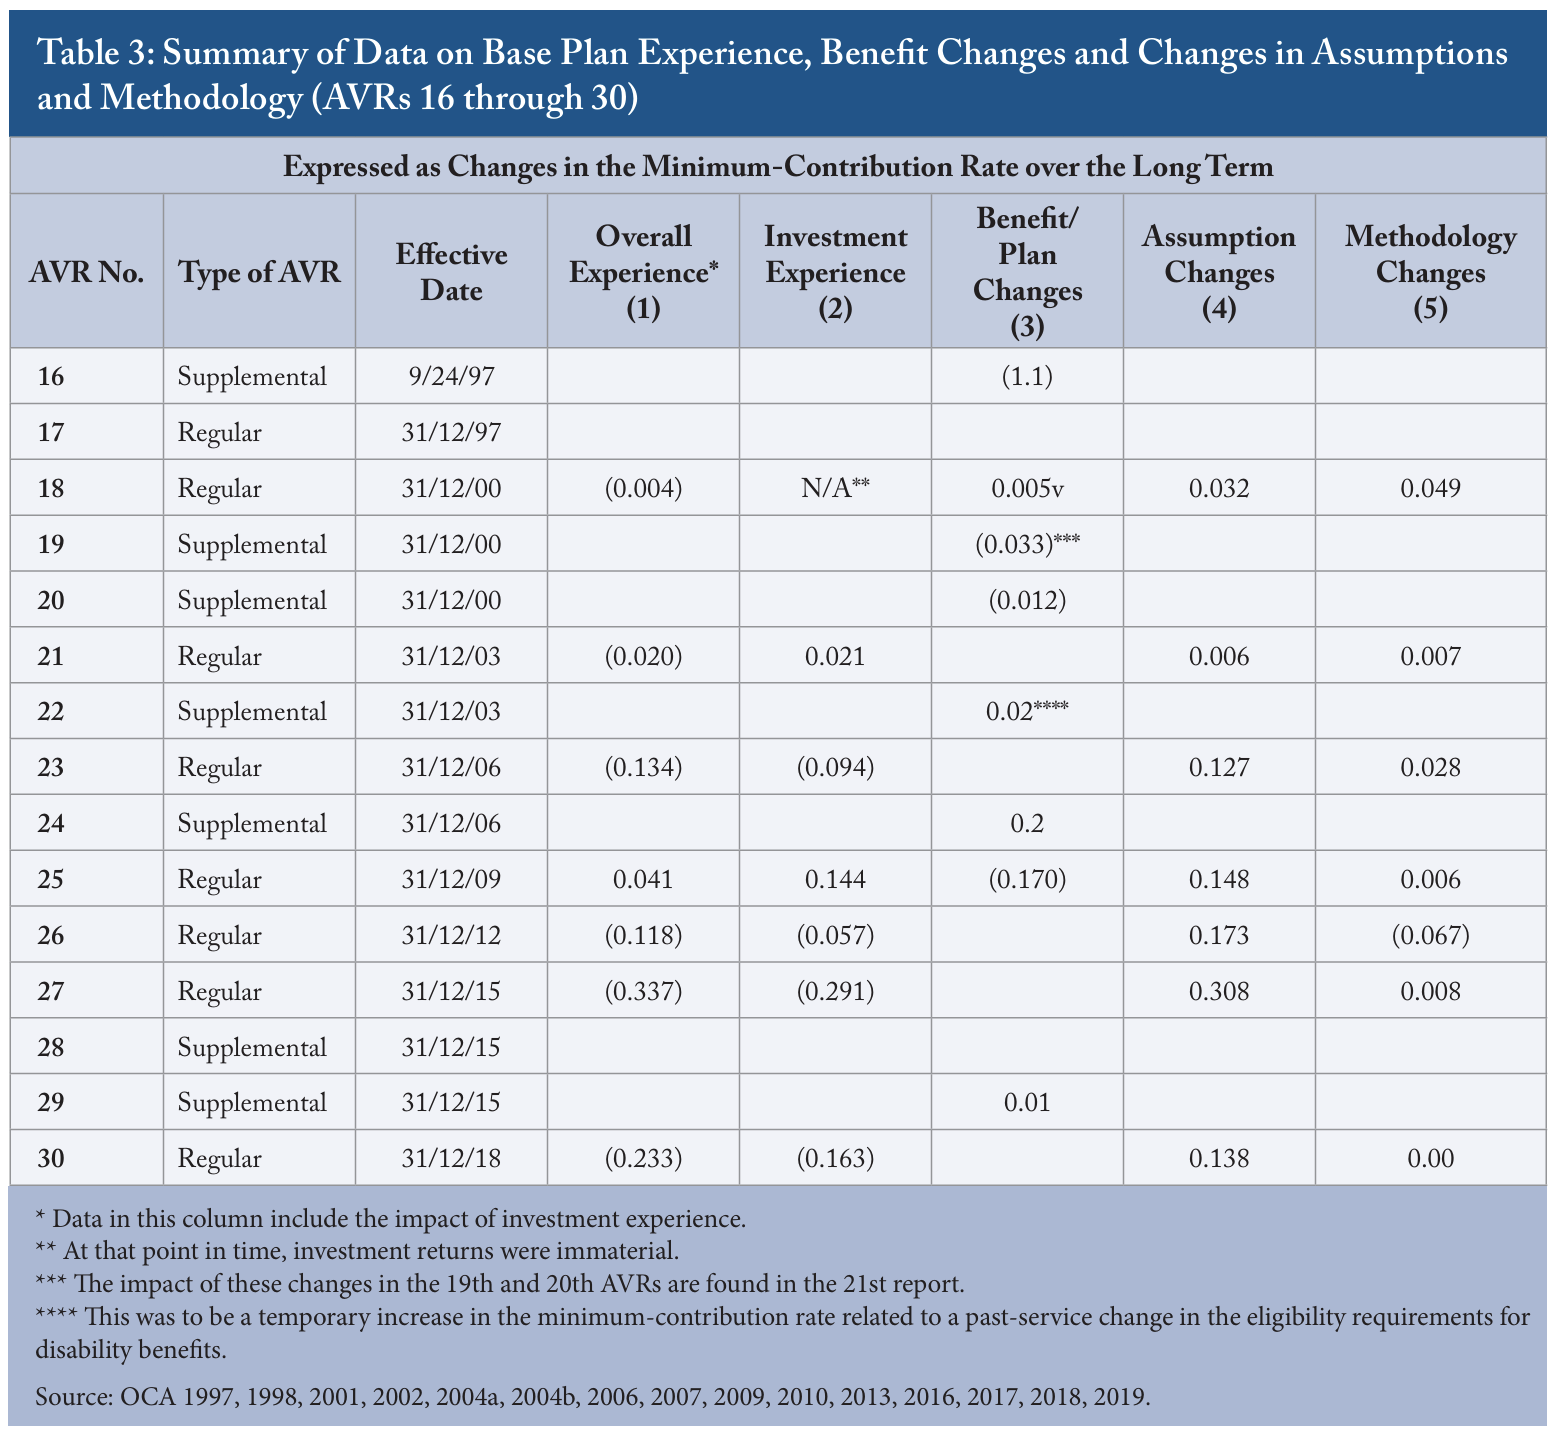
Data relevant to all three parts of this section are found in Table 3. The data focus on the period since 1997 when the main features of the current financing arrangements for base benefits were established. The table includes data from both regular and supplemental valuation reports. Recall that the minimum base-contribution rate includes the steady-state rate plus costs associated with newly created benefits. The steady-state rate and the minimum-contribution rate were identical up to 2003, and the steady-state contribution rate still represents all but a tiny portion of the minimum rate – 99 percent in the 30th AVR.
Unfortunately, fully comparable numbers are available only for the period since 2000. As a result, there are gaps in the 1997 data. Also, negative numbers are presented in brackets and reflect reductions in the minimum-contribution rate, which indicates the positive impact of experience.
Experience and Assumptions (Columns 1 and 2 in Table 3)
In the seven cases where we can observe the impact of overall experience on the minimumcontribution rate, there are six in which the rate has been reduced by experience. Bearing in mind the small gap between the minimum and legislated contribution rates, the last two overall experience gains at the level of two-tenths and three-tenths of a percentage point are not trivial.
Table 3 also shows the six actuarial valuations that identify the impact of investment experience on the minimum-contribution rate. In four of the six cases, investment experience has had a positive impact on the rate. In three cases (the 23rd, 27th and 30th), positive investment experience accounts for a large portion of the total gain in the minimum-contribution rate. In the two cases where investment experience was adverse, it offset positive experience in other areas.
Benefit and Plan Changes (Column 3 in Table 3)
With minor exceptions, the impacts noted under this heading relate to benefit changes. Administrative changes have made only a very small contribution to the data in Column 3.
As can be seen however, impacts on the minimum-contribution rate tend to be small regardless of whether they are positive or negative. (This generalization does not apply to the recent introduction of additional benefits). The only change that has an impact of more than one percentage point is the package of benefit reductions introduced in 1997.1414 The benefit reductions were part of a larger package that included the introduction of the steady-state financing regime, the creation of the CPPIB and the broadening of the contributory earnings base by freezing the nominal amount of the Year’s Basic Exemption.
Changes in Assumptions and Analytical Methods (Columns 4 and 5 in Table 3)
With regard to changes in assumptions and analytical methods, it is striking that all but one of the adjustments increase the minimumcontribution rates. Since 2006, we see that:
- The impact of changes in assumptions has outweighed changes in analytical methods in terms of their impact on the minimumcontribution rate; and
- There has been a tendency for experience gains to push the minimum-contribution rates down and for assumption adjustments to push them up.
Section 5: Individual Assumptions
Here, I provide a brief overview of the assumptions used in the 30th and earlier AVRs and then offer a brief commentary on two factors of particular interest: wage growth and returns on investment. These assumptions have a significant impact on the CPP’s financial position, and they are cases where the future is difficult to predict.
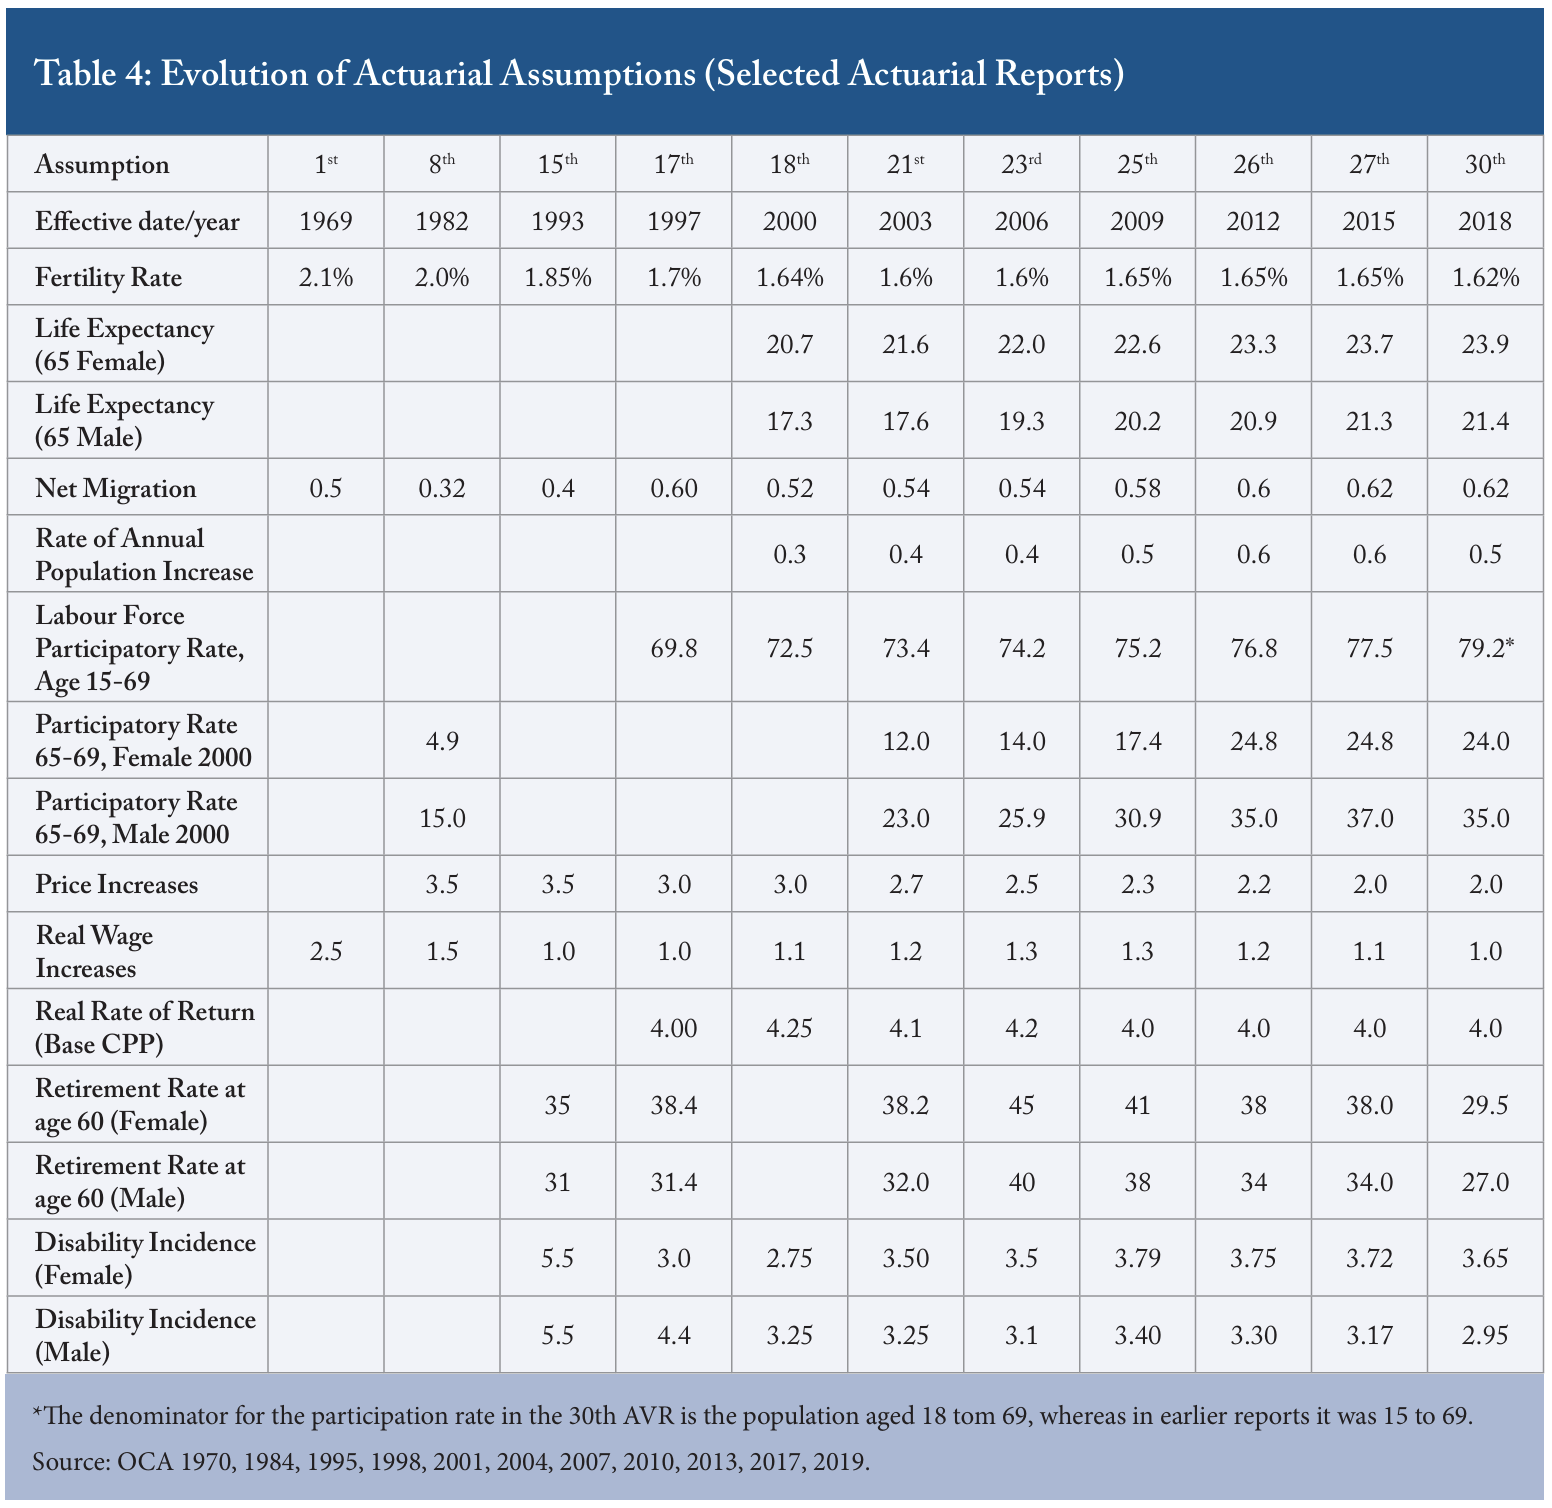
In Table 4 below, most assumptions and their evolution are documented. The summary is quite complete for the period starting in 2003 since the presentation of AVR assumptions has been consistent since then. Assumptions from earlier reports are less complete.
Many assumptions in the 30th and earlier AVRs are presented as evolving to a long-term estimate. In general, I present their long-term assumptions. However, the life-expectancy projections provide an exception to this rule. The assumption for life expectancy is for the year following the effective date of the valuation (e.g., life expectancy in the 30th AVR is for 2019).
Demographic and labour-market assumptions are for Canada minus Quebec.
Generally, I do not judge the assumptions. Questions may be posed about some of them, but none are badly at odds with informed views.
In reviewing these data, two general thoughts are worth bearing in mind. First, changing the assumptions will also change the odds of experiencing gains and losses in the future. If the assumptions are changed to reduce the minimumcontribution rate, the odds of experience losses in the future go up, and vice versa. (The potential importance of negative experience was discussed in Section 3.)
Second, in managing a pension plan – including the CPP – when experience departs from future assumptions, plan governors have to decide whether they are dealing with a short-term deviation that will give rise to reversion to the mean or a long-term secular shift that warrants a change in assumptions. In looking at the data in Table 4, examples of experience departing from best estimates and prompting changes in assumptions are evident in the cases of fertility, life expectancy and wage growth, and in some changes in genderbased differentials.1515 The appropriateness of assumptions would be clearer if actuarial gains and losses were reported over a longer time frame than found in the current and the immediately previous valuation reports. A longer time frame would cast light on the persistence of departures from the best-estimate assumptions.
Two aspects of this data merit comment before turning to wage growth and investment returns:
- Increasing labour-force participation at older ages provides a basis for holding assumed overall labour-force participation constant in spite of population aging; 1616 Hicks (2019) argues that the OCA underestimates employment growth at older ages. and
- It is worth trying to understand whether the decline in the rate at which retirement benefits are claimed at age 60 reflects recent changes in CPP incentives for early and late retirement, or unrelated behavioural changes.
Real Wage Increases
The wage-growth assumption has declined by one-tenth of a percentage point in each of the last several AVRs going back to December 31, 2009. The assumption has dropped from 1.3 percent per year to 1 percent.
Over this time frame (2009 – 2018), the wage growth assumption has been constructed as a composite of five variables.1717 The variables are: labour productivity, labour compensation as a portion of national income growth, wage growth as a portion of compensation, hours worked and CPI growth compared to the national-income deflator. The variable that explains the declining wage-growth assumption is a declining estimate of productivity growth from 1.5 percent per year in 2009 to 1 percent per year in 2018.
As noted in Section 3, the average wage-growth assumption was dropped to 1 percent per year in the 30th AVR compared to an assumption of 1.1 percent in the 27th report. This small change had significant consequences.
Table 4 provides a more complete history of wage-growth assumptions. The real wage-growth assumption in the first valuation report (1969) was 2.5 percent per year. Real wage growth at this level is not part of recent experience.
The link between the wage-growth assumption and a slower labour-population and labour-force growth is not clear. At the start of the current century, the supporting commentary on wagegrowth and related labour-market assumptions placed a great deal of emphasis on future labour shortages. (Normally supply shortages would lead to price and wage increases.)
Rate of Return
The assumed rate of return on assets backing CPP commitments is the most significant assumption in terms of its impact on required contributions and the CPP balance sheet.
The CPPIB develops separate assumptions for base and additional benefits, reflecting the different asset allocations for the Plan’s two parts. The asset allocation for base benefits has a higher risk component than does that for additional benefits. The relatively higher risk accepted in the base plan counterbalances the relatively heavier weight of more stable but lower returning contributions in financing the base plan.1818 The pay-go component of base-benefit financing is treated, in effect, like a bond with a variable rate of return equal to the growth in contributory earnings.
In the 30th AVR, the expected real annual returns, net of expenses, over the long term are assumed to be 4.01 percent for the base plan and 3.58 percent for the additional plan. The 30th AVR’s long-term rate of return assumption for base benefits is basically the same as in the 27th report, and the assumption for additional benefits is 0.08 percentage points lower. The assumed rates of return serve as discount rates for establishing the present value of future benefit payments.1919 The OCA’s assumed future returns lean to the high end of discount rates used by workplace pension plans registered with the Ontario Regulator (FSCO 2019) According to FSCO (2019), about 10 percent of Ontario’s defined-benefit workplace pension plans use nominal discount rates of 6 percent or more in going-concern valuations. In the case of the CPP base benefit, the higher discount rate might be justified by the asset allocation. The higher discount rate is harder to explain by the asset allocation for the additional benefits.
The stability in the real rate-of-return assumption reflects offsetting influences. In the early days of its operation, the CPPIB’s investment strategy had a 50/50 balance between equities and fixed-income securities. In recent years, the balance has changed to 85/15 for the base plan. This 85/15 balance is likely to change to 70/30 as the base plan matures and some of the investment income will have to be used to pay benefits. Compared to earlier years, the shift to a higher weight given to equities would, on its own, lead to a higher rate of return. This possible outcome is offset by a lower real rateof-return assumption with respect to equities. In a similar vein, the impact of the shift from an 85/15 to a 70/30 portfolio is offset by an assumed higher yield on future fixed-income securities.
The 21st AVR (2003) is the first to provide assumed real rates of return by asset class. Its assumptions for different asset classes are: Canadian equities, 4.6 percent; US and foreign equities, 5 percent and marketable bonds, 3.4 percent. The most comparable assumptions in the 30th AVR are public equities, 4.3 percent and marketable bonds, 2.2 percent.2020 The 30th AVR (pp. 189-194) provides a good illustration of how changes in the asset allocation affect risk and return in the portfolio backing the base benefits.
Section 6: Conclusion
The 30th and earlier CPP valuation reports provide readers with an appropriate reassurance that if the best-estimate assumptions are reflected in future experience, the CPP will be financially viable for decades into the future. At the same time, the AVRs provide ample warning that the future may unfold differently than best-estimate assumptions suggest, while the consequences of positive and negative departures from best estimates are noted. The valuation reports are to be commended not only for their technical merits but also for explaining complex realities with clarity.
Still, despite their high quality, there are features of the reports that could be strengthened.
It was noted in Section 3 that the OCA has tested the combined impacts of assumption groups varying in high- and low-cost ways. This type of analysis is important but should be extended beyond measures based on projections of past realities to include testing of differing scenarios as well as stress testing. The need for this type of analysis would exist in any historical period. But the backdrop of COVID-19 and climate change with their economic impacts makes this type of analysis more pressing now.2121 The limitations of mathematical modelling that relies on projecting historical realities are discussed in Kay and King (2020). Ambachtsheer’s April 2020 letter also addresses this issue.
The use of stochastic (random variable) modelling to establish alternatives to best-estimate assumptions as the OCA has done with respect to most assumptions gives report users a sense of the likelihood that the alternatives will emerge. An effort should be made to apply this modelling approach to all assumptions.2222 Some of the early peer reviews of the OCAs work on CPP valuation reports (first peer review was a review of the 17th AVR dated 1999) called for more extensive use of stochastic modelling. More recent reviews have endorsed the use of stochastic modelling without calling for its increased use. One calls for an explanation of the limitations of stochastic modelling). (In saying this, I recognize that the distinction between risk and uncertainty is not clear, which is why the previous paragraph is important).
The OCA’s work is framed by the policy decisions of finance ministers.2323 The finance ministers’ policy preferences frame the OCA’s work (e.g., the preference of the ministers for stable contribution rates) but they are open for debate in the wider political arena. Debates are active on issues such as: the adequacy of CPP benefits, the eligibility age for CPP retirement benefits, the distributional impact of CPP benefits and the rate at which benefits are being phased in. The responsibilities of the OCA and finance ministers overlap, and I raise issues here that are in the exclusive domain of ministers and/or the overlapping domain.
It was noted in Section 2 that the gap between the legislated and minimum-contribution rates is very small – especially with respect to additional benefits. The slow phasing in of additional benefits and the reliance on contributions as the dominant source of revenue in the near future provides some time to address the need for a small increase in the legislated rate.
The valuation reports reviewed above imply the need for regular CPP adjustments as does the actual history of the Plan. The legislation that governs the CPP is highly detailed, and the need to change the detail through legislation can limit the ability to adapt quickly. The legislation should be reviewed to determine what aspects could be moved safely to regulations while maintaining the Plan’s joint federal-provincial character.
Canada’s retirement-income system has a number of component parts that interact with each other – sometimes in ways that are complementary and sometimes not.2424 Examples of interactions that limit the effectiveness of CPP enhancements for low earners largely because of the Plan’s interaction with the GIS are found in Milligan and Schirle (2016) and Baldwin and Shillington (2016). They are also subject to a variety of demographic, labour-market, financial and economic influences. Despite this reality, the OCA’s valuation reports focus on specific components of the retirement income system (e.g., the CPP). That, to be clear, is what is called for in legislation. But there is a need to understand what happens to the whole system in the face of varying circumstances. 2525 The need for a holistic approach is discussed in Baldwin (2019) and in Ambachtsheer and Nicin (2020).
A simple example may illustrate the desirability of a comprehensive approach. In Section 3, we saw the impact of varying economic-growth projections on the base CPP, reflecting its largely pay-go financing. Old Age Security (OAS) and the Guaranteed Income Supplement (GIS) are financed on a pure pay-go basis and the combined impact of varying economic growth on all of OAS/ GIS and the CPP is worth assessing as is a serious reflection on the appropriate policy response to the findings of a holistic analysis.
The main public components of Canada’s retirement income system (OAS, GIS and the CPP) have been reformed in recent years. Further reforms in the near future are unlikely. Nonetheless, there are two areas where helpful activity could be undertaken. One is in strengthening the data and analytical capacity needed to assess the system.2626 The need for work in this area is discussed in Expert Panel on Income Security (2017). Two recent positive developments are the commitment to undertake the Survey of Financial Security (a wealth survey) on a regular basis and Employment and Social Development Canada’s promise to build a longitudinal micro-simulation model to analyze retirement-income issues. The other is to review the regulatory and tax law relating to workplace pension plans that are an important complement to the CPP. This review needs to make sure these legal areas don’t inhibit the changes to workplace pension-plan designs that are emerging in response to the maturing of plans and difficult financial circumstances of the early 21st century.2727 The C.D. Howe Pension Policy Council has overseen the development of a number of papers on these issues. Recent ones include Robson (2017) on tax rules and Gros (2020) on the regulatory regime.
Meanwhile, the sustainability of the entire retirement-income system depends on managerial technical competence and a sense among stakeholders that the plans are fair and provide reasonable incomes at a reasonable cost. Through most of this Commentary, I have addressed management competence issues. But I have deepseated concerns that the risks involved in managing the CPP are poorly understood. If unanticipated negative risks materialize, the Plan will be subject to significant political as well as economic risks. A significant outreach effort is needed to enhance public understanding of our retirementincome system. This means more than putting information on a website. Direct engagement with stakeholder groups is required. The OCA can make an important contribution to this process. But adequate engagement clearly requires political leadership. Engagement on the CPP is needed but so is engagement on the retirement-income system as a whole.2828 Since the CPP’s establishment, there have been three major revisions to the CPP and Canada’s overall retirement income system. Regrettably, as we have moved from one round of reform to the next the federal government’s intellectual leadership role has declined, as has the amount of analytical work by all levels of government that finds its way into the public domain.
References
Ambachtsheer, Keith. 2020. “Making Good Decisions in a Radically Uncertain World: The Case of Covid-19.” Ambachtsheer Letter. Toronto: KPA Associates. April.
Ambachtsheer, Keith, and Michael Nicin. 2020. “Improving Canada’s Retirement Income System: A Discussion Paper on Setting Priorities.” Toronto: National Institute on Aging.
Baldwin, Bob. 2019. Canada’s Retirement Income System: A Reform Agenda. Ottawa: Ottawa Council on Aging.
Baldwin, Bob, and Richard Shillington. 2017. Unfinished Business: Pension Reform in Canada. Montreal: Institute for Research on Public Policy.
Expert Panel on Income Security. 2017. Upgrading Social Policy Research and Advice: Modernizing our Data Tools, and Practices to Meet Evolving and New Challenges. Ottawa: Ottawa Council on Aging.
Financial Services Commission of Ontario (FSCO). 2019. 2018 Report on the Funding of Defined Benefit Pension Plans in Ontario. Toronto: FSCO.
Gros, Barry. 2020. “Pension Rules Stifle Innovation for Target Benefit Plans.” E-Brief. Toronto: CD Howe Institute. June.
Hicks, Peter. 2019. Retirement Income Policy: Reform Pressures over the Coming Decade. Ottawa: Ottawa Council on Aging.
Kay, John, and Mervyn King. 2020. Radical Uncertainty: Decision-Making Beyond the Numbers. London: W.W. Norton Company Ltd.
Milligan, Kevin, and Tammy Schirle. 2016. The Pressing Question: Does CPP Expansion Help Low Earners? E-Brief. Toronto: CD Howe Institute. July.
Office of the Chief Actuary. 2019. Actuarial Report on the Canada Pension Plan. Ottawa: Office of the Superintendent of Financial Institutions. Also cited actuarial reports numbers 1.8, 15, 16, 17, 18, 19, 20, 21, 22, 23, 24, 25, 26, 27, 28, 29.
_____________. 2017. Review of the 27th Actuarial Report on the Canada Pension Plan. Ottawa: Office of the Superintendent of Financial Institutions.
_____________. 2008. Review of the 23rd Actuarial Report on the Canada Pension Plan. Ottawa: Office of the Superintendent of Financial Institutions. Also referred to were peer reviews of the 17th, 25th and 26th AVRs.[ditto].
_____________. 2010. Technical Aspects of the Financing of the Canada Pension Plan: Actuarial Study Number 8. Ottawa: Office of the Superintendent of Financial Institutions.
_____________. 2019. Technical Paper on the Additional Canada Pension Plan Regulations: Actuarial Study Number 20. Ottawa: Office of the Superintendent of Financial Institutions.
Ontario Teachers’ Pension Plans (OTPP). 2020. 2019 Annual Report. Toronto: OTPP.
Retraite Québec. 2019. Actuarial Report: Supplementing the Actuarial Valuation of the Quebec Pension Plan as at 31 December 2015. Quebec City: Retraite Québec.
Robson, Bill. 2017. Rethinking Limits on Tax-Deferred Retirement Saving in Canada. Commentary 495. Toronto: CD Howe Institute. November.
Robson, Bill, and Alex Laurin, 2017. “Bigger CPP: Bigger Risks: What ‘Fully Funded’ Expansion Means and Doesn’t Mean.” E-Brief. Toronto: CD Howe Institute. April.