


 This E-Brief is the third in a series related to the Bank of Canada’s 2026 renewal of its inflation-targeting agreement with the federal government.
- We examine the desirable properties of underlying inflation measures and assess whether the measures available to the Bank meet those criteria.
- We find that the Bank’s current measures provide useful information about underlying inflation, but the Bank should continue exploring improved measures to help guide its policy decisions.
- However, the measures that help policymakers assess underlying inflation are not necessarily the best tools for communicating monetary policy to the public. The Bank should place greater emphasis on its inflation forecast and policy path when explaining its decisions.
 This E-Brief is the third in a series related to the Bank of Canada’s 2026 renewal of its inflation-targeting agreement with the federal government.
Introduction
The Bank of Canada and the Government of Canada renew their agreement concerning the monetary policy framework every five years. They will announce the next renewal toward the end of 2026. Up to now, the Bank has not engaged in a broad discussion about its 2 percent inflation target. It has also not raised concerns about the primary objective of its monetary policy: to stabilize “headline inflation,” defined as the year-over-year change in the Consumer Price Index (CPI).
The Bank has, however, expressed a desire to find better measures of underlying inflation that could guide its monetary policy decisions and, at the same time, aid its communication with the public about them. As former Deputy Governor Rhys Mendes, who retired in April 2026, notes (Mendes 2025):
Interest rate changes work with lags. This means we cannot – and should not – try to react to every wiggle in the monthly inflation numbers. To achieve our 2-percent target, we have to cut through the noise and identify the part of inflation that is lasting. This lasting, or persistent, part of inflation is what we call ‘underlying inflation.’ It’s our signal.
In this E-Brief, we use a question-and-answer format to address concerns related to measuring underlying inflation and propose changes to the Bank’s communication strategy.11 This E-Brief is the third in a series examining issues related to the Bank of Canada’s 2026 renewal of its inflation-targeting agreement with the federal government (Ambler, Koeppl, and Kronick 2025a, 2025b are the first two papers). We argue that the Bank should continue to seek improved measures of underlying inflation for internal use, but make forecasts of future headline inflation, and policy-rate decisions consistent with that path, a key component of its communications. To do so, we take as given that the forthcoming agreement will renew the 2 percent inflation target and that the Bank’s formal objective remains to stabilize headline inflation.
Q: What conundrum does the Bank of Canada face with underlying inflation?
A: Measures that help the Bank assess underlying inflation and guide monetary policy are not necessarily effective tools for communicating its policy stance to the public.
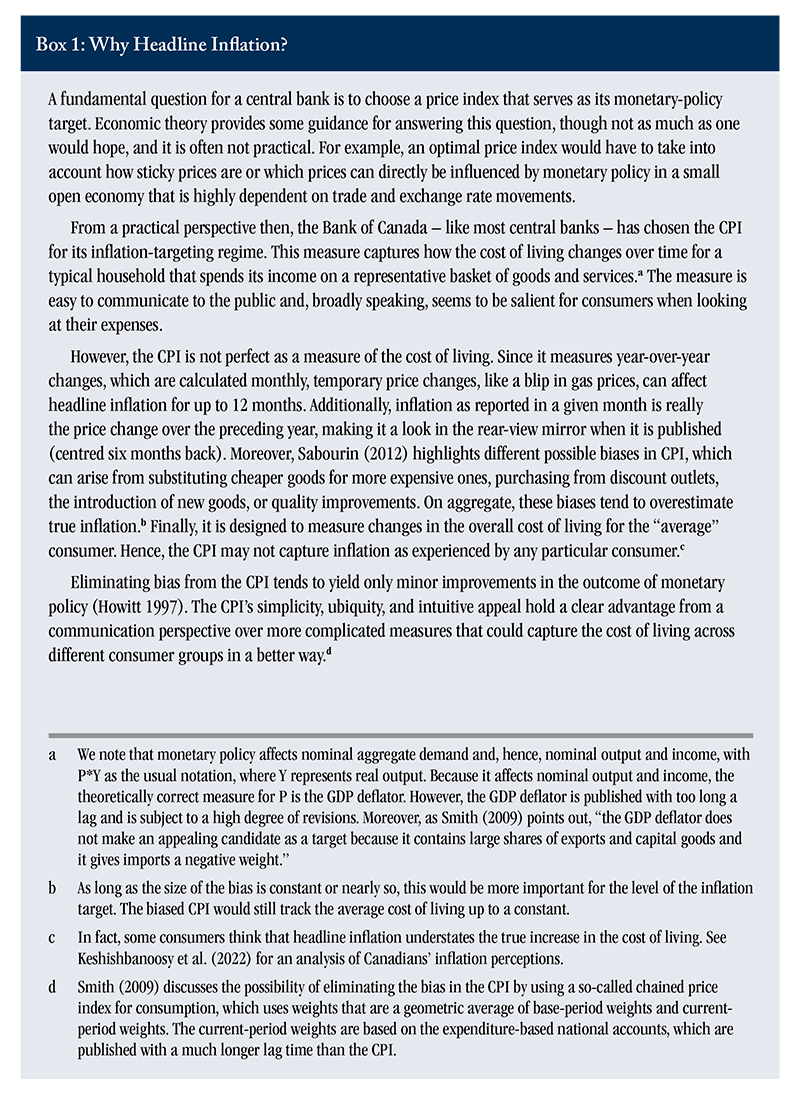
Headline inflation is relatively easy for Canadians to understand. Statistics Canada publishes monthly data on headline inflation as measured by the CPI and its components. The mainstream media closely tracks these data releases and reports on them. And the general public understands its meaning fairly well as a broad measure of realized inflation against which the success of the Bank’s policy is measured.
However, as an indicator variable or signal for monetary policy, headline inflation has serious shortcomings. It is affected by idiosyncratic and temporary shocks that are not related to longer-term movements in inflation. Hence, the Bank seeks to look through short-term movements to extract information relevant to its monetary policy stance that will influence inflation with a lag that is commonly perceived to be six-to-eight quarters. To do so, it develops indicators – often labelled as other price indices – that provide information about underlying inflation.
Any good measure of underlying inflation depends on more or less complex statistical tools, which are hard for non-experts to understand. Because these tools can depend on historical data, they can also be subject to revisions as more data become available. This was a significant factor, as we recently saw in the case of CPI-common, a specialized core inflation metric that measures common, overarching price movements across various CPI categories (Macklem 2022). Hence, the definitions of such indices, their importance for policy decisions, and their revisions can be confusing for the public. Furthermore, when the Bank uses these measures to communicate its stance, it might give the impression that it targets these measures themselves rather than headline inflation. As Mendes (2025) noted: “We’ve long labelled one or more measures of core inflation as our ‘preferred’ measures...At times, this language may have led markets to place more emphasis on the preferred core measures than we do.”
The Bank’s communication about its policy stance is crucial for steering inflation expectations and maintaining credibility with the public. Hence, the Bank seems to face a conundrum where good measures about inflation trends are not necessarily measures that are effective in communicating the Bank’s policy stance to the public.
Q: What measures of underlying inflation does the Bank currently use?
A: The Bank initially used a single-core inflation measure, but in 2016 switched to three distinct measures: CPI-median, CPI-trim, and CPI-common.
When the Bank adopted inflation targeting as its policy framework, its main approach to measuring underlying inflation was relatively simple. Its measure of core inflation (CPIX) excluded the historically most volatile CPI components – fruit, vegetables, gasoline, fuel oil, natural gas, mortgage interest, inter-city transportation, and tobacco products – as well as the effect of changes in indirect taxes on the remaining components. The rationale for this choice was that these price movements are likely to be transitory and, therefore, of little relevance to monetary policy actions that can take considerable time to affect inflation.
After its 2016 renewal of the 2 percent inflation target, the Bank switched to what it judged to be a more statistically robust set of indicators: CPI-trim, CPI-median, and CPI-common.22 The Bank of Canada evaluated different measures of core inflation in the run-up to the 2016 renewal of the monetary policy framework. It found that the new measures outperformed CPIX in terms of more closely tracking headline inflation, were less volatile than headline inflation, were related to the underlying drivers of inflation, and were easy to understand and explain. As we argue later in this paper, it is not so clear that the three measures are so easy to explain. All these measures filter out extreme price movements. However, they differ from CPIX in that the components that are filtered out are not fixed, but can change over time.
CPI-trim excludes CPI components whose rates of change in a given month are located in the tails of the distribution of price changes. More specifically, the measure excludes 20 percent of the weighted monthly price variations at both the bottom and top of the distribution of price changes. Therefore, it removes 40 percent of the total CPI basket.
CPI-median is a measure of core inflation corresponding to the price change located at the 50th percentile (in terms of the CPI basket weights) of the distribution of price changes in any given month. It is designed to filter out extreme price movements specific to certain components. It is similar to CPI-trim in that it eliminates all the weighted monthly price variations at both the bottom and top of the distribution of price changes in any given month, leaving the price change for the component that is the midpoint of that distribution.
CPI-common is a measure of inflation that tracks common price changes across all CPI categories. It uses a statistical procedure called a factor model to detect shared or common variations in these price movements. This is designed to filter out price changes that are specific to individual components. The statistical model underlying the index is re-estimated whenever new data become available so that the common variations constantly change over time.33 The Bank also publishes two other exclusion-based measures linked to core inflation. CPI-XFET excludes only food, energy, and the effect of changes in indirect taxes. CPIW adjusts the weight of each CPI component by a factor that is inversely proportional to the component’s variability while also excluding changes in indirect taxes. For definitions of all these measures, see https://www.bankofcanada.ca/rates/price-indexes/cpi/. These revisions have caused CPI-common to fall out of favour with the Bank (Macklem 2022).
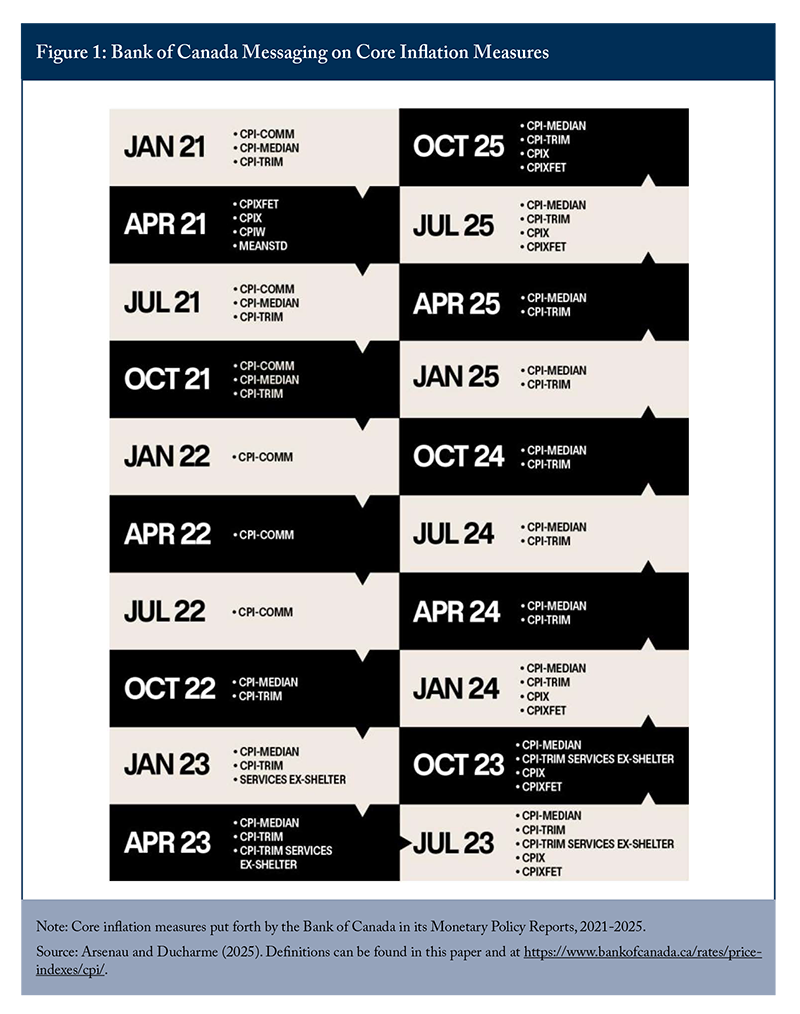
To reinforce our earlier point about the complexity of communicating underlying inflation measures to the public, a study from the National Bank of Canada (Arsenau and Ducharme 2025) found that the Bank of Canada since 2021 has repeatedly used different combinations of core measures in its quarterly Monetary Policy Reports (see Figure 1).
Q: What are the desirable features of underlying inflation measures?
A: They provide a combination of signals for policymaking, clear communication, and saliency for lived experiences.
The ideal measure of underlying inflation should satisfy three criteria. First, it should extract signals about future inflation pressures to inform policymakers. Second, it should allow the Bank of Canada to clearly communicate its policy stance and how it will achieve the inflation target to the general public. And third, it should be salient for how people form their expectations about future inflation.
For the first criterion, consider total inflation as having two components: a core inflation measure capturing the long-run trend and a residual measure representing temporary deviations from this trend. There are several statistical measures one can use to evaluate underlying inflation. First, it should have no systematic deviations from CPI inflation – in other words, the residual should equal zero on average (that is, it should be unbiased). Second, it should be less volatile than the CPI. And third, it should be more persistent than headline inflation, given the removal of the temporary deviations.44 See Lao and Steyn (2019) for more on bias, volatility, and persistence, as well as an evaluation of different core measures based on these criteria. They follow the methodology of Khan et al. (2015) in their analysis, as we do here in the following section.
For the other two criteria, however, one needs to rely on qualitative features. For communication, the measure of underlying inflation should be easy to understand and support the Bank’s narrative when explaining its policy stance. As such, the way the measure is calculated should be clear, and it should be subject to minimal revisions over time. Finally, the measure needs to be economically meaningful for people in that it connects with their inflation experiences. People will then adjust their expectations as the policy stance becomes a reflection of the current situation, making policy credible.
Satisfying all these properties is a tall order, and it is fair to say that the perfect measure of underlying inflation along these criteria most likely does not exist. Still, understanding underlying inflation is crucial for the Bank’s policy decisions, independent from being a communication device and being salient for people. We, therefore, need to evaluate how well the Bank’s indicators have fared in the past from a statistical point of view.
Q: How well have the Bank’s measures performed in the past?
A: All core measures provide useful information about underlying inflation, but no single one outperforms the others.
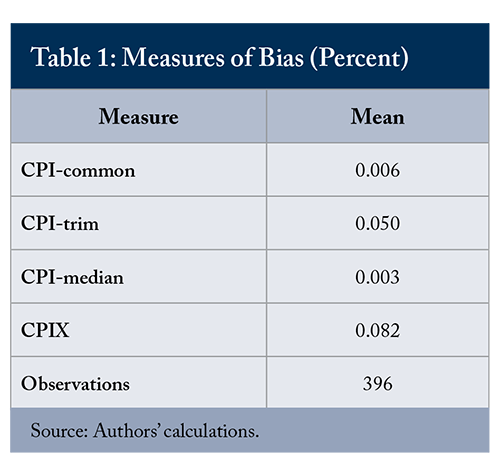
We first evaluate whether the Bank’s core measures systematically differ from headline inflation. If they do not, which is desirable, the residual discussed above is equal to zero on average and, in statistical parlance, the core measures are unbiased relative to the CPI. Table 1 calculates the mean deviation of the four measures from the CPI, using data from January 1993 to December 2025. The mean of all four measures is less than one-tenth of a percentage point different from zero. Hence, one can conclude that these measures are unbiased.55 The Bank provides a full time series of its three current measures, even though it has used them only since 2017. The three current measures remain unbiased even if we shorten the evaluation period from 2017 to 2025. The mean for CPI-common for that shorter period is 0.082, for CPI-trim it is -0.007, and for CPI-median it is 0.008.
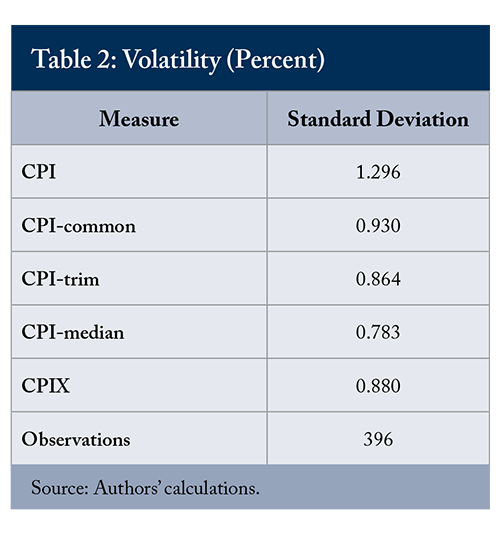
Ideally, core inflation measures will be less volatile than total inflation. Hence, we compare the standard deviations of the four indices with that of the CPI, as in Khan et al. (2015) and Ambler and Kronick (2025). Table 2, covering January 1993 to December 2025, shows a notable decline in volatility for each core measure relative to total inflation.
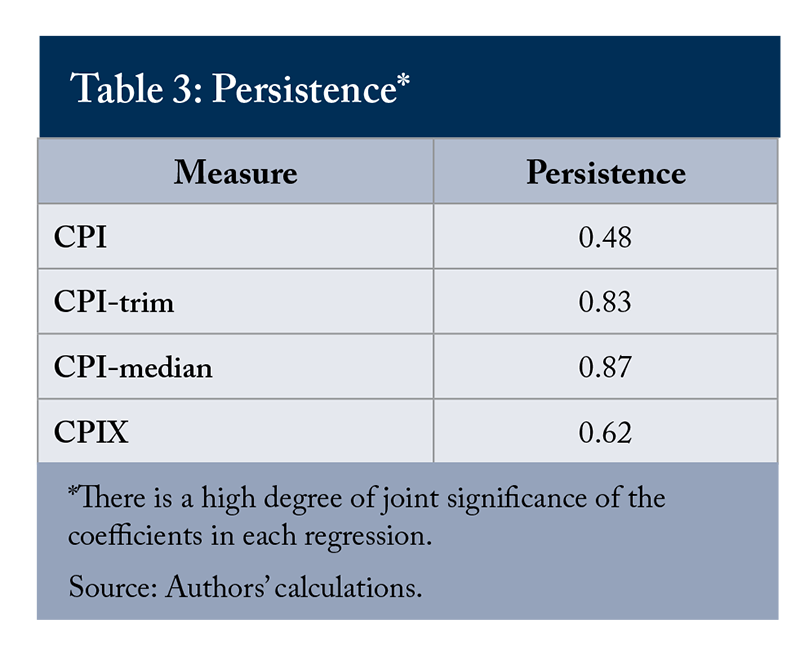
Before turning to their forecasting performance, we look at the indices’ persistence. Since core measures remove the temporary shocks from the calculation of total inflation, they should by construction be more persistent. As in Khan et al. (2015), we measure persistence over our January 1993 to December 2025 period by regressing quarter-on-quarter inflation for each measure on five lags of the same measure.66 In the Appendix, we discuss the use of these lags in greater detail. Table 3 reports the sum of these regression coefficients.77 The level of CPI-common is unfortunately not available for calculating quarter-over-quarter inflation. The calculated coefficient for all core measures is larger than the one for the CPI, indicating the desired increase in persistence.
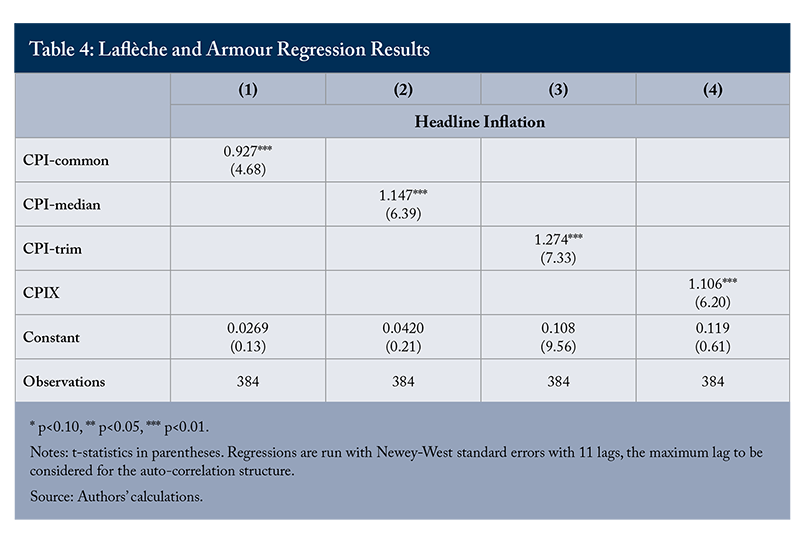
Our next test examines how well each core measure does as a predictor of future inflation. Following Laflèche and Armour (2006) and Ambler and Kronick (2025), we ran a regression to ask whether any deviation of core inflation from headline inflation shows up as a one-for-one change to headline inflation 12 months ahead.88 We ran a second regression asking whether that deviation shows up in a change to core inflation 12 months ahead. In the latter regression, the estimated coefficient should be insignificant. Results not shown here indicate that this is the case for all core measures except CPI-common. If so, the core measure would have predictive power for headline inflation. Since the Bank has consistently made the case that monetary policy takes 18-24 months to work its way through the economy, our use of 12 months ahead for the dependent variable should allow us to capture the true effect of a deviation in core inflation today on headline inflation at that horizon.99 We test this hypothesis in the Appendix.
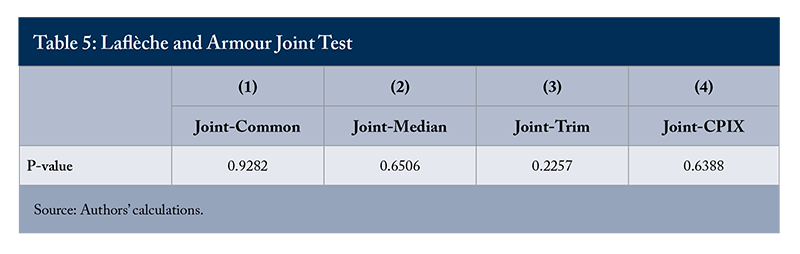
For a properly functioning underlying measure, the coefficient on the variable that expresses the deviation of core inflation from headline inflation should be significant and equal to one, while the constant in the regression should be insignificant (equal to zero). This would then indicate that a deviation in core inflation from headline inflation causes a one-for-one change in headline inflation 12 months ahead. The results in Table 4 strongly support this conclusion. Table 5 further supports it by presenting a joint statistical test of the coefficient equalling one and the constant being insignificant. For all core measures, we cannot reject this joint null hypothesis.1010 The Appendix contains other robustness checks.
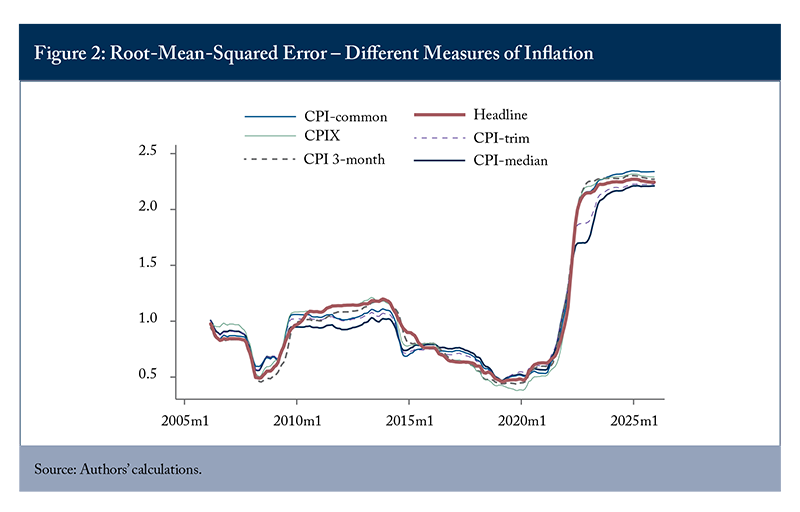
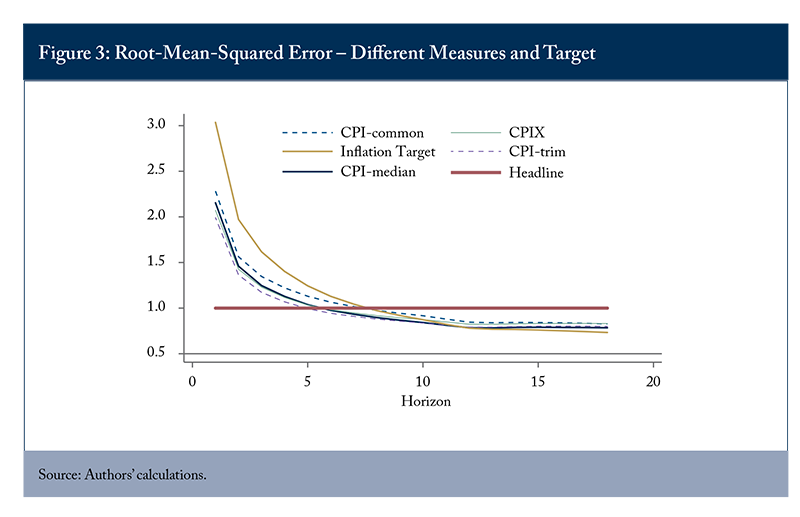
Finally, we assess the accuracy of inflation forecasts when using each of our core inflation measures, as well as inflation itself and three-month inflation. To do so, we use the root-mean-squared error of a simple forecasting procedure.1111 Using subsamples of 100 observations, we regress inflation 12 months ahead on our core measures and use the estimates to predict inflation 12 months out. We then average the squared forecast errors over a five-year (60-month) period and calculate the square root. See McCracken and Ngan (2023) and Ambler and Kronick (2025) for more details. Interestingly, the core measures do not consistently perform better as a predictor of future inflation than the CPI itself (i.e. have a lower root-mean-squared error), and none of the core measures reliably outperform any of the other core measure (Figure 2).
Khan et al. (2015) also use the root-mean-squared-error approach, but instead use raw data (as opposed to a regression) and focus on different horizons (as opposed to different moments in time). Interestingly, the results vary by horizon, with inflation itself being the best predictor over the first four months, then CPI-trim for months five-to-10, and CPI-median for month 11. For the one-year horizon and beyond, the best predictor is the inflation target itself, confirming the Bank’s success story in anchoring expectations (Figure 3).
Q: How then should the Bank communicate its policy stance to the public?
A: The Bank should publish its inflation forecast and accompanying policy path at every policy announcement. The communiques should focus on how current and future interest rates will anchor this forecast around the 2 percent target.
The takeaway is that the core inflation measures are informative about underlying inflation. However, it is not clear that any one measure is the best. This makes them good tools for internal use and suggests that the Bank can continue refining its measures and possibly developing new ones to aid in policymaking.
The measures are, however, not the most salient. They exclude – by design – many components that are the most relevant for people’s inflation experience, such as food, shelter, or gasoline prices. Furthermore, people are most familiar with the CPI, which is regularly reported and referred to in the news media. And CPI inflation is what ultimately matters for people, which is one main reason why the Bank’s goal is specified in terms of the CPI’s annual rate of change. Additionally, the Bank’s shifting emphasis on different measures in its communication can create confusion about which one is most relevant for people.
Consequently, these measures do not make for good communication tools. Their analytical complexity brings up concerns that people will find the measures out of touch with their inflation experience, making them largely irrelevant for guiding inflation expectations.
A different communication approach would focus primarily on the CPI’s projected inflation path over the policy horizon – say eight quarters – together with a forecast for interest rates that generates this inflation path. A technical challenge arises here as the Bank’s projections are quarterly and, hence, only published in the Monetary Policy Report (MPR) every three months. Still, on announcement dates that do not coincide with an MPR release, the Bank could simply refer back to its last communicated projections and discuss any fundamental new developments.
The projected inflation path reflects underlying inflation together with the impact of potential future interest rates. The Bank can then show clearly the path of headline inflation and explain the reasons why it may or may not be roughly at the target of 2 percent, given its current and future projected policy stance. Indeed, as the timeframe approaches the eight-quarter policy horizon, one would expect that the Bank’s key policy interest rate over time is chosen to achieve precisely the target.
Our proposal is a deviation from the Bank’s current practice. The Bank now publishes its MPR four times a year, and it contains information on future CPI inflation. There are three important shortcomings with the current approach. First, the projections are not tied to every policy announcement. One would expect the announcements to be the primary communication tool with the general public rather than the MPR.
Second, the Bank does not publish its intended interest rate path together with its forecast for CPI inflation, which would better help communicate how these two factors (necessarily) evolve together. And third, charts of past and projected headline inflation are commonly combined with information on what components are responsible for their development, somewhat muddying the overall picture.1212 An additional concern may be that the Bank does not publish a fan chart for its projections of future inflation that could speak to the uncertainty surrounding its policy stance. However, the Bank does show its revisions to previous inflation projections, albeit to a limited extent.
The New Zealand and Norwegian central banks already follow some of these suggestions in their communication strategies, publishing a path for future interest rates alongside their inflation projections, albeit only at the four announcement dates when they also update their projections. The US Federal Reserve publishes the individual rate forecasts of its Federal Open Market Committee members. Other central banks – such as the Bank of England, the European Central Bank, and the Swedish Riksbank – use a more minimalist approach of simply publishing the market-implied interest paths used as an input for their published inflation forecasts.
When publishing the policy path necessary to achieve its headline inflation forecast, the Bank would have no need to argue how a particular core measure reflects underlying inflation to inform its policy decision today. It would shift the narrative to how – in the future – the Bank’s policy stance can bring inflation in line with the 2 percent headline objective, directly influencing people’s expectations of medium-term inflation.
A common objection to publishing an interest rate path is that it would be interpreted by some as an unconditional commitment to following the predicted interest rate path, something often equated with formal forward guidance as an unconventional monetary policy tool.1313 See Rudebusch (2008) who discusses both the pros and cons of central banks publishing an interest-rate path. A failure to follow the predicted path could then lead to a loss in credibility. Also, people might interpret path deviations as errors in the Bank’s judgment about the economy or possibly even a lack of commitment to the 2 percent inflation target.
The solution to all these problems is clearer communication. The Bank could begin its revised communication strategy by explaining why it is publishing its interest rate forecast alongside its other forecasts of inflation and output, linking them together and highlighting their conditional nature. It could explain that the decision behind publishing its interest-rate forecast is that it provides improved insight to the public as to how the Bank responds to new economic information (e.g., inflation, output).
In future communications, the Bank would then need to explain the reasons behind changes in the projected interest rate path, tying them to changes in the projections of other economic variables in its MPR, most critically, inflation. Making this path and its revisions explicit in each MPR (which is published on every second announcement date) and reviewing it for announcements without a formal report release would increase the transparency of its monetary policy decisions. And publishing confidence bands around the predictions – or different scenarios, as the Bank has recently done – could then enhance the credibility of the Bank further, provided the policy path is generally well chosen.
The experiences of other countries with such an approach are promising. The Swedish Riksbank points out that the main concerns with publishing an interest rate path have not materialized (Sveriges Riksbank 2017). The Norges Bank of Norway has found that communicating the path reduced market volatility and led to a better alignment of expectations (Holmsen et al. 2008), which has been confirmed more recently for several central banks publishing an interest rate path (Hofmann and Xia 2026). Finally, the Reserve Bank of New Zealand has reacted to concerns about its communication challenges with the general public by making a clear distinction between conditionality and an explicit commitment through forward guidance.
Conclusion
The Bank of Canada is right to seek improved core inflation measures for its internal use. Such measures act as a robust signal of underlying or trend inflation and thus are indispensable as an input into setting interest rates to achieve the 2 percent headline inflation target. The goal, however, should not be to find a perfect index that can also be used to explain its policy decisions to the general public. Instead, a different communication strategy should focus on joint forecasts of headline inflation and future policy rate decisions. This approach would ensure that policy decisions remain credible and transparent, even in the face of complex price dynamics. The current use of competing and sometimes contradictory core measures seems counterproductive.
The Bank could not only follow in the footsteps already taken by many central banks, but also go a step further by providing the public with greater clarity about the ultimate reasons for its current and future policy stance. People need to know that inflation is well anchored at 2 percent and have confidence that the Bank’s current and future policy decisions ensure that it remains so. This can be done without them needing to understand technical measures of core inflation.
The authors extend gratitude to Mawakina Bafale, Colin Busby, Pierre Duguay, Paul Jenkins, David Laidler, Peter MacKenzie, Angelo Melino, John Murray, and several anonymous referees for valuable comments and suggestions. The authors retain responsibility for any errors and the views expressed.
Appendix – Robustness Checks
In our research, we ran a number of different robustness checks/sensitivity analyses.
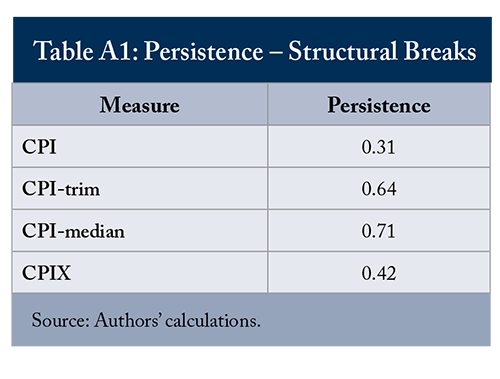
We tested for structural breaks in the data and found inconsistent results, with some tests making the case for breaks, while others do not.1414 We performed a Supremum-Wald test, a Wald or Likelihood-Ratio test, a Cumulative Sum test for parameter stability, and a Bai and Perron test for multiple breaks. As a result, our primary specification looking at persistence is estimated over the whole sample. A robustness check, where we put dummies in for specific break candidates (after 2008Q4 and after 2020Q1), yielded no change to the persistence results in terms of gaps between core measures and headline inflation (Table A1).
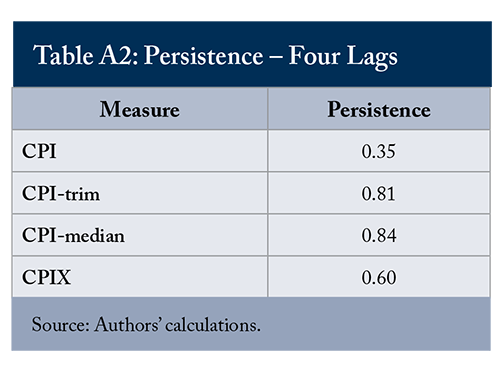
In the primary specification looking at persistence, we used five lags. We tested using four lags to see if it made a difference. We found similar findings as in the main regression (see Table A2). We used more lags than the information criteria suggested. For example, the Hannan-Quinn Information Criterion (HQIC) recommends one lag in each case, except for CPIX, where it recommends three. This is because, whereas information criteria is used to produce the appropriate lag structure in a forecasting exercise, our analysis is about persistence and attempting to capture a longer cycle.1515 At three lags, the coefficients for CPI-median, CPI-trim, CPIX, and CPI itself are 0.84, 0.82, 0.65, and 0.42 respectively. In other words, there is very little change.
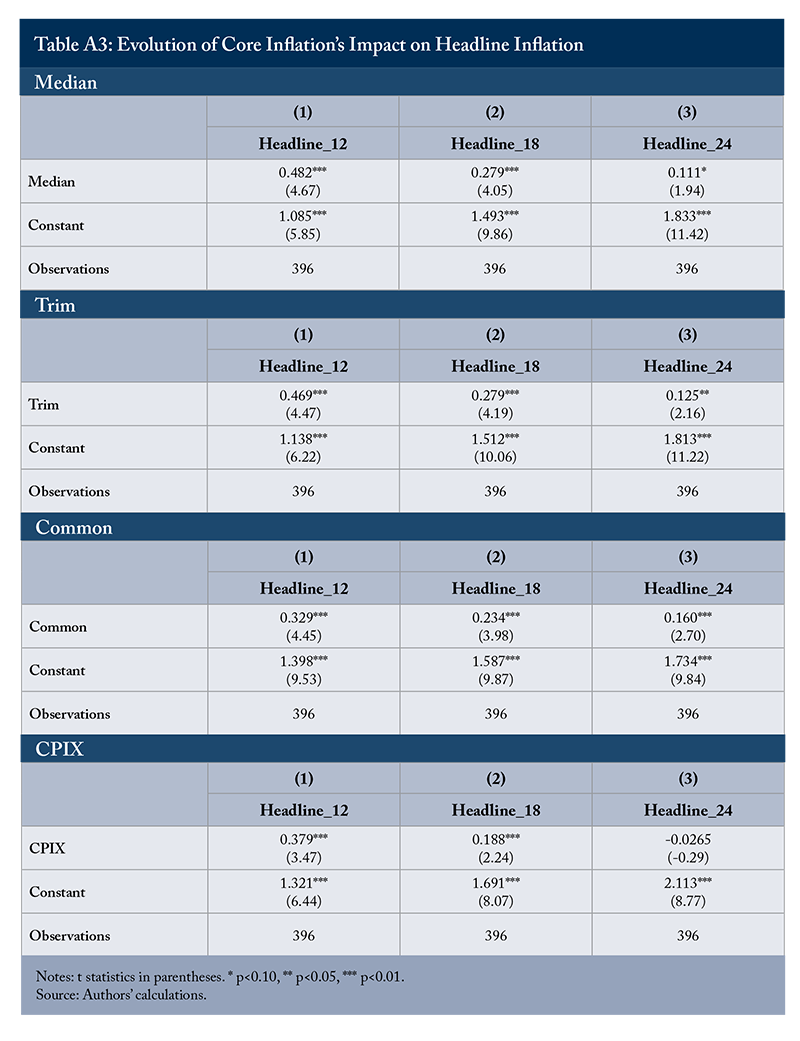
Another test for the quality of a core inflation measure is how it affects headline inflation over time. If the best predictor of headline inflation 18-24 months out for a successful inflation-targeting central bank is the 2 percent target itself (Rowe and Yetman 2002), then we would expect the effect of core inflation on headline inflation to fall toward zero as we forecast further out and the constant to increase toward two. We tested this by running a regression of headline inflation 12 months, 18 months, and 24 months ahead on core today to see how the coefficients on core and the constant evolve over time.
As we see in Table A3, for each core measure, the coefficient on core steadily decreases toward zero (hitting zero in the case of CPIX) by 24 months, while the constant increases toward two, as expected.
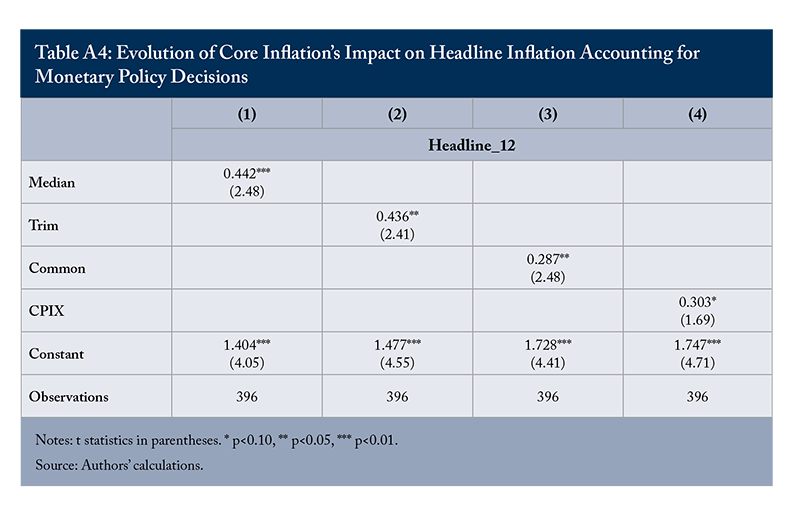
Lastly, to test our comfort that monetary policy decisions taken in response to core inflation in period t haven’t worked their way through the economy to headline inflation at the 12-month horizon, we ran this same regression for that period, accounting for Bank of Canada actions. Specifically, we controlled for period t’s monetary policy rate announcement and the next seven announcements (which then accounts for 12 months of fixed policy-rate decisions) in a regression of headline inflation 12 months ahead on core today. We found similar coefficients in Table A4 on core as we do in the 12-month regression results in Table A3, reinforcing the idea that at the one-year mark, monetary policy is still working with a lag on inflation.
References
Ambler, Steve, Thorsten Koeppl, and Jeremy Kronick. 2025a. “Flexible Inflation Targeting Beats a Dual Mandate: Lessons for Canada’s 2026 Framework Renewal.” E-Brief 373. Toronto: C.D. Howe Institute. May.
________________. 2025b. “Don’t Take It for Granted: Strengthening the Bank of Canada’s Independence.” E-Brief 378. Toronto: C.D. Howe Institute. November.
Ambler, Steve, and Jeremy Kronick. 2025. “Blurred Vision: How Mortgage Interest Costs Impact Inflation.” E-Brief 368. Toronto: C.D. Howe Institute. May.
Arsenau, Matthieu, and Alexandra Ducharme. 2025. “BoC and Its Core Inflation Measures: A Relationship on the Rocks.” National Bank of Canada. November 6.
Bank of Canada. 2016. “Renewal of the Inflation-Control Target – Background Information – October 2016.” October.
________________. 2021. “Monetary Policy Framework Renewal.” December.
Bullard, James. 2011. “Measuring Inflation: The Core Is Rotten.” Federal Reserve Bank of St. Louis Review 93: 223–233.
Hofmann, Boris, and Fan Dora Xia. 2026. “Quantitative forward guidance through interest rate projections.” Working Paper 1009. Bank for International Settlements.
Holmsen, Amund, Jan Qvigstad, Oistein Roisland, and Kristim Solberg-Johansen. 2008. “Communicating monetary policy intentions: The case of Norges Bank.” Working Paper 2008/20. Norges Bank.
Howitt, Peter. 1997. “Alternative Strategies for Aggregating Prices in the CPI: Commentary.” Federal Reserve Bank of St. Louis Review 79: 139–141.
Keshissbanoosy, Roobina, et al. 2022. “Consumer Price Index and Inflation Perceptions in Canada: Can Measurement Approaches or Behavioural Factors Explain the Gap?” Statistics Canada.
Khan, Mikael, Louis Morel, and Patrick Sabourin. 2015. “A Comprehensive Evaluation of Measures of Core Inflation for Canada.” Staff Discussion Paper 2015-12. Bank of Canada.
Laflèche, Thérèse, and Jamie Armour. 2006. “Evaluating Measures of Core Inflation.” Bank of Canada Review. Summer. 19–29.
Lao, Helen, and Ceciline Steyn. 2019. “A Comprehensive of Measures of Core Inflation in Canada: An Update.” Staff Discussion Paper 2019-9. Bank of Canada.
Macklem, Tiff. 2022. “What’s happening to inflation and why it matters.” Speech to the Halifax Chamber of Commerce. October 6.
McCracken, Michael, and Tràn Khánh Ngân. 2023. “Using Core Inflation to Predict Headline Inflation.” On the Economy Blog. Federal Reserve Bank of St. Louis. November 28.
Mendes, Rhys. 2025. “Underlying Inflation: Separating the Signal From the Noise.” Remarks by the Deputy Governor of the Bank of Canada to the Ivey Business School. October 2.
Rowe, Nicholas, and James Yetman. 2002. “Identifying a Policymaker’s Target: An Application to the Bank of Canada.” Canadian Journal of Economics 35: 239–256.
Rudebusch, Glenn D. 2008. “Publishing Central Bank Interest Rate Forecasts.” FRBSF Economic Letter. Number 2008-02. January 25.
Sabourin, Patrick. 2012. “Measurement Bias in the Canadian Consumer Price Index: An Update.” Bank of Canada Review. Summer.
Smith, Gregor. 2009. The Missing Links: Better Measures of Inflation and Inflation Expectations in Canada. Commentary 287. Toronto: C.D. Howe Institute.
Sveriges Riksbank. 2017. “The Riksbank’s Experiences of Publishing Repo Rate Forecasts.” Riksbank Studies. June.
This E-Brief is a publication of the C.D. Howe Institute.
Jeremy Kronick is President and CEO of the C.D. Howe Institute.
Steve Ambler is a Fellow-in-Residence and the David Dodge Chair in Monetary Policy at the C.D. Howe Institute, and is a professeur émérite, Département des sciences économiques, École des sciences de la gestion, at Université du Québec à Montréal.
Thorsten Koeppl is a Fellow-in-Residence and Scholar in Financial Services and Monetary Policy at the C.D. Howe Institute, and is a Professor, Robert McIntosh Fellow, and RBC Fellow at Queen’s University.
This E-Brief is available at www.cdhowe.org.
Permission is granted to reprint this text if the content is not altered and proper attribution is provided.
The authors retain responsibility for any errors and the views expressed.