







By Joel Balyk, Brian Livingston, Sara Hastings-Simon, Grant Bishop
The Study In Brief
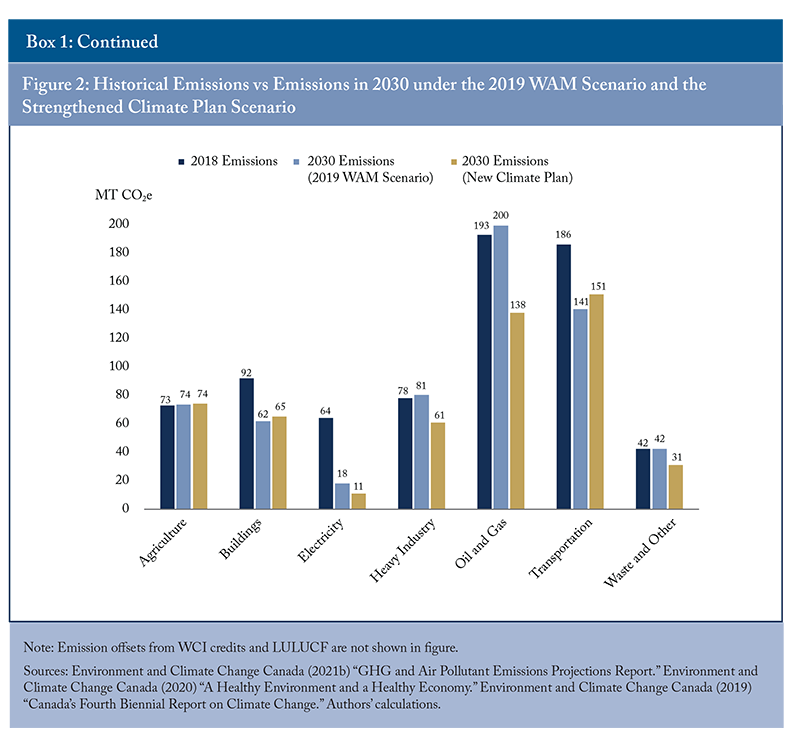
The federal government’s “strengthened climate plan,” called “A Healthy Environment and a Healthy Economy,” projects a reduction of 213 megatonnes (MT) of greenhouse gas (GHG) emissions – or 30 percent of 2018 nationwide GHGs – by 2030. The plan projects GHGs from transportation to fall by 35 MT from 186 MT in 2018 to 151 MT by 2030. Understanding the practical implications of transportation emissions goals will support policymakers in considering the trade-offs involved in achieving those goals.
This report focuses primarily on passenger and freight transportation, from cars to SUVs and trucks, which are the main sources of the sector’s emissions. It explores the practical implications of achieving this projected reduction, finding that it translates to a 41 percent reduction in average GHGs per passenger vehicle over the next decade. An example scenario would require several concurrent events: an increase in the blending of biofuels, a 2.5 percent annual improvement in the efficiency of internal combustion engine vehicles, and having zero-emission vehicles (ZEVs) account for a roughly 30 percent share of the total vehicle stock. This will require the annual share of ZEV sales to reach 70-75 percent by 2030 – which corresponds with the federal government’s recently updated mandatory ZEV sales target of 100 percent of all passenger vehicles in 2035.
Significant GHG reductions from transportation require either decreases in driving or the replacement of older vehicles with more efficient, lower emission technology. The rate of turnover (i.e., retirement) of the current vehicle fleet is a significant determinant of what reductions are feasible by 2030.
If recent trends in vehicle sales (i.e., a shift from cars to larger passenger light trucks) persist, greater efficiency improvements or higher ZEV penetration would be required to achieve the projected reduction in transportation sector GHGs by 2030. The federal plan’s projected reductions would require a roughly 18 percent reduction in the average emission intensity of freight trucks by 2030. Such a reduction will require either improvements in vehicle efficiency, electrification or adaptation of hydrogen fuel cell technology for freight transport, as well as biofuel blending.
In 2018, Canada emitted approximately 728 megatonnes (MT) of carbon dioxide equivalent (ECCC 2021a).1Emissions from Canada’s official greenhouse gas inventory in 2019 were 730 MT. The values for 2018 are presented to avoid misinterpretation as they are commonly referenced in this paper as the base-year for the analysis. Canada’s most recent official greenhouse Canada’s initial 2030 GHG emission reduction target calls for emissions no higher than 511 MT, requiring a 30 percent reduction from current levels.2Under the Paris Agreement, Canada initially committed to reducing its GHG emissions by 30 percent below 2005 levels by 2030 with the long-term goal of reaching net-zero emissions by 2050. The 511 MT is based on ECCC’s 2020 NIR report which shows Canada’s net emissions in 2005 being 730 MT.
The federal government recently announced a new emissions target for 2030 requiring a reduction in GHG emissions of 40-45 percent from 2005 levels; however, this paper does not make any inference towards the new target as no material such as emissions modelling or reports have been published by the federal government as yet.
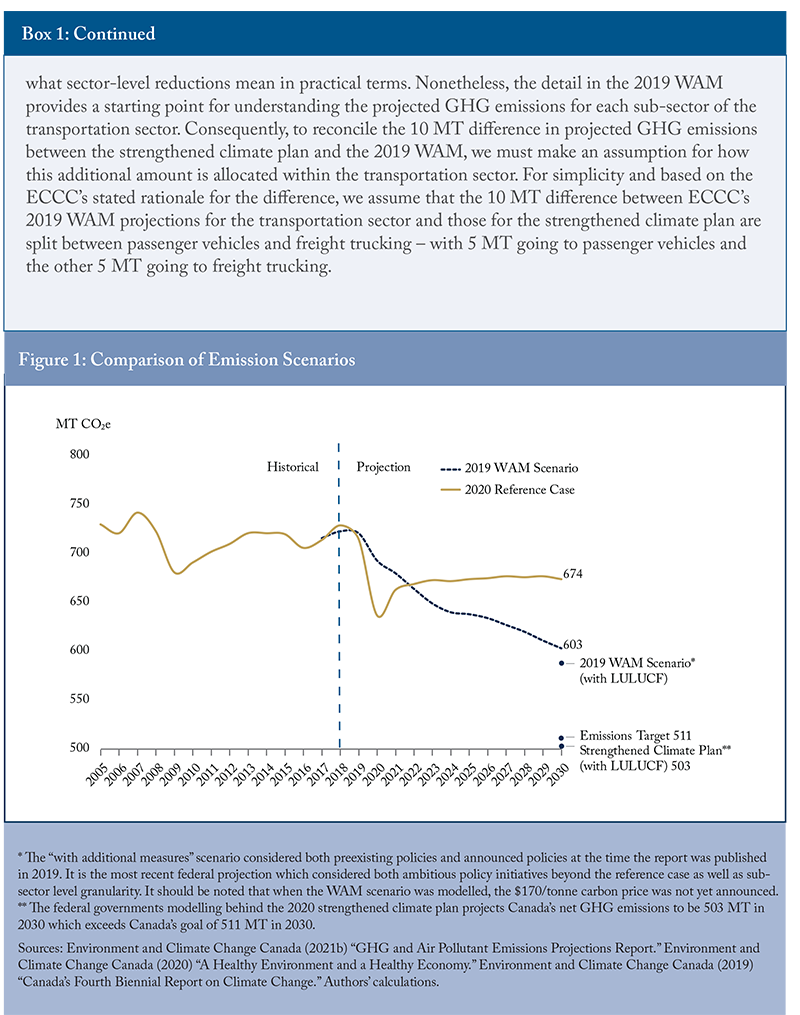
In December 2020, the federal government announced its “strengthened climate plan” in the report titled “A Healthy Environment and a Healthy Economy,” which is projected to meet and exceed Canada’s initial 2030 emission reduction target by bringing annual net emissions to 503 MT of carbon dioxide equivalent (CO2e) in 2030 (ECCC 2020). The strengthened climate plan projects transportation sector emissions to decline from 186 MT in 2018 to 151 MT by 2030 (ibid.).
This paper examines the practical implications of achieving the projected reductions in GHG emissions from Canada’s transportation sector. Specifically, this paper examines and models various scenarios to project the extent of emission-intensity reduction required for the passenger and freight vehicle fleet by 2030 and, in turn, what degree of vehicle efficiency improvement and penetration of ZEVs would be required. The analysis does not comment on the likelihood of achieving the reductions, or take a position as to the degree of ambition. Instead, by translating the sector-level projections into practical implications we hope to provide information to support the debate/discussion on these questions, as well as inform policy design to achieve them.
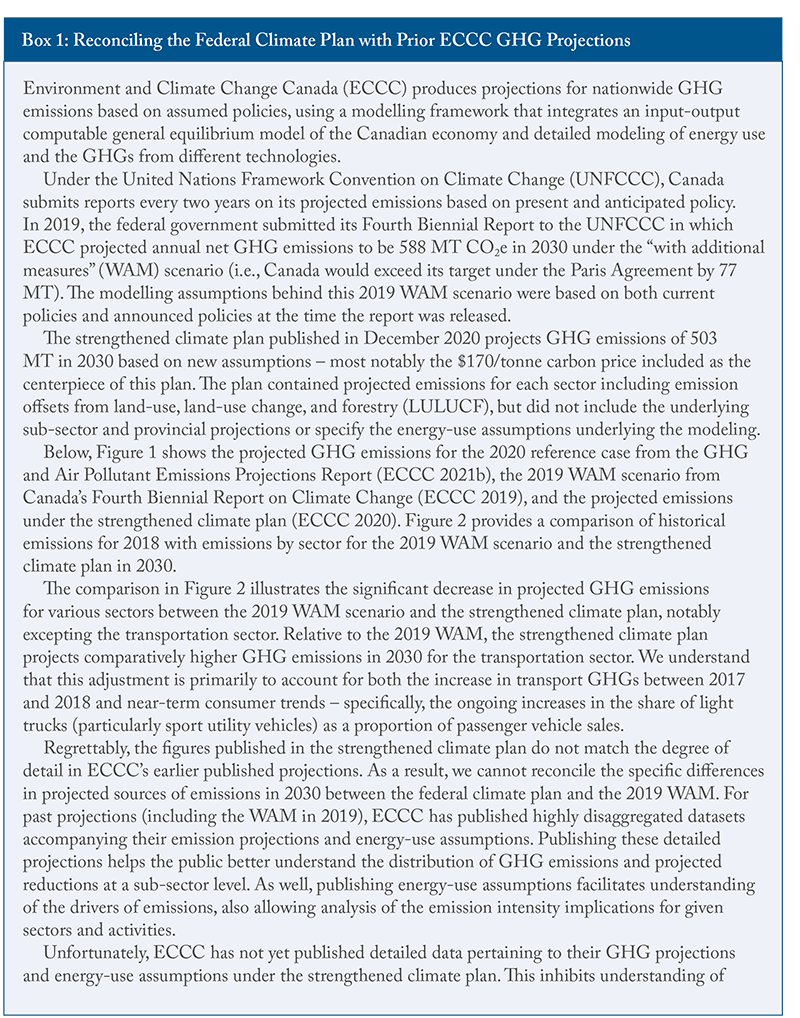
Regrettably, the projections in the strengthened climate plan, published in December 2020, only included projected emissions at the sector level (see Box 1). Unlike the annual GHG projections regularly published by Environment and Climate Change Canada (ECCC), the latest federal plan did not include projected GHGs by sub-sector and province. The relative lack of granularity in the projections for the federal plan inhibits analysis of the practical implications for other sectors like oil and gas or power. The federal government could facilitate understanding by the Canadian public and members of industry by publishing the more detailed projections (i.e., by sub-sector and province) that we assume underlie its sector-level projections.
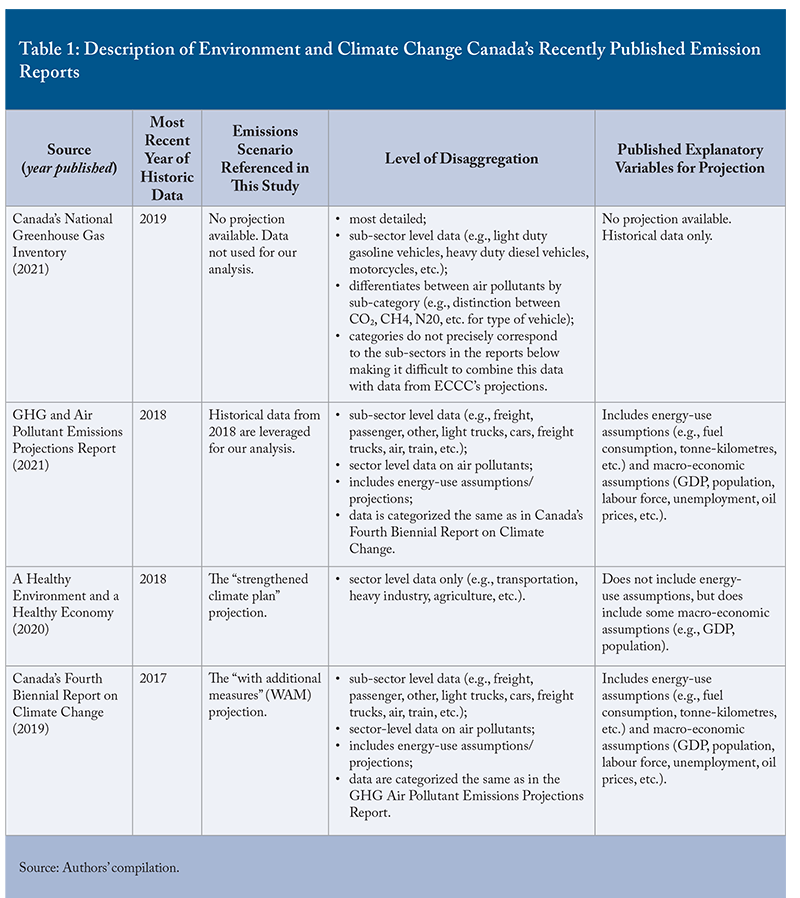
For the transportation sector, this paper nonetheless leverages several disaggregated projections from ECCC in conjunction with the 2030 emissions projections from the strengthened climate plan. Disaggregated emissions data for the most recent historical year – i.e., 2018 which will serve as our base year – were published in the 2020 GHG and Air Pollutant Emissions Projections Report (ECCC 2021b). Disaggregated emissions projections for 2030 come from the “With Additional Measures” (WAM) scenario published in Canada’s Fourth Biennial Report on Climate Change (ECCC 2019). Since 2030 transport emissions from the WAM scenario are 10 MT lower than the 151 MT projected in the strengthened climate plan, our analysis assumes the additional 10 MT to be split evenly between passenger vehicles and freight trucks (i.e., for the projected emissions in the WAM scenario in 2030, we assume emissions from passenger vehicles are 5 MT higher in 2030 than under the WAM and emissions for freight trucking are 5 MT higher in 2030 than under the WAM).3That is, the December 2020 federal plan projects 151 MT of GHGs in 2030 from the overall transportation sector but does not disaggregate the sources for these projected GHGs between each sub-sector (e.g., passenger vehicles, trucking of freight, air travel, rail). In contrast, ECCC’s 2019 “With Additional Measures” projection of 141 MT of GHGs in 2030 for the transportation sector provides the specific underlying projections for each sub-sector. Faced with the lack of granularity in published projections for the federal plan, we assume that the 10 MT difference between ECCC’s 2019 projections for the transportation sector and those for the federal plan are attributable to GHGs from passenger vehicles and freight trucking which together accounted for 83 percent of transport emissions in 2018. Refer to Table 1 for a more detailed breakdown of the various reports published by ECCC which are leveraged in this paper.
Projected Reduction in Transportation Sector Emissions
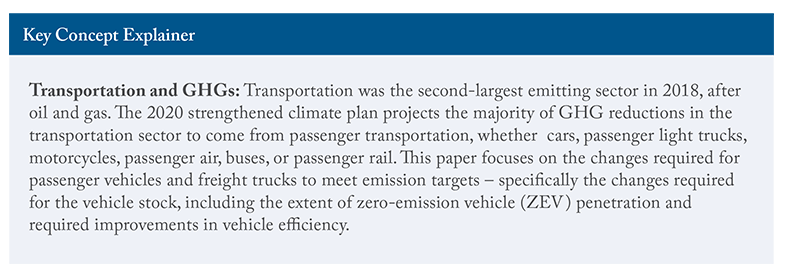
Transportation was the second-largest emitting sector in 2018 at 186 MT (ECCC 2021b). Emissions for this sector are projected to fall to 151 MT in 2030 under the strengthened climate plan (ECCC 2020).
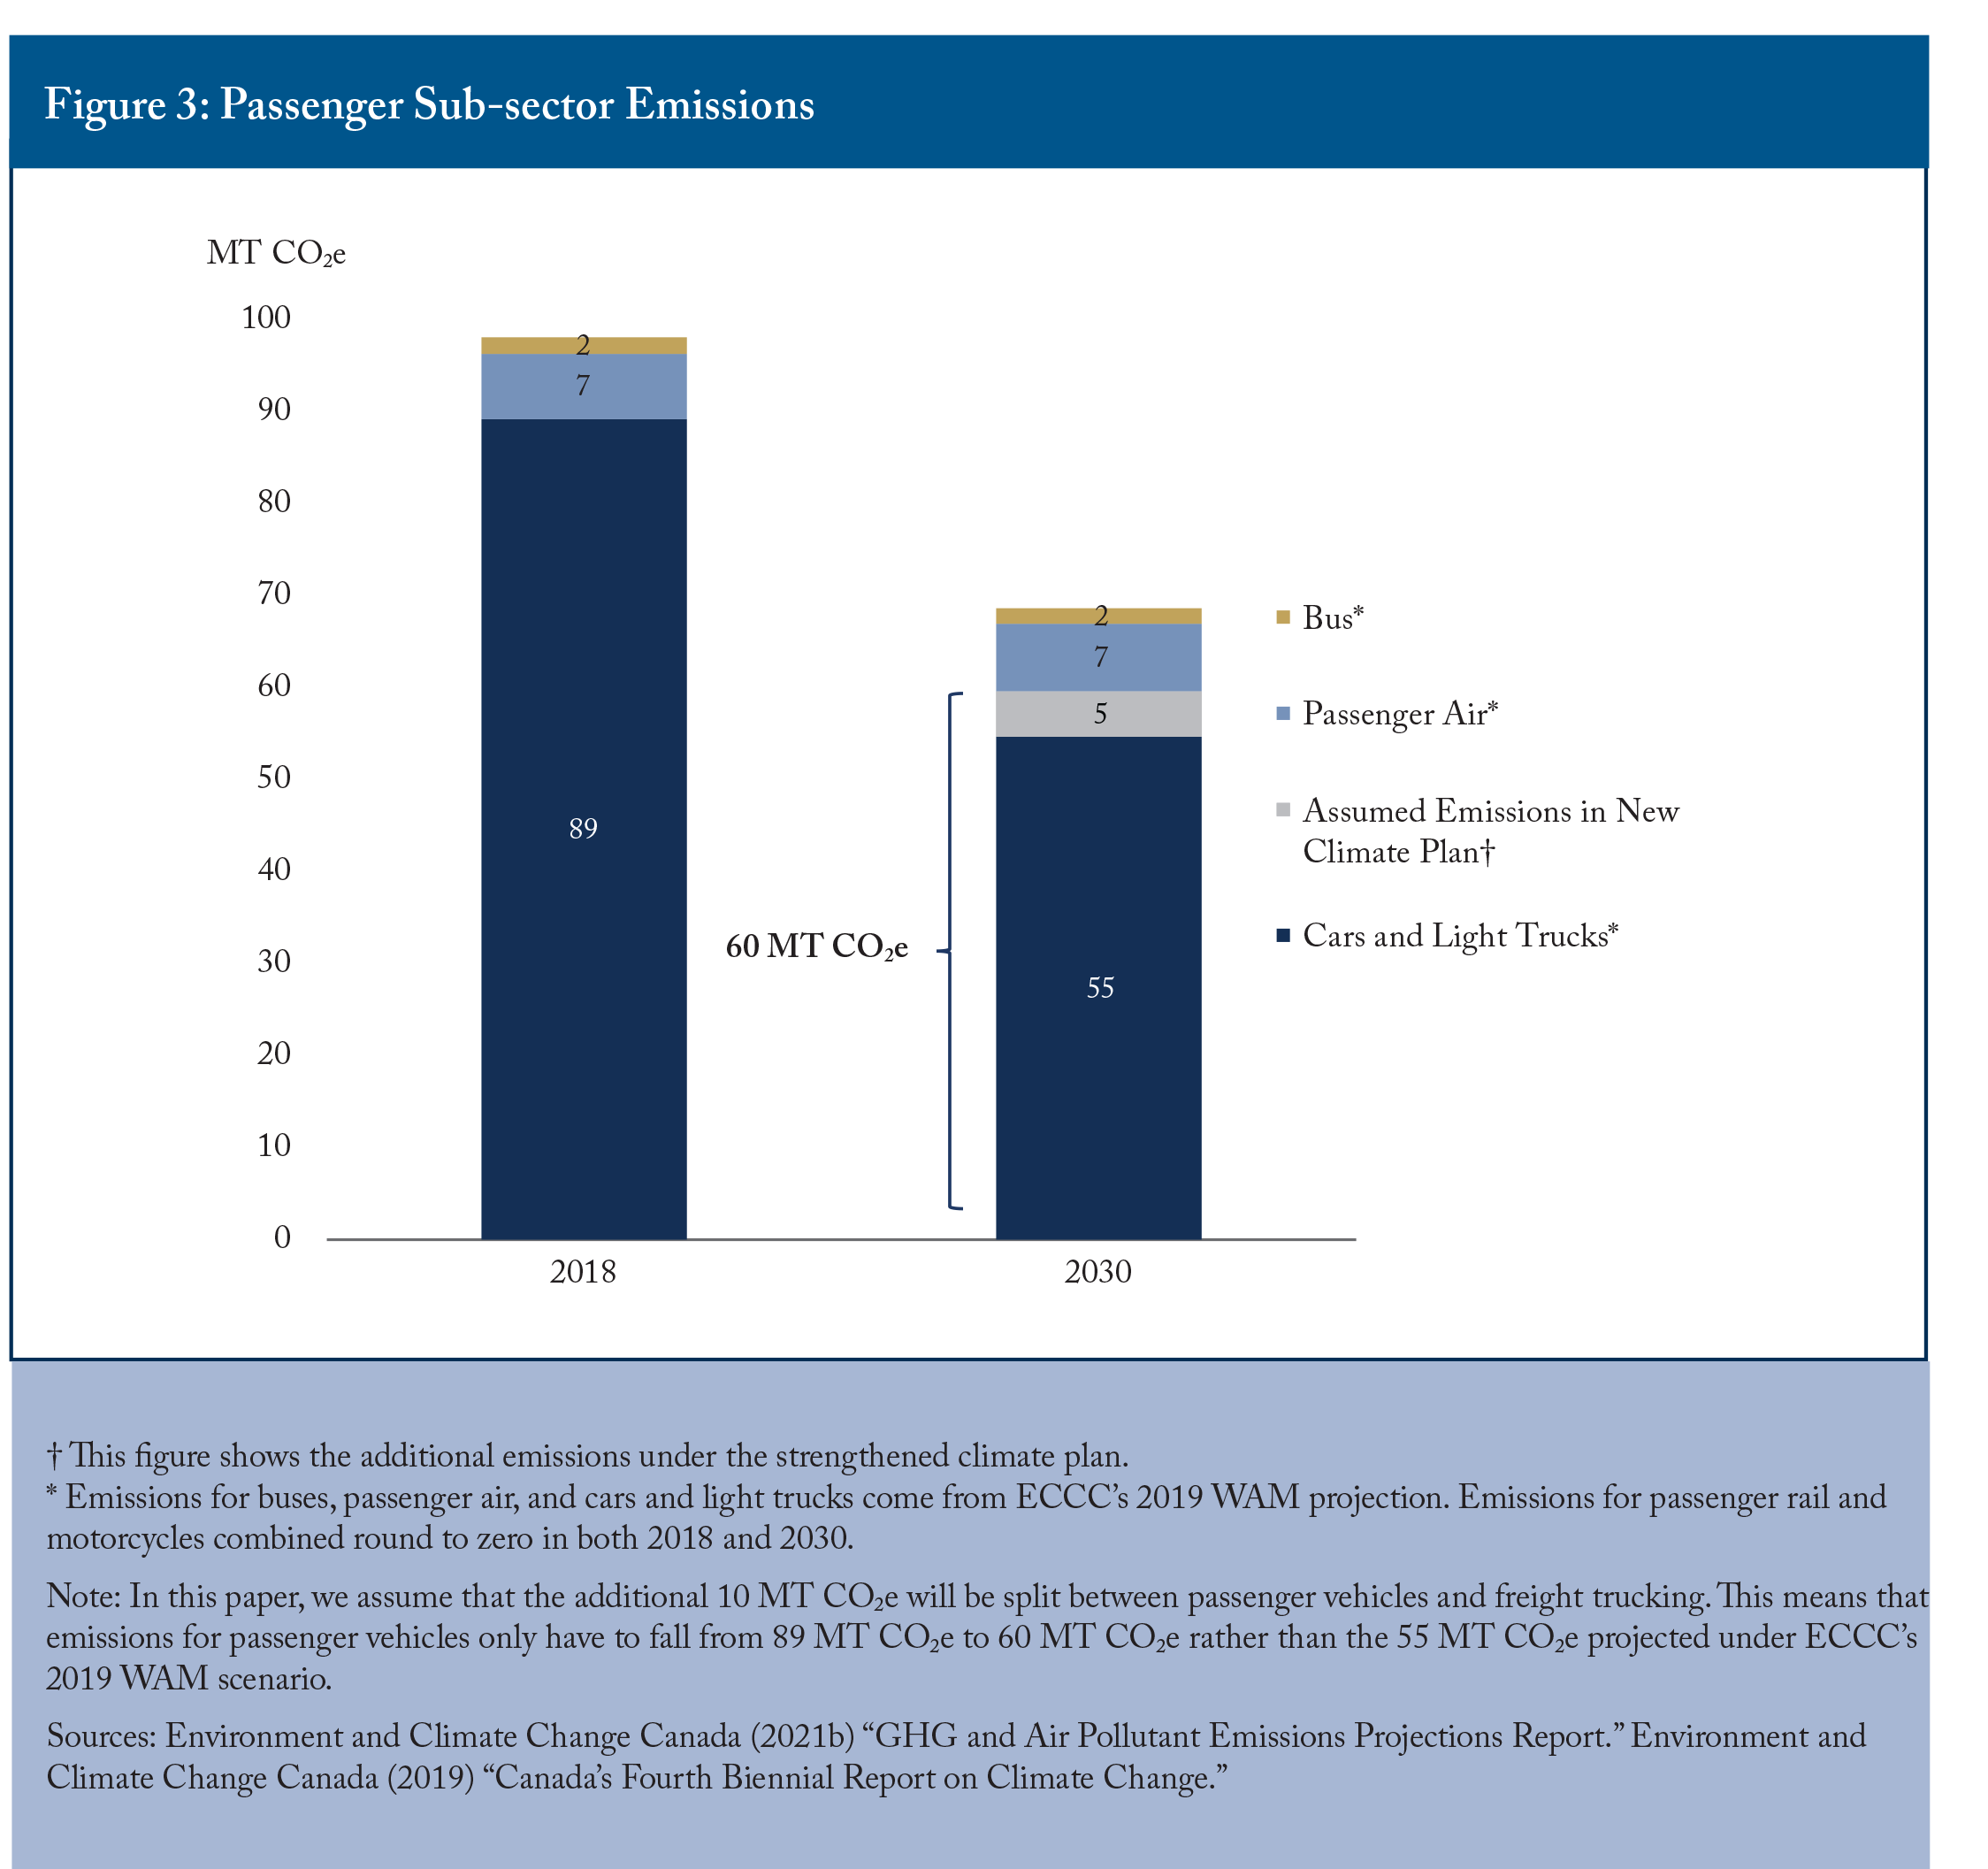
The strengthened climate plan projects the majority of GHG reductions in the transportation sector to come from passenger transportation. Emissions from passenger transportation are projected to fall from 98 MT CO2e in 2018 to 69 MT CO2e in 2030, while emissions from freight are projected to fall from 78 MT to 73 MT over the same duration (ECCC 2019, ECCC 2021b).4The 69 MT for passenger transportation comes from the 64 MT projected in 2030 under the WAM scenario plus the assumed 5 MT addition from the strengthened climate plan. Similarly, the 73 MT for freight transportation comes from the 68 MT from the WAM scenario plus the assumed 5 MT addition. See Box 1 for further description. Emissions from “Other” transportation are expected to remain relatively constant. Passenger transportation is comprised of cars, passenger light trucks, motorcycles, passenger air, buses, and passenger rail; freight transportation includes freight trucks, train, freight air, and marine; and “other” includes a variety of residential and commercial off-road vehicles such as all-terrain vehicles, watercraft, and snowmobiles.
Pathways for Reducing Emissions from Passenger Vehicles
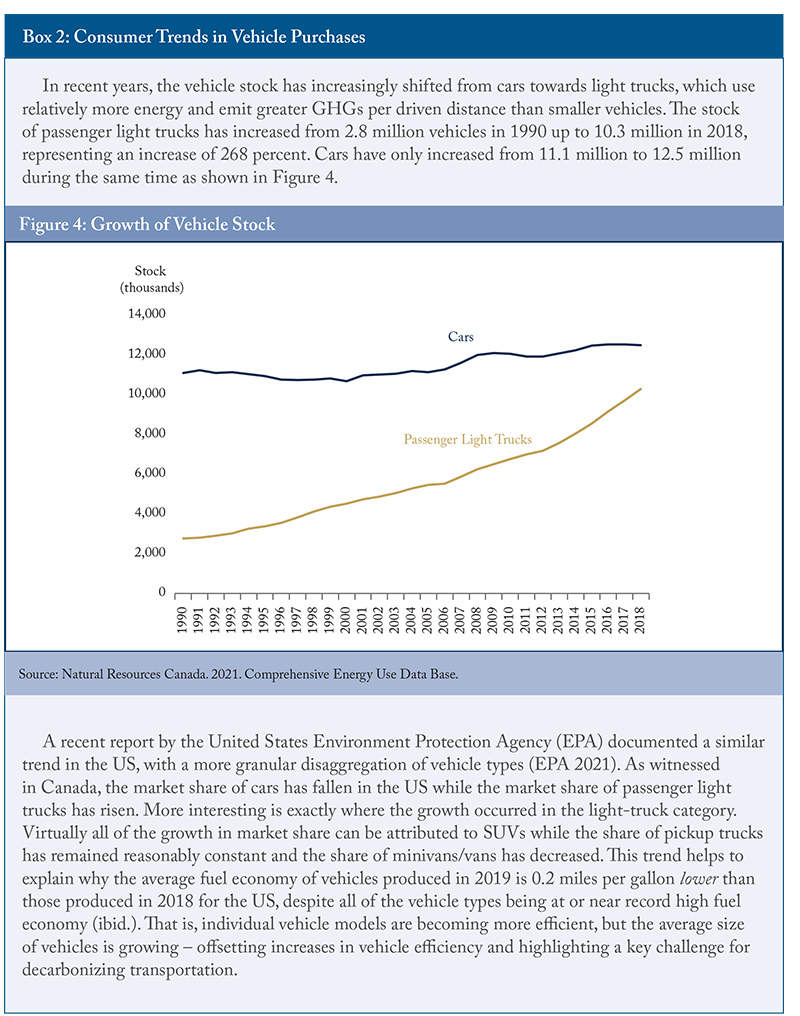
Cars and light trucks produce the majority of GHG emissions in passenger transportation, as shown in Figure 3. Emissions for cars and light trucks combined are projected to fall from 89 MT in 2018 to 65 MT by 2030 under the strengthened climate plan.5The 60 MT of GHGs for passenger vehicles in 2030 is found by taking ECCC’s previous 2030 projection from their 2019 WAM scenario, and adding 5 MT to accommodate the higher projection in the strengthened climate plan as discussed in Box 1. The light trucks category for passenger transportation is broad and includes the following types of vehicles: vans, minivans, sport utility vehicles (SUVs), crossover SUVs, and pickup trucks. The number of cars historically outnumbered the number of light trucks by a large margin; however, recent years have seen a shift away from cars and towards light trucks (see Box 2). The remainder of this section will refer to cars and passenger light trucks combined as “passenger vehicles.”
Turnover of Passenger Vehicle Stock
The aim of this report is to examine the implications of projected GHG emissions for the transportation sector in practical terms – specifically the changes required for the vehicle stock, including the extent of ZEV penetration and required improvements in vehicle efficiency. The emission intensity of the transportation sector depends on the composition of the stock and the composition of the vehicle stock in turn evolves with the sales of new vehicles and retirements from the current fleet. To relate the total GHG emissions from passenger vehicles in 2030 to decreases in emission intensity requires an estimate for the underlying driver – in particular, the size of the stock of passenger vehicles in 2030.
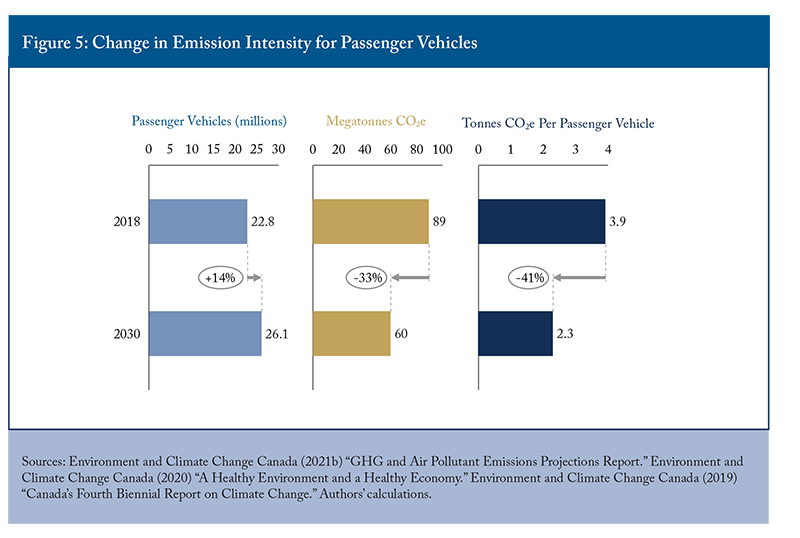
Although ECCC’s 2019 WAM includes detailed projections of GHG emissions for the transportation sector, their scenario does not publish its assumptions for the passenger vehicle stock (i.e., number of vehicles). Therefore, for this analysis, we use Canada’s projected population as the driver of passenger vehicle growth. Based on Canada’s projected population, we project the passenger vehicle stock to grow from 22.8 million vehicles in 2018 to 26.1 million vehicles in 2030.6We forecast the stock of passenger vehicles based on the projected population in ECCC’s 2020 GHG and Air Pollutant Emissions Projections Report, which is in turn based on Statistics Canada’s medium population growth scenario. The stock of passenger vehicles was projected by holding the vehicles per capita ratio of 0.615 constant out to 2030.
The federal government’s strengthened climate plan projects emissions from passenger vehicles to fall by 33 percent from 89 MT in 2018 down to 60 MT in 2030.7The 60 MT for passenger vehicles comes from the 55 MT projected in 2030 under the WAM scenario plus the additional 5 MT from the strengthened climate plan which we assumed would apply to both passenger vehicles and freight trucks. See Box 1 for further description. This implies that passenger vehicles will consume approximately 33 percent less fossil fuels in 2030 compared to 2018 – assuming constant emission factors (i.e., a predetermined level of emissions is emitted for every megajoule of fuel combusted).8Emission factors may differ slightly by fuel and by vehicle. Some examples that may lead to small discrepancies include: quality of fuel, quality of combustion process, quality of a vehicles catalytic converter, etc. Using ECCC’s emissions projection in conjunction with our passenger vehicle projection tells us that the emission intensity for passenger vehicles must fall from 3.9 tonnes CO2e per vehicle in 2018 down to 2.3 tonnes CO2e per vehicle in 2030 to meet the projection – representing a decline in average emissions per vehicle of 41 percent as shown in Figure 5.
Levers for Reducing Passenger Vehicle Emission Intensity
Emission reductions from passenger vehicles are projected to occur through a combination of biofuel blending, improvement in the efficiency of internal combustion engine vehicles, and the electrification of vehicles. Therefore, to understand the practical implications of the projected emissions for passenger vehicles, we model how each of these channels contributes to the overall reduction in emission intensity. Specifically, we model the evolution of the Canada-wide vehicle fleet in each year from 2018 to 2030. Our model involves assumptions for fuel blending, the annual retirement rate, average driving distance per vehicle, and efficiency improvements for new vehicles.9The assumptions were based on consultation with industry experts and government, and derived from data or targets wherever possible. We use this model to ask what assumptions are required to achieve 60 MT of GHG emissions from passenger transportation in 2030 (See Appendix A for further explanation of the model).
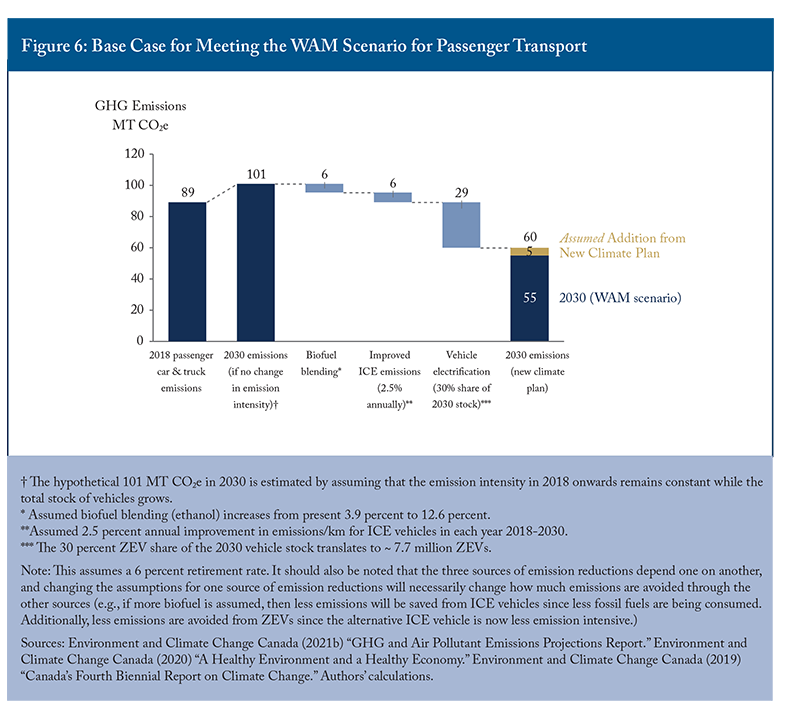
The “waterfall” in Figure 6 exhibits our modelling for a base-case scenario to achieve reductions in the transportation sector under the Strengthened Climate Plan, showing the composition of GHG reductions by component. Based on a conservative set of assumptions for efficiency improvements and biofuel blending, approximately 30 percent of the total stock of passenger vehicles in 2030 need to be zero-emission vehicles (ZEVs) to achieve the GHGs projected in the strengthened climate plan. This translates to approximately 7.7 million ZEVS on the road in 2030 and a ramp-up of ZEV rollout to around 72 percent of annual passenger vehicle sales in 2030 – which corresponds with the federal government’s recently updated mandatory ZEV sales target of 100 percent of all passenger vehicles in 2035 – with interim targets in 2025 and 2030 expected soon (Transport Canada 2021).10The federal government recently updated their mandatory 100 percent ZEV sales target by shifting the target year from 2040 to 2035. Available online at: https://www.canada.ca/en/transport-canada/news/2021/06/building-a-green-economy-government-of-canada-to-require-100-of-car-and-passenger-truck-sales-be-zero-emission-by-2035-in-canada.html
The extent of ZEV penetration required in this model depends critically on the assumptions about reductions through biofuel blending and the improvements of new vehicles with internal combustion engines (ICEs), as well as the rate of retirement from the current vehicle fleet. Under our base-case scenario, we estimate that 6 MT CO2e will be eliminated through biofuel blending, assuming the percentage of ethanol in fuel increases from 3.9 percent in 2018 to 12.6 percent in 2030;11The assumption that ethanol blending increases (on an energy basis rather than a volumetric basis) from 3.9 percent to 12.6 percent by 2030 was used by Environment and Climate Change Canada in their modelling under the WAM scenario in their fourth biennial report. Additionally, Table A2.38 in the fourth biennial report contains a list of emission factors measured in grams of CO2e per megajoule of energy. Notable fuels are listed with their respective emission factors shown in parenthesis: gasoline (71.71), diesel (71.39), ethanol (2.5), and biodiesel (5.26). It should be noted that ethanol levels of 12.6 percent are above the current blend wall of 11 percent on an energy basis. However, this is achievable considering that newer vehicles are being designed to withstand higher ratios of ethanol. For example, flex-fuel vehicles are designed to run on gasoline-ethanol blends of up to 85 percent ethanol (E85); see https://www.fueleconomy.gov/feg/flextech.shtml for additional information regarding flex-fuel vehicles. 6 MT CO2e will be reduced through the improvement in new ICE vehicles with the assumption of a 2.5 percent annual reduction in emission intensity;12The assumption that the emission intensity of new ICE vehicles will improve by 2.5 percent annually errs on the optimistic side. According to the Environmental Protection Agency, emission intensity for large auto manufacturers only increased by 3.7 percent between 2014 and 2019 in the US. See https://www.epa.gov/automotive-trends/highlights-automotive-trends-report and 29 MT CO2e of emission savings comes from ZEVs.13The 29 MT CO2e emission savings from ZEVs is calculated simultaneously with the emission reductions from emission intensity improvements through both fuel blending and the improvement of internal combustion engine vehicles – all subject to the binding constraint that emissions must equal 60 MT in 2030. Note that if one assumption changes, this will necessarily change the required emission reductions for each channel of abatement. For instance, if we assume that the emission intensity of ICE vehicles is to improve faster than our base-case scenario of 2.5 percent, then less ZEVs will be required to meet the emissions target of 60 MT in 2030. Similarly, the amount of fossil fuels and biofuels consumed will differ – although the share of biofuel to fossil fuel will remain constant. Therefore, by changing one assumption we get different values for emission reductions for all sources through the various direct and indirect effects. Another assumption is the 6 percent retirement rate that is applied to the pre-existing passenger vehicle stock annually. Using a 6 percent retirement rate translates to a 16.5-year period for the passenger vehicle stock to turnover. The previously stated assumptions pertaining to fuel blending, ICE improvements, and retirement rates, together make up our base-case scenario. The base-case assumptions for fuel blending are largely based off the anticipated effects of the clean fuel standards (Government of Canada 2020).14We estimate that 13 MT of emissions in 2030 will be avoided through biofuel blending from passenger vehicles and freight trucks combined. This corresponds closely to the cost-benefit analysis from the Regulatory Impact Analysis Statement for the Clean Fuel Standards (CFS), which estimates a reduction of 12.4 MT from CFS in 2030. The base case assumptions for ICE efficiency improvements are based on the US fuel economy standards, developed during the Obama administration (EPA 2012).15The US Fuel Economy Standards under the Obama Administration set stringent standards that would require manufacturers to reduce the emission intensity of their fleets by approximately 5 percent per year for models in 2017 and later. Since this reduction can be met through a combination of ICE improvements/hybrids, and battery electric vehicles, we simply assumed that half the reduction would come from ICE improvements which also encompasses carbon emitting hybrids.
Applying different assumptions (e.g., higher retirement rate or slower improvements in ICE efficiency) will produce a different required extent of ZEV penetration for the projected GHGs from passenger vehicles in 2030. To illustrate this, we provide a sensitivity analysis (i.e., illustrating the impact of alternative sets of assumptions) and outline several scenarios to achieve the 60 MT of emissions for passenger transportation in 2030 (See Appendix B).
Impact of How Much Canadians Drive
Decreasing emissions can broadly be accomplished in two ways: either reducing the extent of the activity that generates the emissions, or reducing the emission intensity of the activity itself. Our analysis has primarily considered reductions in emission intensity (i.e., holding assumptions about the extent of driving per capita constant) but reductions in the extent of driving – particularly by ICE vehicles – would also be a pathway to achieving the projected emissions reductions. The average annual extent of vehicle use has historically fluctuated around 16,000 kilometres driven per passenger vehicle, and this is assumed to stay constant in our analysis above (Natural Resources Canada 2021). However, rather than requiring 30 percent of the share of passenger vehicles to be ZEVs in 2030, zero additional ZEVs would be needed if kilometres per ICE vehicle were to fall by 26 percent to 11,800 kilometres driven per passenger vehicle.16This is based on the previous assumptions that biofuel blending (ethanol) increases from present 3.9 percent to 12.6 percent, and annual improvements in emissions/km for ICE vehicles increases by 2.5 percent in each year 2018-2030. In principle, emissions can be reduced through a combination of these two ways.
The trade-off between the distance travelled per ICE vehicle and the share of ZEVs required for a given level of emissions is illustrated by the “isoquants” or contour lines which represent a constant level of emissions measured in MT (Figure 7). Each level of emissions can be reached through various combinations of activity use measured in average ICE kilometres/vehicle, and the share of ZEVs in 2030. For example, the base-case scenario that achieves the 60 MT in 2030 assumes the average number of kilometres per ICE vehicle to remain at 16,000, and ZEV share to be 30 percent. However, the same 60 MT can be achieved by sliding along the 60 MT contour curve by simultaneously changing both ICE km/vehicle and the ZEV share. As the average number of kilometres per ICE vehicle increases, so does the required share of ZEVs if emissions are to remain constant. By the same principle, if ICE km/vehicle falls, so does the required share of ZEVs if emissions are held constant.

Our model for emissions assumes a constant “average” kilometres driven by ICE vehicles and also ignores the heterogeneity of vehicle use. That is, certain vehicles are driven more extensively in a given year (i.e., many cars and trucks log more than the average 16,000 km/vehicle). If more intensive drivers (i.e., who drive greater distances each year) adopt ZEVs, the average kilometres driven by ICE vehicles will fall. Such ZEV adoption by more intensive drivers would therefore result in a relatively greater reduction of GHG emissions from passenger transportation for the given fleet of ZEVs.
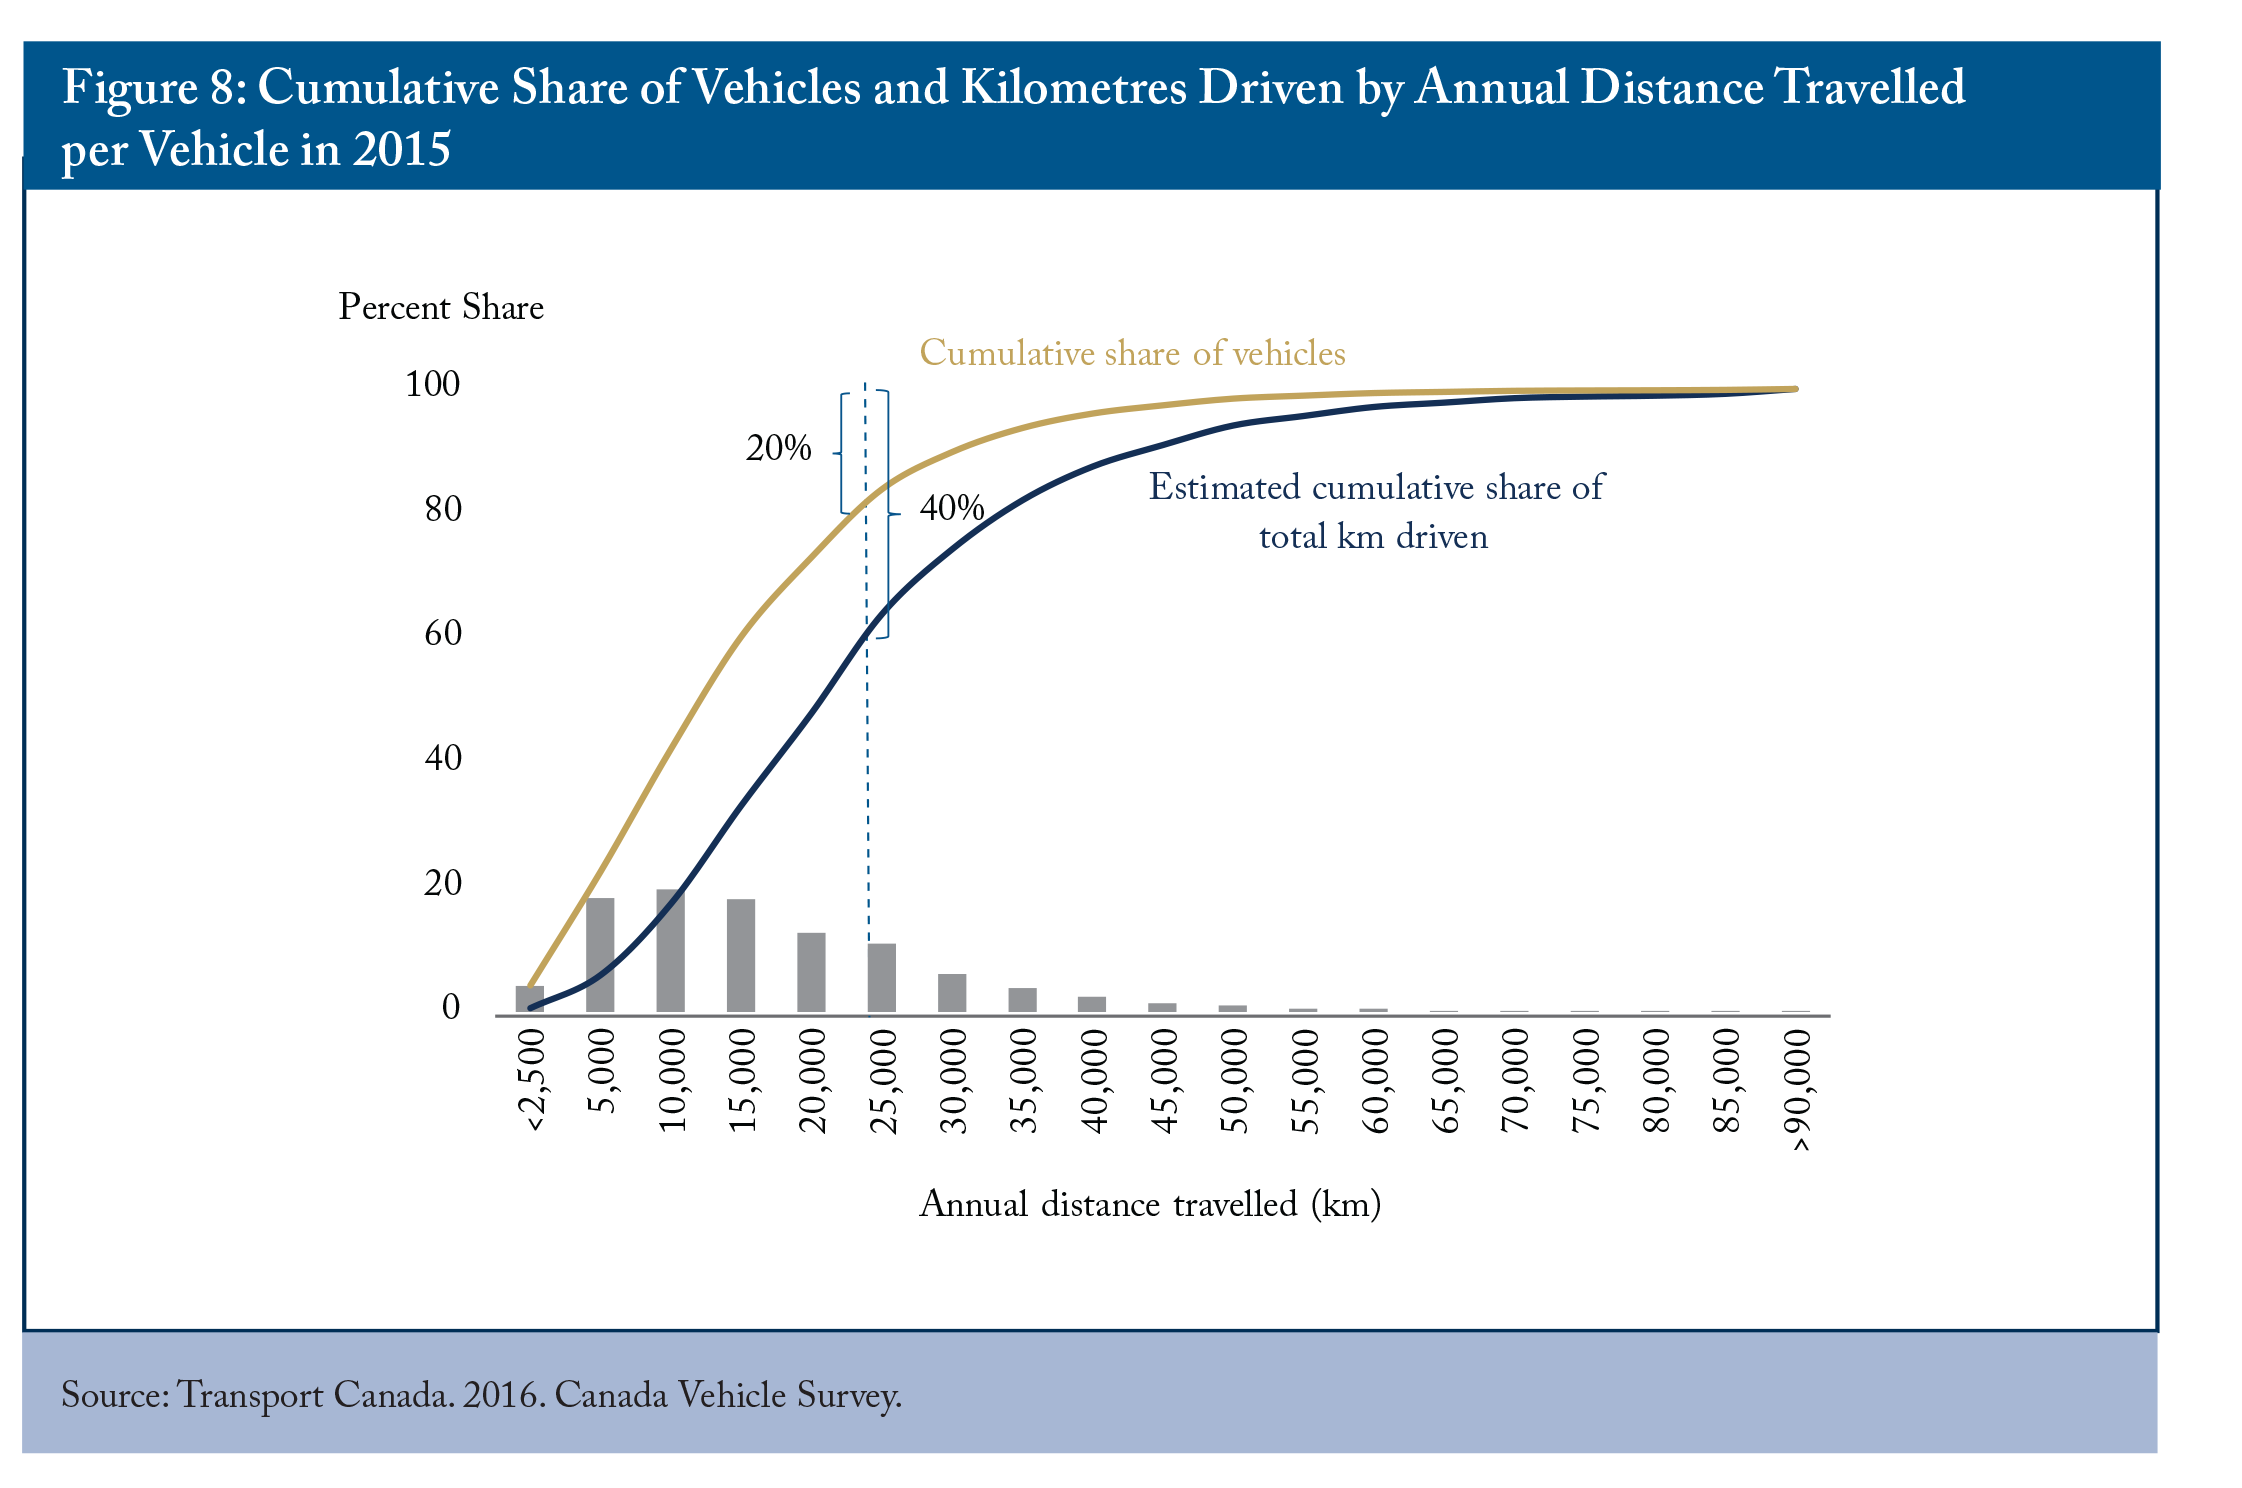
The latest Canadian vehicle survey by Transport Canada (based on data collection during 2015) provides detailed data which include an estimated distribution of kilometres driven by ICE vehicles (Transport Canada 2016).17The survey was done in five provinces: Saskatchewan, Manitoba, Ontario, Quebec, and Prince Edward Island. Although the survey does not include all provinces, it is still representative of a substantial portion of Canada’s population. Intensive drivers drive proportionally more kilometres than their share; a relatively smaller number of drivers account for a large share of total kilometres driven (Figure 8). Using the data from the five provinces, we find that approximately 20 percent of the vehicles drove just over 40 percent of total kilometres driven by all vehicles. Assuming that this 2015 survey remains representative, then considerable emissions reductions can be achieved if more intensive drivers (e.g., taxi and ride-sharing drivers) adopt ZEVs. Assessing this potential influence on emission reductions is beyond the scope of this research.
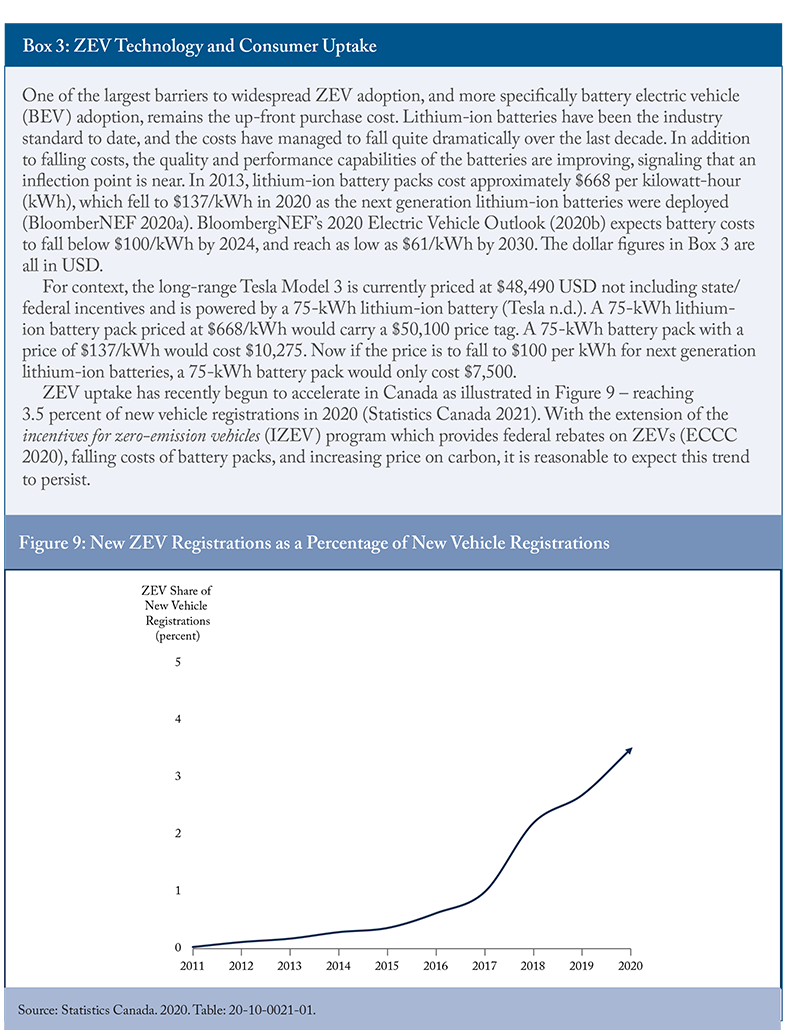
If the passenger transportation sector is going to decarbonize, ZEVs will undoubtedly play a role in this transition. Our analysis of the passenger transportation sector has made this clear, but largely ignored potential barriers to widespread ZEV adoption in the short-term. If widespread adoption is to occur by 2030, ZEVs will have to be both affordable, and available. The quicker costs fall, the more ZEVs we can expect in 2030 (Box 3).
Achieving Projected Emission Reductions for Freight Transportation
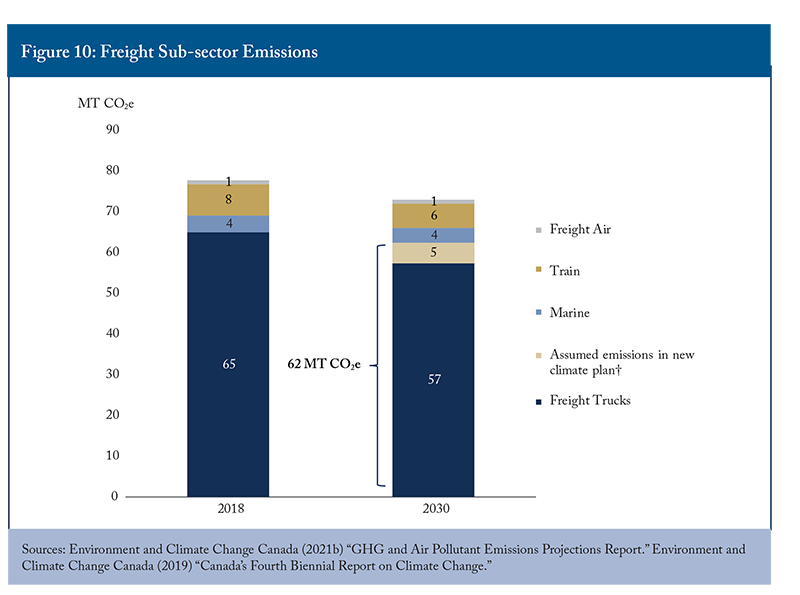
ECCC projects emissions from freight transportation to fall from 78 MT in 2018 to 73 MT in 2030 under the strengthened climate plan.18As explained in Box 1, we assume the 10 MT difference of transportation sector GHGs in 2030 between the 2019 WAM scenario and the strengthened climate plan results from higher projected emissions for passenger vehicles and freight trucking. An additional 5 MT was assumed for passenger vehicles, and the other 5 MT was assumed for freight trucking. Again, this assumption is necessary to reconcile the 2019 WAM with the strengthened climate plan because the federal government has not published detailed results for its climate plan. Figure 10 shows that the largest portion of emissions in the freight sector come from freight trucks, which include vehicles from class 2B up to class 8. Class 2B are the smallest freight trucks which have a gross vehicle weight rating of 8,501–10,000 pounds where class 8 (e.g., semi-tractor-trailer trucks) are the largest with a rating of 33,001 pounds and above.

Unlike emissions for passenger transport, emissions are projected to fall only minimally for freight transport. Emissions from freight trucks specifically are projected to fall from 65 MT in 2018 down to 62 MT in 2030.
In 2018, there was 410 billion tonne-kilometres (Tkm) driven by freight trucks (ECCC 2021b). ECCC projects this to increase to 478 billion Tkm by 2030 (ibid.).
Using ECCC’s projections for both emissions and tonne-kilometre tells us that the emission intensity for freight trucking must fall from 159 grams CO2e tonne-kilometre (g CO2e/Tkm) in 2018 down to 131 g CO2e/Tkm in 2030 – representing a decline in GHG emissions per Tkm of 18 percent as shown in Figure 11. It should be noted that similar to passenger transportation, emission reductions can also be achieved through driving less, or mode-switching. The analysis below takes ECCC’s projected tonne-kilometers in 2030 as given.

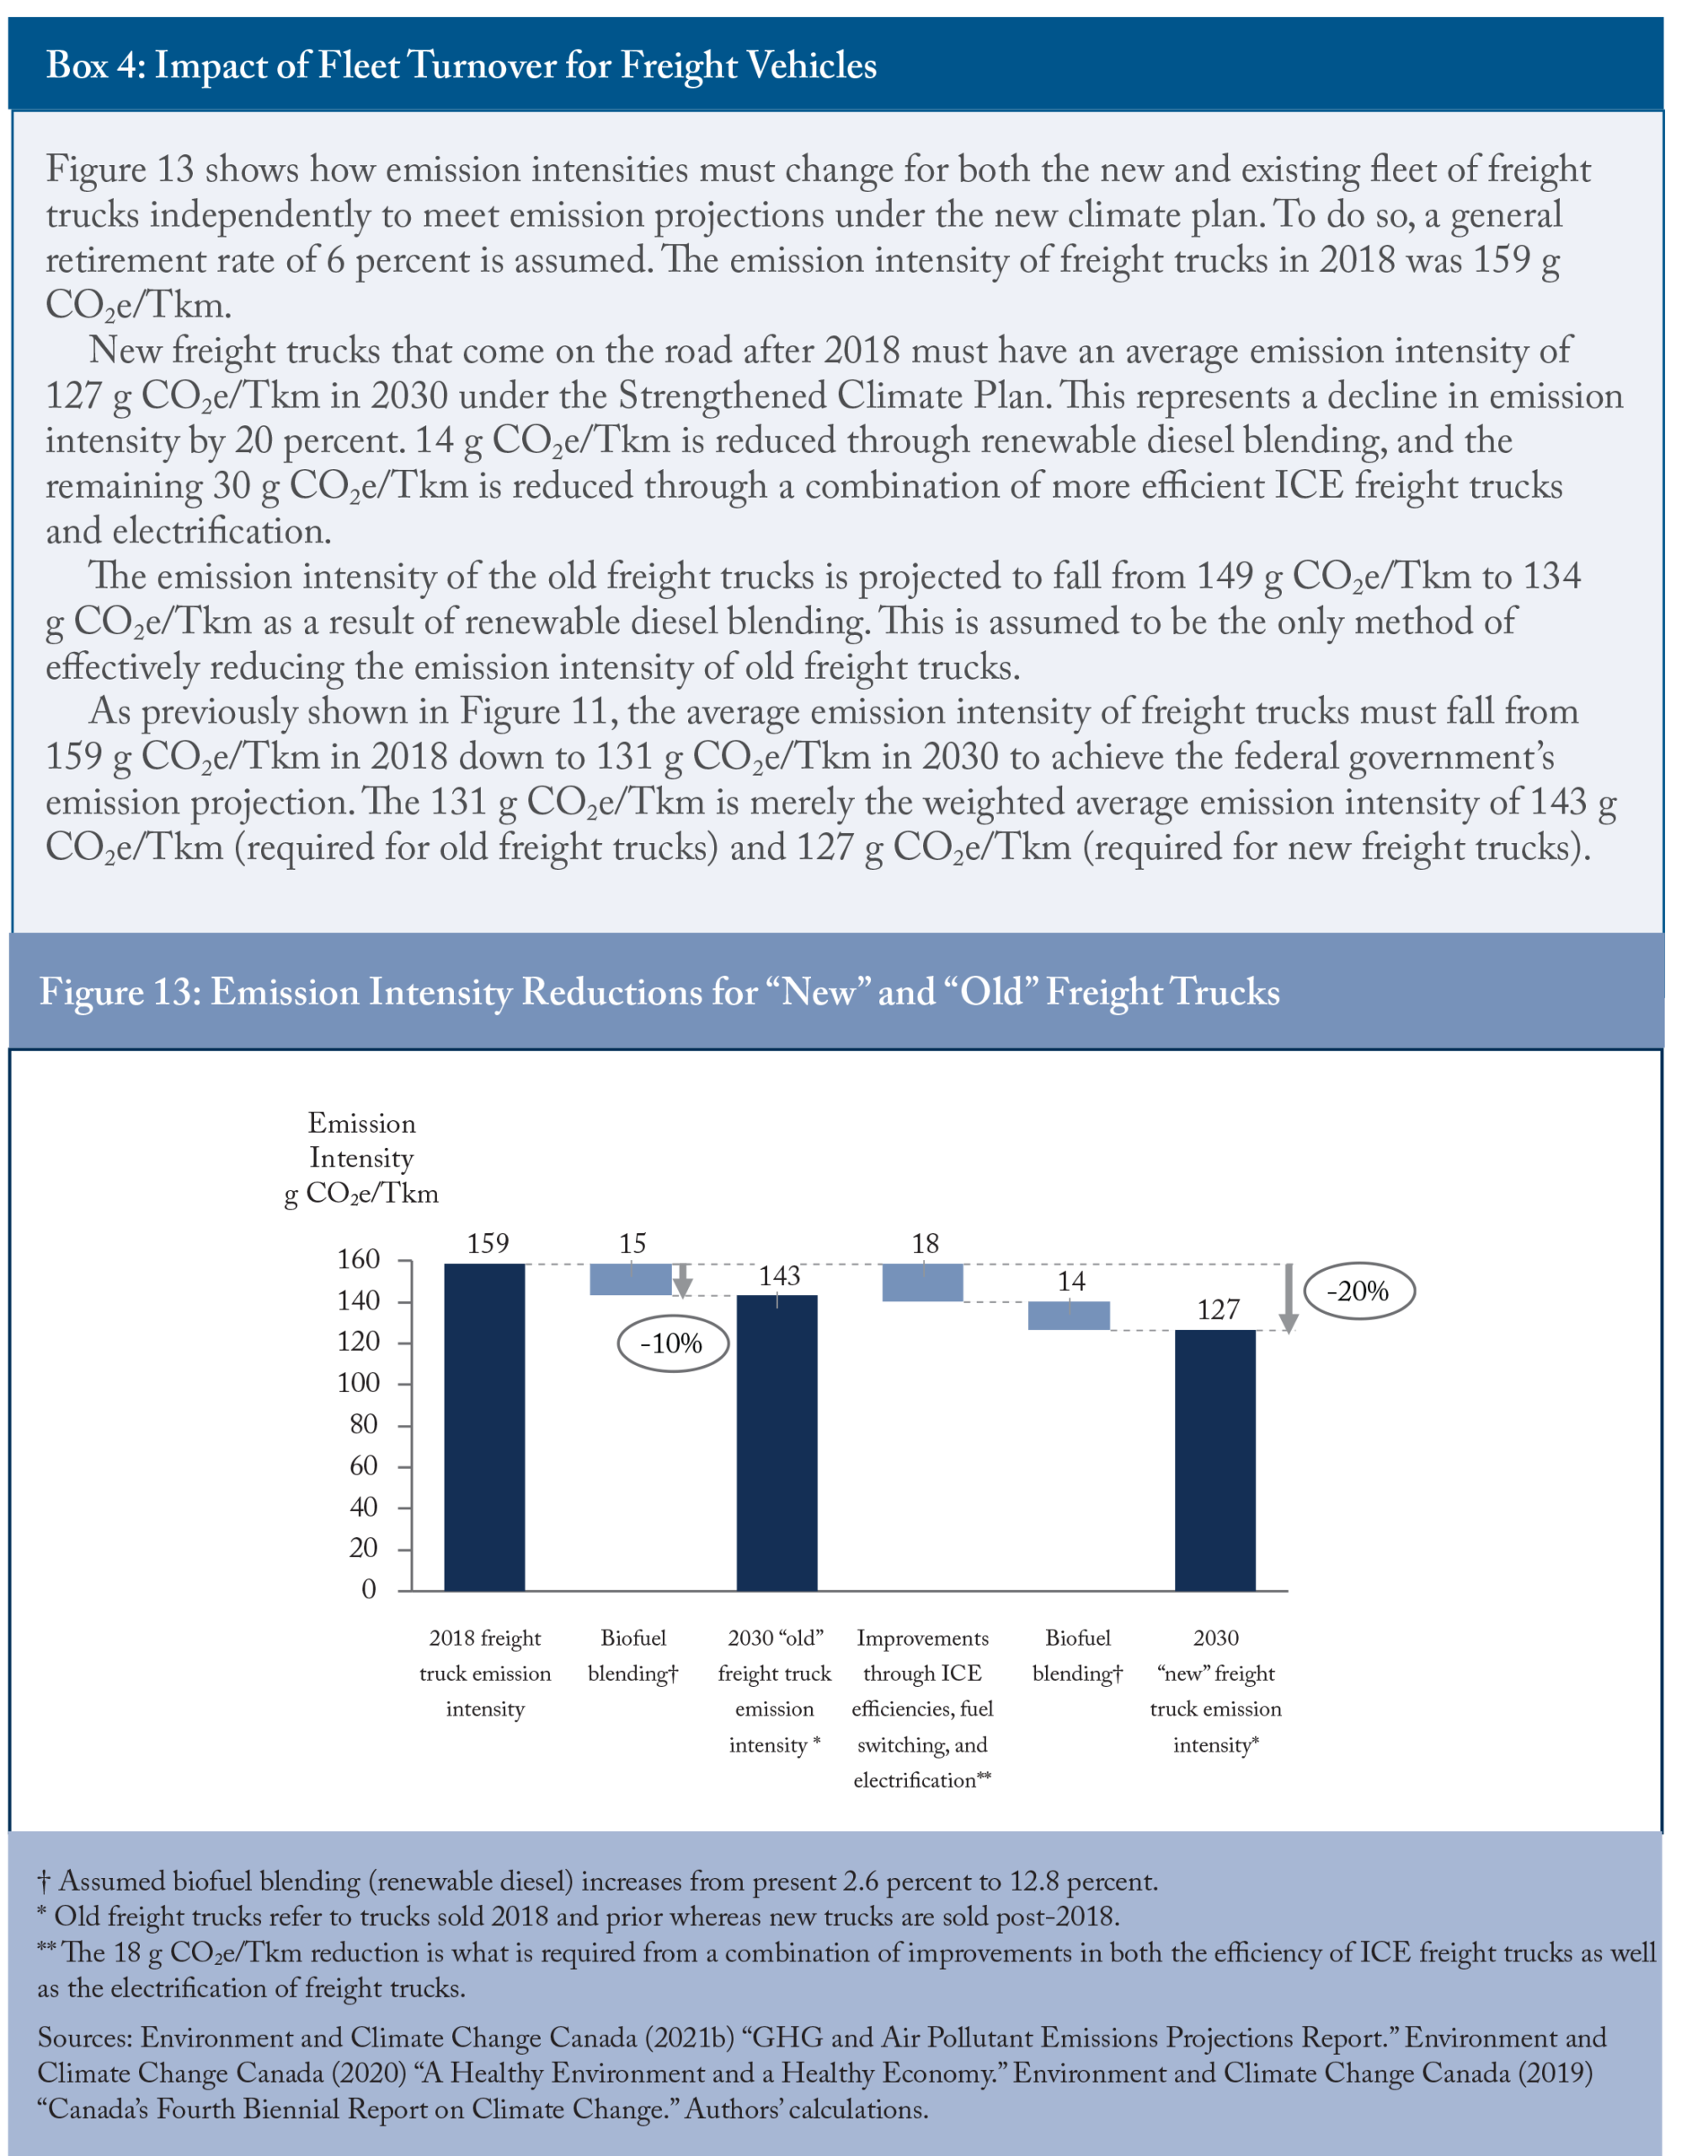
Using ECCC’s projections for emissions and tonne-kilometres, we find that approximately 14 MT will be avoided in 2030 through a combination of fuel blending, ICE efficiency improvements, fuel switching, and electrification. Approximately 7 MT is reduced by applying the fuel blending assumptions provided by ECCC where renewable diesel blending increases from 2.6 percent in 2018 to 12.8 percent in 2030 (on an energy basis rather than a volumetric basis).19The assumption that renewable diesel increases (on an energy basis rather than a volumetric basis) from 2.6 percent to 12.8 percent by 2030 was based on Environment and Climate Change Canada’s modelling under the WAM scenario in their fourth biennial report. ECCC specifically mentioned biodiesel, however, since both biodiesel and hydrogenation-derived renewable diesel come from the same feedstock, we assume both renewable diesel fuels have the same emission factor; any discrepancy, if present, would be negligible. The emission factor of biodiesel is 5.26 grams of CO2e per megajoule of energy. The remaining 7 MT reduction will then have to come from a combination of more efficient ICE freight trucks, fuel switching, and electrification.20A model of the vehicle stock (e.g., similar to that used for passenger vehicles in the previous section) would allow for more granular analysis of the channels for reducing freight emissions. However, this is beyond the scope of this paper. A breakout between how the emission intensity of old freight trucks (referring to trucks sold in 2018 and prior) and new freight trucks (referring to trucks sold post-2018) is provided by applying a 6 percent retirement rate (Box 4).
We estimate that 13 MT of emissions in 2030 will be avoided through biofuel blending from passenger vehicles and freight trucks combined.21Under the base-case scenario for passenger transportation, we estimate a 6 MT reduction in emissions from biofuel blending. Combining this with the 7 MT savings from biofuel blending for freight trucks gives 13 MT in aggregate for 2030. This corresponds closely to the cost-benefit analysis from the Regulatory Impact Analysis Statement for the Clean Fuel Standards (CFS) which estimates a reduction of 12.4 MT from CFS in 2030 (Government of Canada 2020).
Freight trucks have a variety of ways in which emission intensity reductions can be achieved which involve either current or emerging technologies (Kim and Smith 2020). Improvements can be made with existing technologies that improve aerodynamics, reduce wheel resistance, improve engine efficiency or decrease idling (North American Council for Freight Efficiency 2020). Large scale improvements, however, will likely require emerging technologies such as electric powertrains, hydrogen fuel cells, and autonomous trucking (ibid.).
Conclusion
To achieve the reduction in GHGs from Canada’s transportation sector projected in the December 2020 federal climate plan, we found that the average emission intensity of the passenger vehicle fleet must fall from 3.9 tonnes CO2e per vehicle in 2018 down to 2.3 tonnes CO2e per vehicle in 2030 – representing a 41 percent reduction in GHG emissions per vehicle. Based on assumptions of biofuel blending and 2.5 percent annual improvement of ICE efficiency, approximately 7.7 million zero-emission passenger vehicles would need to be on the road in 2030 to achieve the projected reduction under the federal climate plan – equivalent to a 30 percent share of the total vehicle stock in 2030 and corresponding to a ramp-up to approximately 72 percent of sales of new passenger vehicles. If consumers continue to purchase larger passenger light trucks over smaller vehicles, then even greater ZEV penetration will be required to meet ECCC’s emissions projection. Alternatively, the analysis found that decreasing the average vehicle kilometers travelled from 16,000 to 11,800 would reduce GHGs without requiring additional ZEVs by 2030.
To meet the projection in the federal climate plan, the average fleet emission intensity of freight trucks would need to decrease by 18 percent from 159 grams of CO2e per tonne-kilometre in 2018 to 131 grams of CO2e per tonne-kilometre in 2030. For freight transportation, biofuel blending will play a significant role, but improvements to new ICE trucks and/or significant vehicle electrification will be necessary to achieve the emissions projection. Alternatively, lowering GHGs by reducing total kilometers driven by freight trucks is another option.
Appendix A
Description of our Stock-Flow Model for Passenger Vehicle Emissions
The Canada-wide passenger vehicle emissions model uses data from both Environment and Climate Change Canada (ECCC) and Natural Resources Canada (NRCAN) as input. The model forecasts the passenger vehicle stock by using ECCC’s population projection as the sole driver (ECCC 2021b). The data for the existing vehicle stock come from NRCAN’s Comprehensive Energy-Use Database (NRCAN 2021). Emissions data also come from ECCC. The following input assumptions are then made which include the following: the retirement rate(s), biofuel blending, average kilometres driven by ICE vehicles, growth rate in the annual ZEV sales.
The model applies stock and flow principles in which new vehicles are sold each year, and a portion of vehicles retire each year. The model separates vehicles into their respective cohorts based on vintage. New vehicles which enter into use after 2018 are assigned to a cohort based on the year the vehicle was sold. Each cohort will then have its own emission intensity based on the composition of the cohort (i.e., share of ZEVs vs ICE vehicles and the emission intensity of the ICE vehicles in that specific cohort). The existing or “old” vehicle stock (i.e., vehicles sold in 2018 and prior) represent one large cohort which is comprised of vehicles from a wide range of vintages.
Vehicles generally retire at a non-linear rate which increases with time. For this reason, we used a different retirement schedule for the new cohorts and the existing vehicle stock or “old” cohort. We assume that new vehicles have a retirement rate which starts at 0.5 percent. This then ramps slowly until reaching 2 percent by year five. The rate then begins to ramp quicker reaching 10 percent by year 10 at which point it stops ramping. For the existing or “old” vehicle stock (i.e., vehicles sold in 2018 and prior), a constant retirement rate is applied each year. A constant retirement rate for this cohort is based on the notion that the existing stock contains vehicles from a wide range of vintages – where new vehicles depreciate slower than older vehicles – but on average we expect the mixed stock to deplete at a constant linear rate. The retirement rates are applied in a way which resembles a simple interest method – not a compounding one. This means the retirement rate is applied to the initial stock of the cohort rather than the stock in the previous year.
When using the model to estimate emission reductions by source (e.g., the waterfall in Figure 5), it is imperative to understand that changing one assumption will necessarily change the emission reductions for each source; this includes emission reductions for fuel blending, ICE improvements, and ZEVs. That is, the emission reductions for each variable is dependent on the others. For instance, if we assume that the emission intensity of ICE vehicles is to improve faster than our base-case scenario that assumes 2.5 percent, then less ZEVs will be required to meet the emissions target of 60 MT in 2030. Similarly, the amount of fossil fuels and biofuels consumed will differ – although the share of biofuels to fossil fuels will remain constant. Therefore, by changing one assumption we then get different values for emission reductions for all sources through the various direct and indirect effects.
Appendix B
Sensitivity Analysis for Passenger Vehicle Emissions
Modifying assumptions – particularly those for biofuel blending, ICE efficiency improvements and retirements – will change the extent to which ZEV penetration is required to meet the projected GHGs for passenger vehicles in 2030. Recall that the base-case scenario assumes biofuel blending to increase from 3.9 percent in 2018 up to 12.6 percent in 2030, the annual retirement rate for old stock vehicles is 6 percent, and the emission intensity of new ICE vehicles improves by 2.5 percent each year.
For example, if biofuel blending is less than 12.6 percent, then more ZEVs are needed. If the emission intensity of ICE vehicles improves slower than 2.5 percent annually, then more ZEVs are needed. If the retirement rate of vehicles is higher than 6 percent, then fewer ZEVs are needed to meet the same emissions level since the vehicles which are older and less efficient are being replaced at a faster rate.
Figure A1 shows how changing the retirement rate from 6 percent to 8 percent changes the age composition of the vehicle stock in 2030. Under a 6 percent retirement rate, approximately 6.4 million vehicles on the road in 2030 are old-stock vehicles (i.e., sold prior to 2018). Under an 8 percent retirement rate, approximately 0.9 million old-stock vehicles remain on the road in 2030.
The required ZEV share of the 2030 vehicle stock – subject to the binding constraint that emissions for passenger vehicles must be 60 MT in 2030 – changes with the underlying assumptions. A sensitivity analysis is shown in Figure A2 which adjusts both the retirement rate and the rate at which the emission intensity of new ICE vehicles improves at – while holding emissions constant at 60 MT in 2030. The sensitivity analysis estimates what the share of ZEVs as a percentage of total vehicle stock must be in 2030 under four scenarios. Both increasing the retirement rate and the rate at which the emission intensity of ICE vehicles improves at, leads to reductions in the required share of ZEVs in 2030; the inverse is also true. Recall that the base-case scenario assumes a 6 percent retirement rate and 2.5 percent annual reduction in emission intensity of ICE vehicles.
We also consider how ZEV sales will have to ramp up between now and 2030 under the same four scenarios while holding emissions constant at 60 MT in 2030. Assuming a linear growth path in ZEV sales, Figure A3 illustrates the required path for passenger vehicle sales path under alternative scenarios to meet the 60 MT of emissions for passenger vehicles under the Strengthened Climate Plan. Under the base case scenario, annual ZEV sales as a share of passenger vehicles would have to rise to approximately 72 percent by 2030. A lower retirement rate or a lower rate at which the emission intensity of ICE vehicles improves annually would mean higher required ZEV sales to achieve the target; the converse is also true.
References
BloomberNEF. 2020a. “Battery Pack Prices Cited Below $100/kWh for the First Time in 2020, While Market Average Sits at $137/kWh.” Available online at: https://about.bnef.com/blog/battery-pack-prices-cited-below-100-kwh-for-the-first-time-in-2020-while-market-average-sits-at-137-kwh/
BloombergNEF. 2020b. “Electric Vehicle Outlook 2020.” Available online at: https://about.bnef.com/electric-vehicle-outlook/
Environment and Climate Change Canada. 2019. “Canada’s Fourth Biennial Report on Climate Change.”
_____________. 2020. “A Healthy Environment and a Healthy Economy.”
_____________. 2021a. “Canada's Official Greenhouse Gas Inventory.”
_____________. 2021b. “GHG and Air Pollutant Emissions Projections Report.”
Government of Canada. 2020. Canada Gazette, Part I, Volume 154, Number 51: Clean Fuel Regulations. Available online at: http://gazette.gc.ca/rp-pr/p1/2020/2020-12-19/html/reg2-eng.html
Kim, Carolyn, Cedric Smith. 2020. “Building a zero-emission goods-movement system – Opportunities to strengthen Canada’s ZEV freight sector.” Available online at: https://www.pembina.org/pub/building-zero-emission-goods-movement-system
Natural Resources Canada. 2021. Comprehensive Energy Use Data Base. Available online: https://oee.nrcan.gc.ca/corporate/statistics/neud/dpa/menus/trends/comprehensive_tables/list.cfm
North American Council for Freight Efficiency. 2020. “Current Technologies and Emerging Technologies.” Available online at: https://nacfe.org
Statistics Canada. 2021. Table: 20-10-0021-01.
Tesla. n.d. Available online: https://www.tesla.com/en_ca/model3/design#battery
Transport Canada. 2016. “Canadian Vehicle Survey.”
Transport Canada. 2021. “Building a green economy: Government of Canada to require 100% of car and passenger truck sales be zero-emission by 2035 in Canada.” Available online at: https://www.canada.ca/en/transport-canada/news/2021/06/building-a-green-economy-government-of-canada-to-require-100-of-car-and-passenger-truck-sales-be-zero-emission-by-2035-in-canada.html
United States Environmental Protection Agency. 2012. “Final Rule for Model Year 2017 and Later Light-Duty Vehicle Greenhouse Gas Emissions and Corporate Average Fuel Economy Standards.”
United States Environmental Protection Agency. 2021. “The 2020 Automotive Trends Report.” Available online at: https://www.epa.gov/automotive-trends
The authors thank Charles DeLand, Benjamin Dachis, Jeremy Kronick, Ben Brunnen, Dave Collyer, Robby Sohi on behalf of OPG, Jennifer Winter and anonymous reviewers for comments on an earlier draft. The authors retain responsibility for any errors and the views expressed.