


- This report marks the return of the Signposts of Success series after more than a decade. Building on earlier editions (2005, 2007, 2012), it provides an updated, evidence-based analysis of Ontario elementary school test-score results using three years of recent data. Unlike other rankings, Signposts adjusts for student socioeconomic backgrounds and avoids simplistic scoring, offering a fairer measure of school effectiveness.
- Socioeconomic background matters but does not fully determine outcomes. Many schools outperform expectations, showing that effective practices can raise student achievement in both literacy and math across diverse communities. Social and economic status factors explain more of the variation in math outcomes than in literacy, and the predictors of success shift between Grade 3 and Grade 6.
- System and board structures influence results. Catholic and French-language schools systematically achieve better outcomes than public schools, particularly in literacy, while Grade 6 transitions to middle school weaken performance. At the board level, several French-language, Catholic, and select public boards consistently produce higher results, highlighting the role of board-level practices.
1. Introduction
First launched two decades ago, the Signposts of Success series (2005, 2007, 2012), a C.D. Howe Institute initiative that interprets Ontario elementary school test scores, returns after a 13-year absence with a new analysis of Ontario school-level results. This latest assessment is based on standardized tests of elementary school students: the Grade 3 assessment (the Primary Assessment) and the Grade 6 assessment (the Junior Assessment), administered annually by the Education Quality and Accountability Office (EQAO). These annual province-wide evaluations, introduced in the 1996/97 school year (with a temporary pause during the COVID-19 pandemic), measure elementary school student achievement in reading, writing, and mathematics.
EQAO publishes school-level and provincial results each year, providing parents, educators, and policymakers with a measure of student performance across Ontario. Parents and teachers receive results for their children and their students. As in earlier editions of Signposts of Success, this Commentary adds value by measuring student success at the school level, combining three years of results ending in 2023/24. The accompanying Social and Economic Status (SES) variables describing the students attending each school enable meaningful comparisons among schools serving students from similar socioeconomic backgrounds. Comparing schools where students from similar backgrounds have very different EQAO success means that it is possible to discover what factors at the schools with better results lead to their success.
An additional advantage of the Signposts analysis is the presentation of results separately for literacy and mathematics. Concern has been expressed in various ways (Richards 2025) that mathematics knowledge in Canada and Ontario has been declining. If we can identify elementary schools that are exceptional at teaching mathematics, according to the Grade 3 and Grade 6 assessments, their practices can be investigated and perhaps emulated.
The analysis in this Commentary yields five key findings. First, it is possible to have high EQAO results at schools where students come from disadvantaged backgrounds. There are also schools where students come from high socio-economic status families, and their EQAO results are better than those of other schools where students have similarly high socio-economic status families. These are schools where the staff are doing a superlative job, and they deserve recognition for their exceptional performance.
Second, the analysis shows that the method of the adjustments for SES indicators of students are important. The factors that predict EQAO outcomes differ between literacy and math, and between Grade 3 and Grade 6 outcomes, highlighting the importance of tailored SES adjustments.
Third, school transitions affect performance. Students who move to a middle school in Grade 6 – leaving their junior school after Grade 5 – perform significantly worse on the Grade 6 assessment than other students, suggesting that this transition presents a substantial academic challenge at least in the short run.
Fourth, students enrolled in Ontario’s separate schools (Catholic schools) and Ontario’s French-language schools (the majority of which are also separate schools) have systematically better results than students enrolled in Ontario’s public schools.
Fifth, in investigating school performance at boards with more than 30 schools, it becomes clear that some boards have higher EQAO results than others. In particular, the three large French-language boards, two of which are also Catholic, have notable high results.
In 2005, the same year the Signposts project started, the Fraser Institute began using EQAO Grade 3 and Grade 6 results to produce an annual ranking of Ontario elementary schools. In my opinion, the Signposts methodology offers a more accurate, equitable, and evidence-based alternative to school rankings like those published yearly by the Fraser Institute. Unlike the Fraser approach, Signposts considers differences in student backgrounds and avoids simplistic scoring that can misrepresent school effectiveness.
2. Defining and Measuring School Success
One goal is to measure the influence of SES indicators on EQAO results in order to make these results as useful as possible in assessing a school’s success. There are three separate steps: selecting the measure of success at the schools, identifying SES indicators, and then presenting the findings in a way that makes the interpretation of more complex results accessible and fair. The last step is addressed in Section 3.
2.1 Establishing the Measure of Success
School success in this study is measured based on the school’s EQAO pass rate. According to the Ministry of Education, a Level 3 score indicates a student has met the provincial standard by demonstrating the required knowledge and skills with considerable effectiveness, while a Level 4 score means the student exceeded that standard.
There are six EQAO assessments considered: reading, writing, and mathematics at both the Grade 3 and Grade 6 levels. The pass rate for each school is calculated as the percentage of all students in the relevant grade (not just those fully participating in the assessment process) who achieved either Level 3 or Level 4 for each subject over the academic years 2021/22, 2022/23, and 2023/24. Using the total number of students means that absent students or exempt students are, in a sense, treated as students who do not pass.
An alternative measurement would calculate the pass rate, not as a percentage of all students, but as a percentage of what the EQAO terms “fully participating” students.11 The results are not sensitive to using the second definition of the pass rate. The advantage of measuring the pass rate using all students is that all students matter. There is some chance that if a school wanted to change its pass rate calculated as the percentage of fully participating students, the staff at the school could find a way to exempt students who likely would not have passed the assessment or to encourage students who would not do well to be absent. But this would raise the school’s pass rate expressed as a percentage of participating students in an artificial way.2There have been no obvious patterns in the data that suggest schools discourage students who would fail from participating in the assessments. However, this is a practice frequently suggested as an issue, and excessive emphasis on the pass rate of participating students would encourage such a strategy. In addition, it might be expected that non-participation and exemption rates are partly a product of the students’ socioeconomic backgrounds. This is another argument for calculating pass rates as a percentage of all students, where the central interest is in how a school advances students, conditional on their background.
A very important feature of the Signposts methodology is constructing school pass rates over the three-year period: 2021/22, 2022/23, and 2023/24. At a small school, annual pass rates are constructed with small numbers of students and can fluctuate a great deal from year to year. These can be misleading measures of school success. At all schools, the three-year measure uses a larger group of students and is a more accurate signpost of school performance.
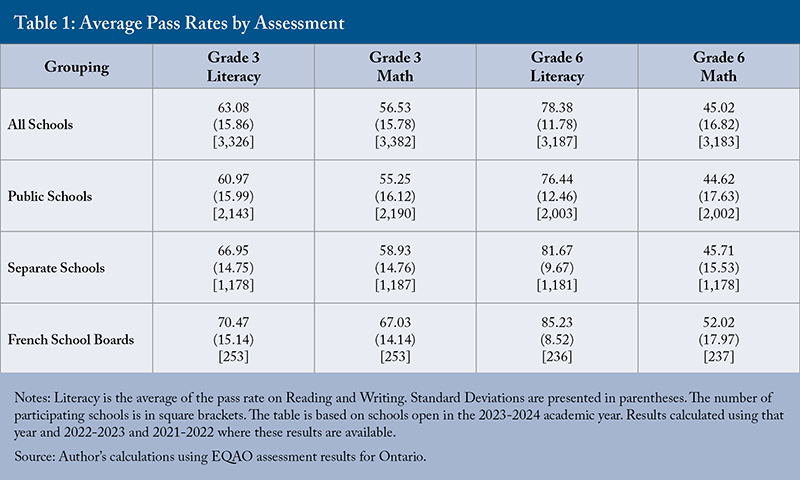
Table 1 presents the average pass rates and their standard deviations with school-level observations. The literacy pass rate at a school is the average of the pass rates on the reading assessments and the writing assessments. Pass rates on reading and writing are very similar, and it makes sense to group these assessments together.
Table 1 shows several patterns. First, the average pass rate varies a lot by subject. Second, separate schools have higher average pass rates than public schools in every assessment. Third, the French-language schools in Ontario have even higher pass rates than the separate schools. Most French-language schools, 234 of 302 schools, are also separate schools (many of these schools are too small to report EQAO results). Finally, the standard deviations – shown in parentheses – highlight substantial variation across schools. For example, in Grade 3 literacy, roughly 68 percent of schools have pass rates falling within the range from 47.22 to 78.94. This indicates that a school with a 70-percent pass rate is not exceptionally different from one with a pass rate of 63.08 percent (the average) – such differences are quite common and partly reflect underlying differences in SES characteristics among student populations.
2.2 SES Characteristics of Schools
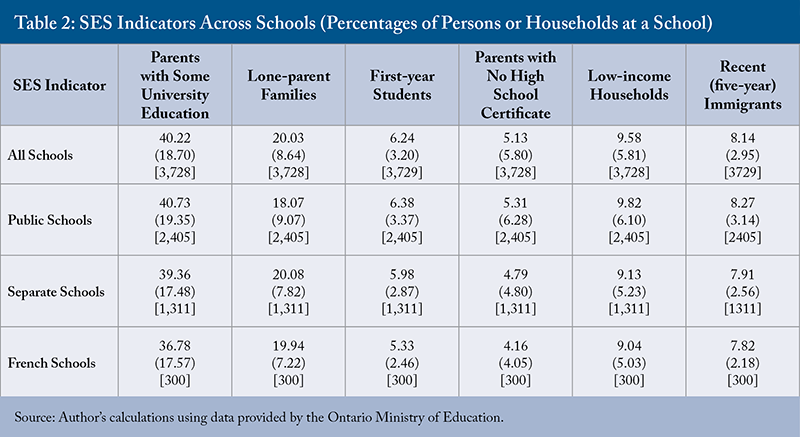
One explanation for large variations in school pass rates is that schools serve students from very different societal groups. Table 2 summarizes the school-level SES indicators (their means and standard deviations) used in this analysis. These data are provided by the Ministry of Education, covering all students in a school (see Appendix 1 for more details). The indicators used in this analysis, in rough order of importance to the analysis, are:33 These variables are provided by the Ministry of Education. The ministry, following the methodology first developed in Johnson (2005), uses the location of student homes as identified by postal code to place students within census Dissemination Areas (DAs). Strictly speaking, these variables describe the characteristics of persons or households within the DAs that send students to the school. The term “parents” is a convenient shorthand for adults aged 15 and over in the DA, as applied in the two education variables used in this study. In Statistics Canada censuses, it is only possible to isolate households with elementary-aged children and create the DA variables using only those households. This exercise was carried out within Statistics Canada data for earlier versions of Signposts and showed similar results.
- percentage of parents at a school with some university education;
- percentage of lone-parent households;
- percentage of parents who have not completed high school;
- percentage of students living in low-income households (defined as below 50 percent of the median after-tax income, adjusted for household size, a commonly used measure of poverty at a school);
- percentage of students who immigrated to Canada in the past five years;44 The immigration variable provided within the census is the percentage of persons within the DA who immigrated to Canada in the past five years. The EQAO data allows the construction of a slightly more precise immigration variable, i.e., the percentage of students writing each assessment who immigrated to Canada in the past four years and do not speak the language of instruction at the school. The coefficients and explanatory power of the Statistics Canada and EQAO immigration variables are similar. However, the EQAO variable is suppressed for about 100 schools with small enrolments and fewer participating students. Using the EQAO variable would exclude these schools, so the decision was made to use the Statistics Canada variable to measure the presence of recent immigrants at schools. and,
- percentage of students participating in the assessment in the school for the first year.
Table 2 shows that schools vary widely in their SES characteristics, with a large standa55 This is a variable created directly from EQAO data and not indirectly from Statistics Canada data.rd deviation for each variable relative to its mean. This occurs because people tend to live in neighbourhoods with others who share similar socioeconomic backgrounds. For example, individuals with higher levels of education are more likely to live in neighbourhoods with others of similar education levels. As a result, students attending the same school often come from households with similar characteristics and, therefore, the SES profiles can vary widely across schools. In every city, it is usually easy to identify schools where children come from more affluent families and those that have higher concentrations of low-income households or immigrants. Table 2 also shows that SES characteristics are similar across the three groupings of schools – public, separate, and French.
Among the six variables above, there are two relatively close relationships. Schools with a larger percentage of lone parents are also schools with a large percentage of households in low-income status. And the schools with a large percentage of recent immigrants are also schools where a large percentage of students have been at the school for only one year.
2.3 Regression Analysis of School Results
This analysis uses linear regression models to examine how combinations of socioeconomic status variables predict school performance on EQAO assessments. These results are discussed further in the next section and in Appendices 1 and 2.
By estimating the average relationship between SES indicators and pass rates, the results show that schools with higher SES tend to have higher pass rates, reflecting the influence of students’ family backgrounds. Yet, there is significant variation among schools with similar SES profiles. Some perform notably better or worse than predicted, indicating that factors beyond socioeconomic context also affect student success. Measuring school effectiveness by how far results deviate from expected performance based on SES provides a more accurate and equitable assessment of school quality.
This approach highlights a central problem with basic ranking methods, such as the Fraser Institute’s Report Card. A school may have a high EQAO result simply because its student body comes from families with SES characteristics that predict better performance. The shortcomings of the Fraser Institute method – and the advantages of the Signposts methodology – are discussed in more detail in Box 1.
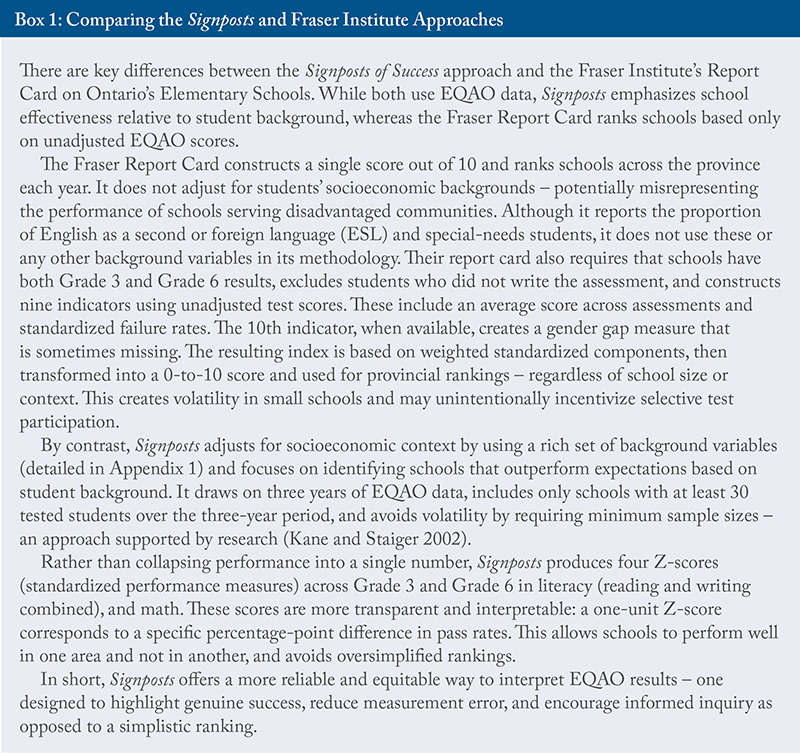
The regressions recognize that educational outcomes are a joint product of the school system and students’ families. Ignoring the role of family background and ranking schools solely on unadjusted results misrepresents schools serving disadvantaged communities and risks drawing incorrect conclusions about teaching quality or educational practices. The Signposts methodology addresses this by adjusting for a rich set of SES variables, focusing on performance relative to expectations, and using up to four standardized performance measures rather than a single composite score.
3. Interpreting School Z-scores
While the basic concept of the Signposts methodology appears straightforward, applying it requires careful attention to the complexities of school-level data and the multiple socioeconomic factors at play. Schools differ in size, structure, and composition of their student populations, and there is more than one SES indicator.
Signposts draws on results from six EQAO assessments: two in mathematics and four in literacy. The Grade 3 and Grade 6 reading and writing assessments are joined as one literacy assessment. The Signposts table, available in the author’s supplementary Excel file, reflects some of those complications and can be used by boards, schools, and parents to better understand a school’s strengths and weaknesses.
Among the SES measures used, two are particularly important: the percentage of parents with some university education and the percentage of lone-parent households. Schools with a high percentage of university-educated parents and a low percentage of lone-parent households typically serve students with significant socioeconomic advantages – advantages that are powerful predictors of EQAO pass rates. These variables appear in the Signposts table to help readers develop a clearer picture of each school.
Some schools are not included in the analysis due to small student populations – the EQAO does not publish results for grades with fewer than 10 students in a given year.66 Few schools listed in the table opened in 2023/24. The ministry data only describe schools open in 2022/23. There are pass rates for new schools if they have 30 students in a grade, but no Z-scores. Even with 10 students in a year, one student moving from passing to not passing moves the annual pass rate by 10 percentage points. (If there were 100 students at a school, one student moving from passing to not passing moves the pass rate by just one percentage point.) Clearly, annual pass rates constructed with small numbers of students are inaccurate measures of success. To improve statistical reliability, the analysis presented below includes only schools with at least 30 students over the three years (a few large enough schools are open for only two years).
In addition, not all schools include both Grade 3 and Grade 6. Some schools serve only up to Grade 3 for various reasons. There are also middle schools that start at Grade 6. As a result, these Grade 6 students are new to their school, making responsibility for student outcomes shared with the unknown feeder schools.77 The data in Ontario do not allow for tracking of individual students through schools. As we shall see, and as is well known (Johnson 2012), middle schools put students at an academic disadvantage both immediately and later in high school. These middle schools are flagged in the data, and we return to further analysis later.
In the Signposts table, each available EQAO pass rate is paired with a Z-score – a standardized performance score showing how much a school over- or under-performed in that assessment compared to schools with similar SES characteristics. As shown in Appendix 1, the Z-score is essentially the difference between the school’s actual pass rate and the pass rate predicted by the school’s SES characteristics. Scores generally range from about -3 to +3, rounded to one decimal place.
- A Z-score of 0 means the school is performing exactly as expected for its SES profile.
- A Z-score of +2 indicates performance two standard deviations above expectations – an outcome that occurs only about 2.35 percent of the time and is, therefore, statistically exceptional.
- High positive Z-scores point to schools that are substantially outperforming their peers with similar SES characteristics.
Many schools have Z-scores clustered near zero, reflecting typical performance. That is because many schools are “average.”88 Of 3,318 elementary schools with a Z-score in Grade 3 literacy, 157 have a Z-score of zero, which is both the average and the median Z-score. A Z-score of 0 is the median or most common score. There is no real statistical distinction between schools with Z-scores at 0, 0.2, and -0.2. They are all “average” schools. But the movement of a Z-score from -1 to +1 is of both statistical and practical significance. This movement represents a large increase in the pass rate when comparing schools with similar SES characteristics. As shown in Table 3, a two-standard-deviation change in Grade 3 literacy – a movement from a school with a Z-score of -1 to +1 – equates to a nearly 27-percentage-point change in the pass rate (two times 13.49) – meaning 27 more students out of 100 pass the assessment at the school with a Z-score of +1 than at the -1 school.
Why use the Z-score? This measurement allows a consistent comparison across our schools in the four sets of results: literacy and numeracy in Grade 3 and literacy and numeracy in Grade 6. The one-unit change in the Z-score represents the same (in a statistical sense) improvement in performance across schools and assessments.
To make the concept more intuitive, imagine rainfall: in a desert, a Z-score of 2 for rainfall in a day might mean 5 millimetres, while in a BC rainforest it might mean 3 centimetres. In the different settings, what constitutes a rainy day is completely different, but a Z-score of 2 would identify both days as rainy relative to the norm in each setting.
Further, small differences in Z-scores are not significant, but large disparities reveal differences in schools beyond the normal variation range.
Table 3 presents the changes in pass rates for the different assessments represented by a one-unit change in a school’s Z-score. These are large values, that is, a one-unit change in a Z-score is a meaningful increase in student success. Specifically, the pass rate increases by 9.11 percentage points in the Grade 6 literacy assessment and by 13.49 percentage points in the Grade 3 literacy assessment.
SES predictors vary by grade and subject. The SES factors predicting school-level pass rates in Grade 3 are:
- percentage of lone parents;
- percentage of parents with some university education;
- percentage of parents without any educational qualifications (less than high-school education);
- percentage of low-income households; and
- percentage of students who are new to the school in the current year.
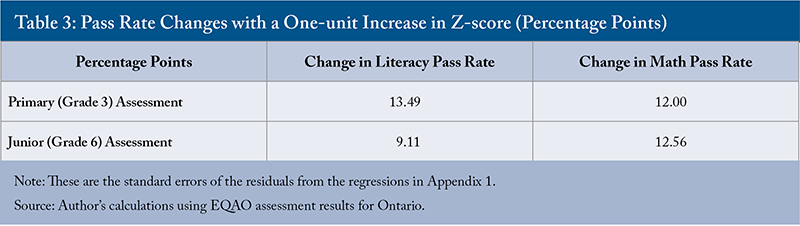
There are notable differences in the predictions of pass rates between literacy and mathematics. Overall, the SES factors explain more variation in math pass rates (about 40 percent) than in literacy (about 27 percent). In Grade 3 literacy, results are more widely scattered around the prediction line, suggesting that schools may be more successful at mitigating SES disadvantages in literacy than in math. One potentially encouraging interpretation of these results – where the value of 13.49 represents a one-unit change in Z-score – is that the school system overall may do a fairly good job of mitigating SES disadvantages when it comes to teaching literacy by the end of Grade 3. But the change in the pass rate for a one-unit change in the Z-score is slightly lower (12.0) in the Grade 3 mathematics results, and, as already noted, the association of SES factors and mathematics results is higher. This implies that the school system is less effective at overcoming disadvantages from a student’s home setting in teaching mathematics. This result is worthy of further exploration.99 One controversial explanation is that elementary teachers are not fully comfortable teaching mathematics, and some may not even have the knowledge to undertake the task. If true, this would be consistent with the finding that teachers play a reduced role relative to home inputs in mathematics success. In December 2023, a court decision upheld a provincial requirement that would require new elementary teachers to pass a mathematics test administered by the EQAO. In April 2023, the EFTO wrote that teachers: “…will have to contend with the fallout of the introduction of the new Mathematics curriculum during the pandemic in 2020. It was rolled out without effective professional learning for teachers, nor the resources to support student success and curricular understanding.” One could argue that this statement implicitly suggests elementary teachers do not have mastery of the elementary mathematics curriculum without additional training. The Ministry of Education agrees with the need for more resources aimed at improving teacher skills in teaching mathematics. If we knew which schools received extra resources, we could measure whether these resources affected pass rates.
In Grade 6, the set of predictive SES variables changes. The percentage of parents with no educational qualifications and the share of students who are new to the school that year no longer have predictive power for Grade 6 results. Instead, a new and highly significant predictor emerges: the percentage of immigrants at the school who have been in Canada fewer than five years.1010 There is an alternative measure of immigration’s role. The EQAO reveals, for almost all schools, the number of students in the assessed group who came from another country and do not speak the language of instruction. However, this measure is missing in about 100 schools where the EQAO suppresses the count for privacy reasons. Extremely similar results are obtained using the alternative measure of immigration. While this variable showed no predictive power in Grade 3, it is strongly correlated with student outcomes in Grade 6. Further details are found in Appendix 1. Table 3 provides the change in pass rates for a one-unit change in the Z-value in Grade 6 literacy and mathematics – 9.11 and 12.56 percentage points, respectively.
The next section explores two additional dimensions of the Signposts analysis: differences between separate (Catholic) and public schools, and the unique challenges of middle schools that receive students in Grade 6. The last section considers the role of the larger boards in relation to EQAO assessment results.
4. Middle Schools and Separate Schools
This section explores two features of the Ontario school system and how they relate to student EQAO success: whether a school is part of the separate school system (for both Grade 3 and 6 assessments) and whether a school is a middle school that serves only Grades 6 to 8 (only for the Grade 6 assessment). Table 4 summarizes the estimated impact of each feature on student pass rates in literacy and mathematics. Full methodological details are presented in Appendix 1.
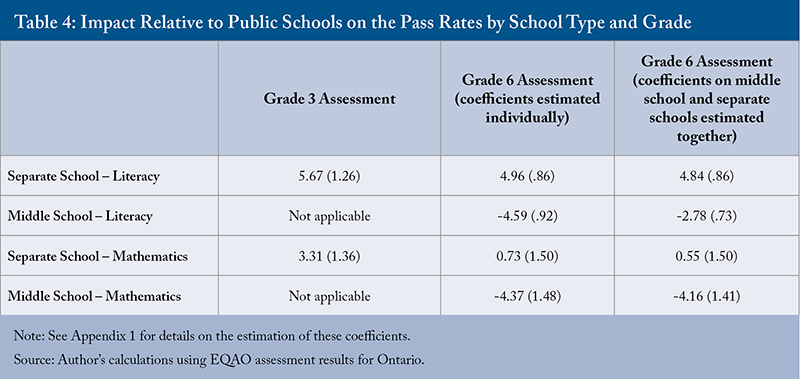
Separate schools perform significantly better than public schools on the Grade 3 assessments – even after accounting for differences in students’ socioeconomic backgrounds. On average, students in separate schools have predicted pass rates on the Grade 3 assessments that are 5.7-percentage-points higher in literacy and 3.3-points-higher in mathematics than similar students in public schools.
At Grade 6, results are more nuanced. When each feature is analyzed separately, students in separate schools are still predicted to have higher literacy pass rates (4.9 points above comparable public schools). However, in mathematics, the difference is much smaller – 0.77 percentage points – and is not statistically significant. By Grade 6, separate schools and public schools have similar mathematics pass rates.
There is a further complication with the public-separate school distinction. The public system has some middle schools where the Grade 6 class arrives at a new school, where Grades 7 and 8 are also taught1111 There is only one middle school starting in Grade 5 in the entire separate school system. There are 84 such middle schools in the public system. There are many more Grade 7-8 middle schools. – and this structural difference has a striking impact on student results. In literacy, students at these middle schools are predicted to have a 4.6-percentage-point lower pass rate compared to students in Grade 6 who do not attend middle schools. In mathematics, the predicted reduction in the pass rate is 4.3 percentage points, a large difference.
Once the middle school variable is incorporated into the prediction, the Z-scores at these schools compare the Grade 6 results at one middle school to another middle school. This allows, in a sense, a fair comparison among the 84 middle schools with Grade 6 in the system, and, to some extent, with other schools as well. As noted earlier, the Z-score at a middle school where students started in Grade 6 is more difficult to attribute to teachers at the middle school since those students have spent only one year at that school. The overall negative effect of middle schools on the EQAO Grade 6 academic results, combined with other evidence from outside this paper, leads to the question of why we have middle schools at all – let alone middle schools that begin in Grade 6.1212 The negative impact of middle schools on student results is also found in Johnson (2012) and is a well-established part of the literature (Bedard and Do 2005). However, the long-term impacts are unknown.
When both the separate and middle school effects are estimated together (last column of Table 4), some of the estimated impacts change. This is because nearly all middle schools that begin in Grade 6 are in the public system – only one is part of the separate system – so the effects are intertwined. Once both variables are included, the results show that the separate school literacy advantage drops slightly from 4.96 to 4.84 points. The middle school penalty in literacy is also smaller but still substantial when both are included in the analysis, decreasing from -4.59 to -2.78 percentage points. The estimates for math remain largely unchanged: middle schools still show significantly lower Grade 6 results, while separate schools have no clear advantage.
These results reinforce two key messages. First, separate schools appear to offer an advantage in literacy at both the Grade 3 and Grade 6 levels, as well as in mathematics at the Grade 3 assessment point. Second, students tend to perform worse in Grade 6 when they attend a middle school that starts in Grade 6.
5. School Boards and EQAO Results
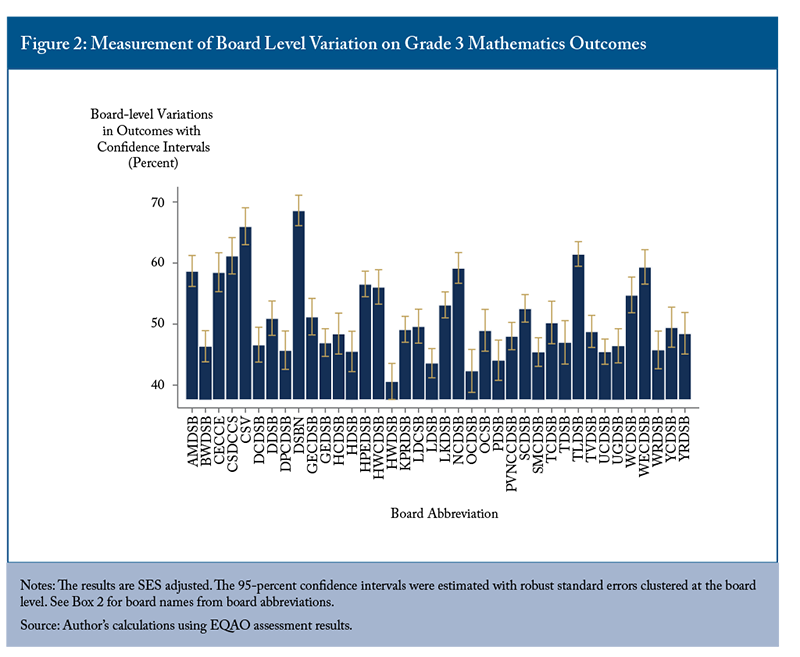
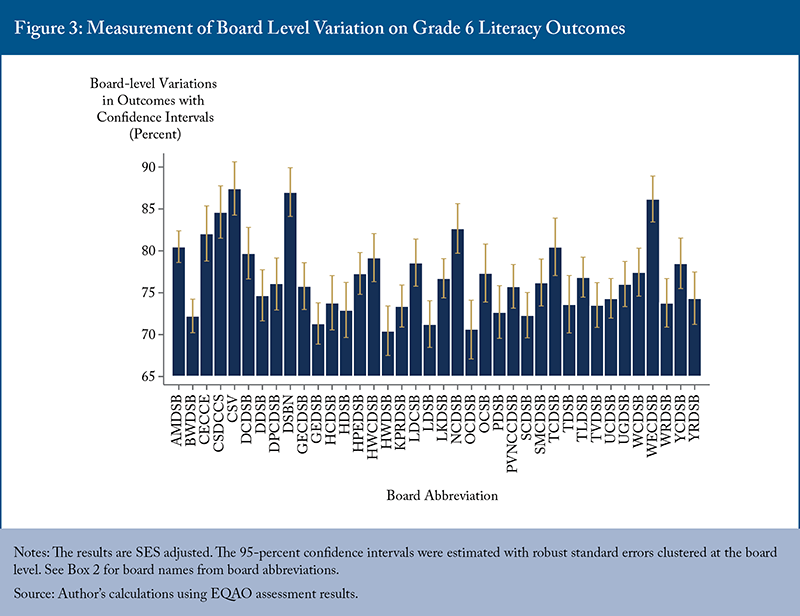
This section builds on the analysis in Appendix 2, Figure A3, which shows the method for a single school board to compare student assessment outcomes across all boards. The approach estimates a separate regression line for each board, showing the relationship between schools’ pass rates and the students’ SES. If the regression line for one board sits consistently above that of another, it means that – at the same SES level – schools in the higher-line board tend to achieve better results. These regression lines are estimated only with the data from boards with more than 30 schools to provide a large enough group of schools to allow a statistical analysis.
The key objective is to estimate, as accurately as possible, the vertical distance between these regression lines that represents the average difference in school performance between boards after accounting for SES. This method extends naturally to comparisons across many school boards and SES variables. The quantified differences between boards’ performance are presented in Figures 1 through 4.
Each bar in Figures 1-4 represents variation in the pass rate for schools in a board after adjusting for differences in students’ SES. A taller bar means the board’s schools typically perform better than expected, given their students’ backgrounds.
The vertical line and “whiskers” on each bar show the margin of uncertainty – called a 95-percent confidence interval. If two boards’ whiskers do not overlap, we can be confident that the impact of the two boards on pass rates is truly different.
For example, in Figure 1 (Grade 3 literacy), the bar representing the Avon-Maitland District School Board (AMDSB) has a value of about 64 percentage points, while the Bluewater District School Board (BWDSB) has a value closer to 54 percentage points. Their whiskers do not overlap, indicating a meaningful difference in performance. We conclude that the AMDSB schools experience a positive board effect relative to BWDSB schools. The comparisons between these two boards and all boards control for the background of the students.1313 This pair of boards are geographically adjacent in southwestern Ontario. Neither contains a large city. The question is why would results at AMDSB be so much better. However, I am not aware of any systematic work trying to explain variation in board-level results. This approach allows fair comparisons between boards by holding constant differences in student background and identifies only those boards where results are reliably different, as indicated by the non-overlapping red line.
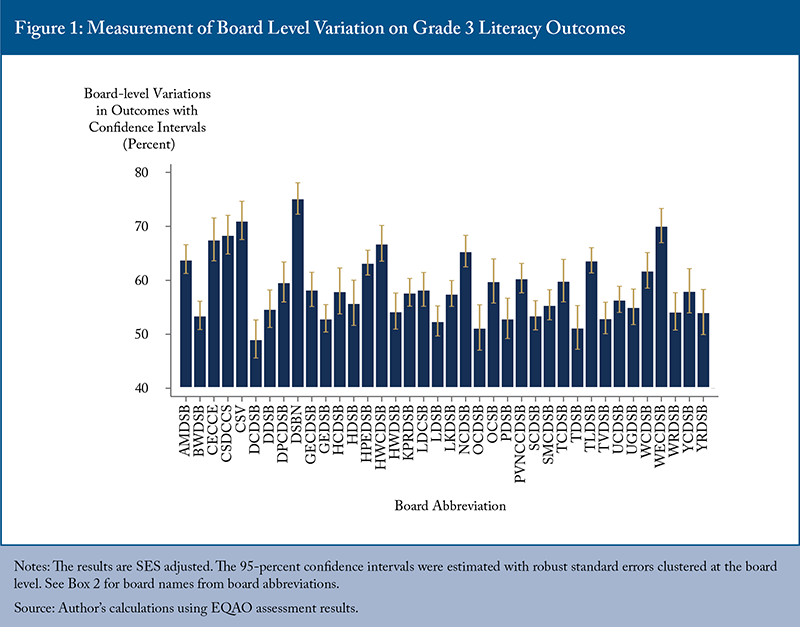
To ensure fair comparisons, the analysis in Figures 1 through 4 is limited to the 38 boards that are sufficiently large to plausibly estimate the average effect of a board on its schools with precision.1414 Johnson (2008) presents an alternative methodology to compare boards of widely varying sizes. That methodology does not present differences in board results in percentage points of pass rates and was not used here. This Commentary focuses on differences between pass rates as the measure of success at a school or at a board. In estimating the effect of the board on Grade 6 assessments, the model also includes a middle school indicator variable, since middle schools are disproportionately concentrated in just two public boards – Peel and Toronto. This concentration disrupts the board-to-board comparisons that include these two boards in
Grade 6.1515 One could argue that these are the boards that choose to have middle schools that start in Grade 5 and, therefore, we should count the effects of the middle schools that start at Grade 5 within the board effect. Peel and the TDSB would look even worse than other boards in that case.
In the Grade 3 literacy assessments, the boards with a much higher contribution to the average pass rate – identified by higher bars in Figure 1 where gold lines do not overlap with the large number of lower-ranked, average boards – are AMDSB, CECCE, CSDCCS, CSV, DSBN, HPEDSB, NCDSB, TLBSB, WCDSB, and WECDSB.1616 See Box 2 for a full list of school board acronyms.
Figure 2 presents the same information for Grade 3 mathematics outcomes. The clearly better boards include: AMDSB, CECCE, CSDCCS, CSV, DSBN, HPEDSB, HWCDSB, LKDSB, NCDSB, TLDSB, WCDSB, and WECDSB. One observation: this board list overlaps substantially between the Grade 3 literacy and mathematics assessments. These boards have, after controlling for SES characteristics, superior primary assessment results in both literacy and mathematics. These boards with a positive influence on Grade 3 assessment outcomes are:
- Public Boards: Avon-Maitland DSB, District School Board of Niagara, Trillium-Lakelands DSB, Hastings and Prince Edward DSB;
- French Language Boards: Conseil des écoles catholiques du Centre-Est, Le Conseil scolaire catholique MonAvenir, Conseil scolaire Viamonde; and,
- Separate Boards: Hamilton-Wentworth Catholic School Board, Niagara Catholic District School Board, Waterloo Catholic School Board, Windsor-Essex Catholic District School Board (WESCB).
According to Figure 3, Grade 6 literacy pass rates are significantly higher at the following boards: AMDSB, CECCE, CSDCCS, CSV, DSBN, NCDSB, TCDSB, and WECDSB. The additional school board in that list, compared to the Grade 3 results, is the Toronto Catholic District School Board.
In Grade 6 mathematics, CSDCCS, CSV, DSBN, and WECDSB are the boards with the highest estimates, showing no overlap with a large number of less successful boards (Figure 4).
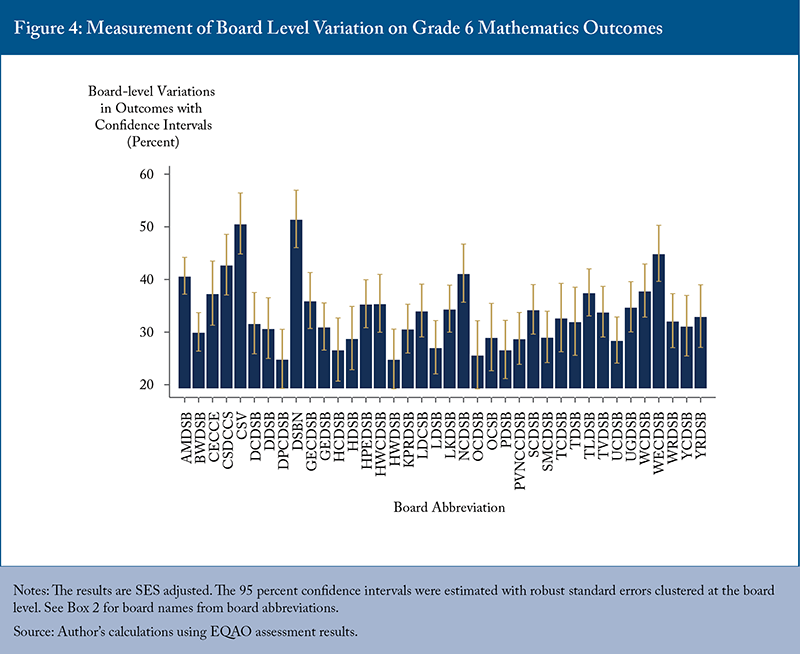
It is notable that every board on the Grade 6 lists of high-performing boards, except the TDCSB, is also on the Grade 3 list (this is not true in reverse). This consistency across grades and subjects suggests that some boards systematically produce better student outcomes, even when accounting for differences in student SES.
While this analysis identifies these high-performing boards, understanding why they succeed would require further study beyond the scope of this Commentary.
6. Conclusions
This Signposts exercise is an important analysis of EQAO assessment results. It demonstrates that school outcomes cannot be explained solely by socioeconomic characteristics. In fact, when schools produce better outcomes than others with students from similar backgrounds, their practices should be investigated and emulated. The Signposts methodology offers a rigorous and equitable framework for doing so.
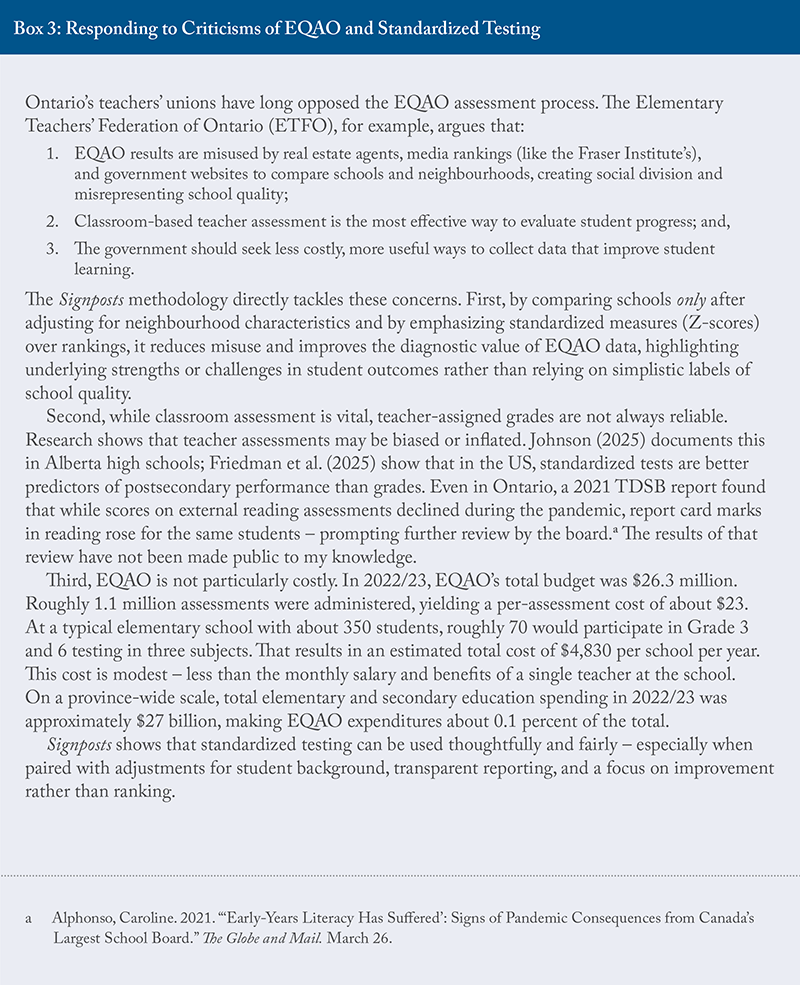
It also responds to longstanding criticisms of standardized testing by teachers and educators. As Box 3 discusses, many concerns raised by the Elementary Teachers’ Federation of Ontario (ETFO) about the misuse of EQAO results, the reliability of teacher assessments, and the cost of standardized testing are addressed or refuted by the Signposts approach. By adjusting for socioeconomic context and using transparent standardized performance scores (Z-scores) rather than simplistic rankings, Signposts offers a fairer and more constructive interpretation of school performance.
The Signposts analysis shows that in Grade 3 literacy, Grade 3 mathematics, and Grade 6 literacy, students in the separate school system, as well as the one non-separate French board, systematically do better than students in the public system. This advantage is not because the students differ in their social and economic backgrounds. Rather, it appears that different practices in the separate school system seem to lead to better results.
These findings invite further investigation. For example, researchers and policymakers could explore the specific practices and conditions in schools with higher Z-scores leading as the measure of higher EQAO outcomes. Encouraging such inquiry would help ensure that promising approaches are identified and shared, ultimately guiding more effective education policy.
In earlier fieldwork, I visited 13 schools across six boards that had high Z-scores, as identified by Johnson (2005). These schools served students from a range of socioeconomic backgrounds and were drawn from both public and separate systems. When asked why their students achieved better literacy and numeracy outcomes compared to similar schools, teachers most often cited effective teaching, collaborative efforts across grades, and some targeted preparation to help students understand the assessment process.
When asked what, if anything, had been sacrificed to focus on EQAO success, most teachers (57 of 136) said “nothing,” though some (23) noted reduced time for the arts. Given changes in curriculum, assessment, and classroom demands since 2005, similar visits to high-performing schools today – using the Signposts methodology as a guide – could once again reveal valuable insights into what is working and why.
Additionally, the findings show that students who transition to a middle school for Grade 6 tend to lose academic ground over that year compared to students who remain in K-6 or K-8 schools. There is no obvious academic justification for middle schools. For boards already facing declining enrolment – either overall or in specific catchment areas – this could be a compelling reason to reconsider or phase out middle schools.
Finally, the results identify boards where the academic results on the Grade 3 and Grade 6 assessments are significantly higher. Understanding what these boards are doing right could offer valuable lessons for improving performance system-wide.
These findings have timely implications for Ontario’s education system. In 2025, the province placed five school boards under supervision – Thames Valley District School Board (TVDSB) (in London) in the spring, followed in June by Toronto District School Board (TDSB), Toronto Catholic District School Board (TCDSB), Ottawa-Carleton District School Board (OCDSB), and the Dufferin-Peel Catholic District School Board (DPCDSB) – citing financial concerns. Notably, none of these five boards are found in Figures 1 through 4 as exceptionally strong boards and in a number of cases, in the different assessments, these boards are among the weakest contributors. This suggests that financial mismanagement and challenges in student performance may be linked. These developments reinforce the need for tools like the Signposts methodology. By adjusting for socioeconomic context, it helps policymakers distinguish between schools struggling due to external conditions and those underperforming despite more favourable circumstances – enabling more targeted and equitable interventions.
The author extends gratitude to Colin Busby, Parisa Mahboubi, Arthur Sweetman, Rosalie Wyonch, and several anonymous referees for valuable comments and suggestions. The author retains responsibility for any errors and the views expressed.
Appendix 1 – Details of Regression Results
This appendix presents details of data construction as well as estimates of the regressions used to construct the results presented in the body of the text.
Pass Rates
The total number of students in a school achieving Level 3 or Level 4 on an assessment over the academic years 2023/24, 2022/23, and 2021/22 is calculated if a school was open in 2023/24. The same three academic years are used to calculate the total number of students attending each school in the grade. The pass rate in reading, writing, and mathematics is the ratio, expressed as a percent, of the number of students achieving Levels 3 or 4 to the total number of students. The pass rate in literacy is the average of the pass rates in reading and writing. The data used in the construction of these variables were provided by the EQAO.
Social and Economic Status Variables provided by the Ministry of Education
These variables describe the characteristics of all students at schools in an academic year. A student’s address places a student in a Dissemination Area (DA) based on the 2021 census. Weighted averages, weighted by the number of students at a school living at each DA, represent the students’ characteristics. The averages are calculated for the 2021/22 and 2022/23 academic years and then averaged together. There are no data for a school that first opened in 2023/24, and these schools are excluded from the analysis. The variables (with short names in parentheses) are:
- percentage of adults associated with a school with some university education (University);
- percentage of lone-parent households (Lone Parents);
- percentage of adults without any completed educational qualification – that is, less than a high-school education (No educational certificate);
- percentage of households below the low-income cutoff defined as the median income adjusted for family size (Low-income measure, after-tax [LIM-AT] in the terminology of Statistics Canada) (Low Income);
- percentage of students participating in EQAO assessments who have been at a school for less than one year (One-year movers); and,
- percentage of persons associated with the school who have been in Canada less than five years (Five-year immigrants).
These data, with the exception of the EQAO-based variable, were provided by the Ontario Ministry of Education. In the text, the variables describing adults associated with a school are, for convenience, referred to as parents (footnotes 2 and 3).
Regression Results
Table A-1 shows the regressions used in the text to predict Grade 3 results. The explanatory power, the value of the R2 is higher in the math regression (0.41) than in the literacy regression (0.27). The role of SES variables in the math regression is larger. The coefficients on the predicting SES variables are different in the two regressions. The right-hand side of the table repeats the regressions with the indicator for separate schools added to the regressions.
The gap between literacy and math results in the public and separate schools is very large and not explained by differences in student SES characteristics. This is illustrated in Table 2 and is also shown by the stability of the estimated coefficients on the SES variables across the two literacy and two math regressions in Table A-2. The text discussed the lower R2 in the numeracy equations than in the literacy equations.
Table A-2 is slightly more complex. The SES variables are different than those in Table A-1 because different SES variables better predict Grade 6 than Grade 3 results. It is particularly interesting to observe that schools with a large percentage of recent immigrants have predictably lower Grade 6 pass rates in both literacy and math. Going from left to right, the first two regressions are used to construct the Z-scores. These regressions include the middle school indicator variable, so schools that receive Grade 6 students in their first year at the middle school are compared to other schools that have the same structure. The other four regressions help understand the interaction discussed in the text around the fact that separate school boards have very few middle schools.
In the final two columns, where the indicators for both a middle and separate school appear, the results show that separate schools have a 4.78-percentage-point higher pass rate in Grade 6 literacy, but do not have a higher pass rate in Grade 6 math than public schools. The middle two columns confirm this result without the middle school variable. The better results in the separate system are not entirely due to the absence of middle schools starting in Grade 6. By Grade 6, the R2 in the equations for literacy and numeracy are similar. This can be interpreted as a more similar role for family background in Grade 6 for the two subjects.
Appendix 2 – Illustrating the Methodology
This section provides a visual illustration of the regression-based methodology used to analyze the relationship between socioeconomic status variables and EQAO pass rates.
Figure A1 represents the fitted regression line based on the average relationship between SES variables and pass rates for all schools. It has a slope of 0.3, which means that a one-percentage-point increase in the SES variable predicts a 0.3-percentage-point increase in the pass rate. The positive slope indicates that higher SES schools tend to perform better because the students come from more advantaged family backgrounds.
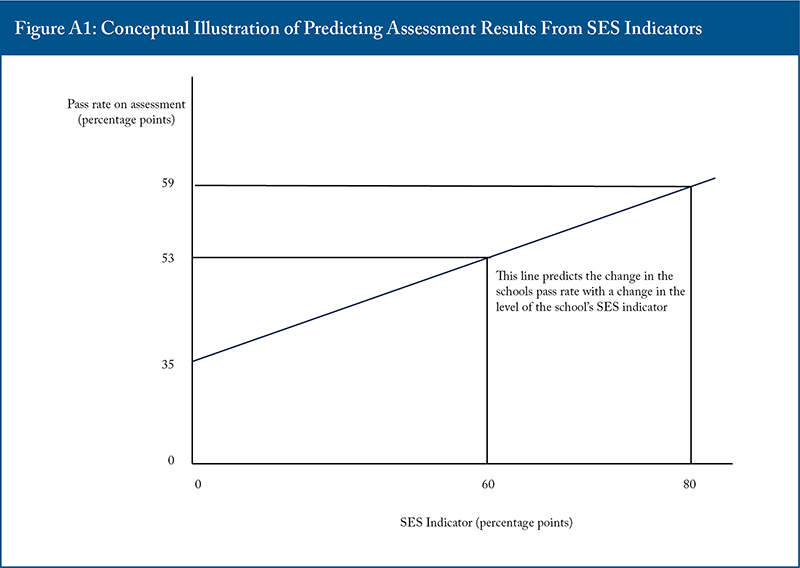
Figure A2 presents a hypothetical scenario where SES fully predicts school performance, with all schools’ results closely aligned to the regression line. This illustrates an extreme case where most schools outperform or underperform relative to expectations based on SES. The current and earlier Signposts reports show that this is emphatically not the case for Ontario’s elementary schools.
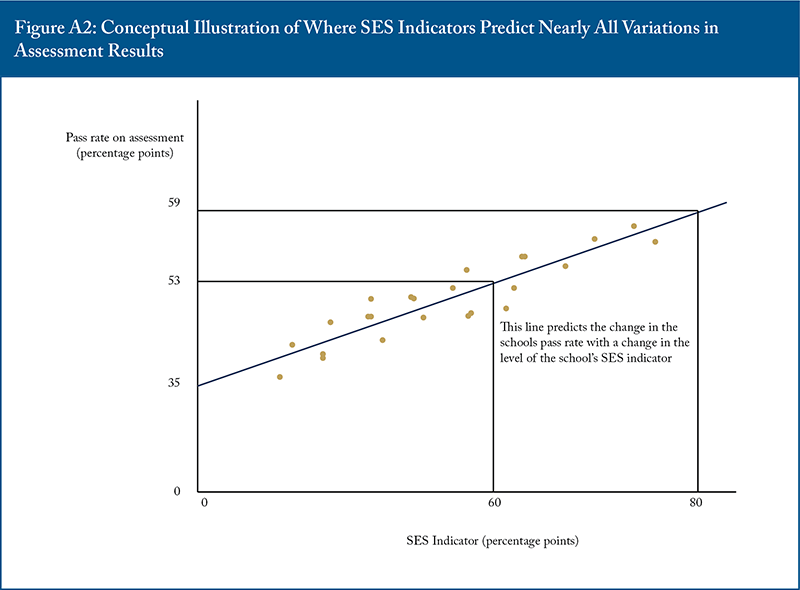
Figure A3 is a schematic representation resembling Ontario elementary schools, highlighting substantial variation in performance among schools with similar SES levels. At the same SES value (for example, 60 percent), some schools exceed expectations (school A), others fall below (school B), and some perform as predicted (school C). This variation highlights the importance of measuring school success relative to their socioeconomic context rather than relying on unadjusted scores alone.
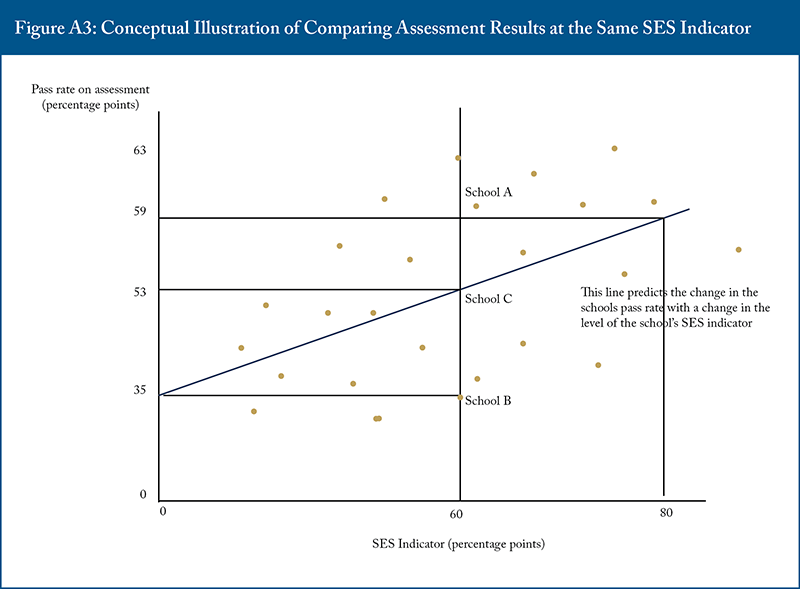
Together, these figures demonstrate the rationale for using regression analysis to adjust for SES when evaluating school effectiveness, providing a fairer and more nuanced understanding of school performance. The residuals from these regressions determine what magnitude of deviation from the line is large enough to meaningfully distinguish better or worse school outcomes.
References
Bedard, Kelly, and Do Chau. 2005. “Are Middle Schools More Effective? The Impact of School Structure on Student Outcomes.” Journal of Human Resources 40 (3): 660-682. https://jhr.uwpress.org/content/40/3/660.
Friedman, John N. et al. 2025. “Standardized Test Scores and Academic Performance at Ivy-Plus Colleges.” National Bureau of Economic Research Working Paper 33570. https://www.nber.org/system/files/working_papers/w33570/w33570.pdf.
Johnson, David R. 2005. Signposts of Success: Interpreting Ontario’s Elementary School Test Scores. Policy Study 40. Toronto: C.D. Howe Institute. March. https://cdhowe.org/publication/signposts-success-interpreting-ontarios-elementary-school-test-scores/.
______________. 2007. “Ontario’s Best Public Schools: An Update to Signposts of Success.” E-Brief 39. Toronto: C.D. Howe Institute. February. https://cdhowe.org/publication/ontarios-best-public-schools-update-signposts-success-2005/https://cdhowe.org/wp-content/uploads/2024/04/signposts.pdf.
______________. 2008. “Heads of the Class: A Comparison of Ontario School Boards by Student Achievement.” Backgrounder 115. Toronto: C.D. Howe Institute. https://cdhowe.org/publication/heads-class-comparison-ontario-school-boards-student-achievement/.
______________. 2012. “Are Middle Schools Good for Student Academic Achievement? Evidence from Ontario.” E-Brief 141. Toronto: C.D. Howe Institute. November. https://cdhowe.org/publication/are-middle-schools-good-student-academic-achievement-evidence-ontario/.
______________. 2025. “Measuring Grading Standards at High Schools: A Methodological Contribution, an Example, and Some Policy Implications.” Educational Evaluation and Policy Analysis. https://doi.org/10.3102/01623737241311537/.
Johnson, David R., and Robbie Brydon. 2012. “Ontario's Best Public Schools: 2009-2011.” E-Brief 134. Toronto: C.D. Howe Institute. June. https://cdhowe.org/publication/ontarios-best-public-schools-2009-2011/.
Kane, Thomas, and Douglas O. Staiger. 2002. “The Promise and Pitfalls of Using Imprecise School Accountability Measures.” Journal of Economic Perspectives 16 (4): 91-114. https://www.aeaweb.org/articles?id=10.1257/089533002320950993.
Richards, John. 2025. “The Case of the Boiling Frogs: Provincial Indifference to Declining Education Outcomes.” E-Brief 369. Toronto: C.D. Howe Institute. March. https://cdhowe.org/publication/the-case-of-the-boiling-frogs-provincial-indifference-to-declining-education-outcomes/.
To cite this document: Johnson, David. 2025. Signposts of Success: Evaluating Ontario’s Elementary Schools. Commentary 691. Toronto: C.D. Howe Institute.
C.D. Howe Institute Commentary© is a periodic analysis of, and commentary on, current public policy issues. Percy Sherwood, James Fleming, and Michael Benedict edited the manuscript; Yang Zhao prepared it for publication. As with all Institute publications, the views expressed here are those of the author and do not necessarily reflect the opinions of the Institute’s members or Board of Directors. Quotation with appropriate credit is permissible.
To order this publication please contact: the C.D. Howe Institute, 67 Yonge St., Suite 300, Toronto, Ontario M5E 1J8. The full text of this publication is also available on the Institute’s website at cdhowe.org.