






The Study In Brief
In theory, the management of public funds by Canada’s senior governments – federal, provincial and territorial – reflects the preferences of Canadians, expressed through their elected representatives.
In practice, however, the revenues and expenses of senior governments – and the differences between them, which affect each government’s net worth and capacity to deliver services in the future – do not resemble budget targets closely enough to conclude that accountability for public funds functions well in Canada. Comparing the fiscal plans in the budgets delivered by Canada’s federal, provincial and territorial governments at the beginning of each year with their financial statements after the end of the year reveals not just that they routinely miss their targets by meaningful amounts, but that the gaps between budgets and results are not random.
One consistent pattern is that both year-end expenses and revenues typically come in above what governments promised in their budgets. Over the 19 fiscal years since 2000/01, Canada’s senior governments overshot their expense targets by $97 billion. That cumulative overshoot means that governments went into the COVID-19 crisis bigger than they would have been – spending $2,600 more per Canadian than they would have been – if they had fulfilled their budget commitments. Even more startling is the cumulative revenue overshoot since 2000/01: $161 billion. Canada’s senior governments went into the crisis raising $4,300 per Canadian more than they would have if they had hit their annual revenue targets. Ottawa, the provinces and territories would have been better prepared for the pressures to expand their activities they now face if they had fulfilled their past budget commitments.
Comparing the annual patterns of overshoots and undershoots over time raises a further concern. If governments’ responses to economic cycles were guided largely by the desire to stabilize taxes, programs and the economy, slumps would cause overshoots of expenses coincident with undershoots of revenue, and booms would cause undershoots of expenses coincident with overshoots of revenue. However, that is not the dominant pattern for Canada’s senior governments. Overshoots on either side of the ledger tend to coincide. That suggests that these governments underprojected revenues deliberately and spent most of the resulting in-year “surprise,” or that they otherwise “managed” their numbers to achieve a predetermined bottom line.
Although the fiscal response to COVID-19 will make the senior governments’ spending overshoots in the current 2020/21 fiscal year much worse, we note some encouraging developments over the 19 fiscal years examined in this report. The tendency to miss budget targets, and the troubling annual patterns of misses, were less pronounced in the most recent six years than they were before that. The size of below-the-line adjustments has also tended to shrink.
With the COVID-19 crisis having driven Canada’s senior governments so deeply into the red that their future capacity to deliver services is in doubt, more reliable budget targets and better adherence to those targets is vital. Legislators and voters should ensure that budgets and results align better in the future.
Introduction
Canada’s federal, provincial and territorial governments raised and spent some $845 billion in 2019. That is about two-infive dollars of Canadian incomes or more than $22,000 per Canadian – numbers that are rising as governments respond to the COVID-19 crisis.
These are large amounts: the taxes and fees governments levy are top of mind for many people, as are the services and transfers they provide. So we might presume that these activities reflect Canadians’ preferences – and that the elected representatives through which Canadians express these preferences have both the knowledge and the ability to hold governments to account for their management of these funds.
Formal frameworks for control of public funds through elected representatives do exist. Governments typically present budgets to legislatures around the start of each fiscal year. Budgets make headlines, get widespread scrutiny and are the subject of budget implementation bills that, being votes of confidence, can bring governments down. Governments also present estimates that require legislators’ approval for spending particular amounts. Governments publish audited financial statements after the end of the fiscal year. Legislative auditors scrutinize the consistency of the financial statements with public sector accounting standards.
While the scrutiny processes of committees – more prominently, public accounts committees – have formal oversight, the low public profile of many of these documents and processes mean that mechanisms for holding governments accountable for actual results do not work well in practice. Comparing the actual revenues and expenses that Canada’s senior governments publish in their audited financial statements after year-end reveals that they routinely miss their budget targets by significant amounts.
Over the 19 fiscal years since 2000/01, these governments have overshot their expense targets by a cumulative $97 billion, almost $2,600 per Canadian.11 Although we have data from budgets and financial statements for senior governments going back to fiscal 1996/97, our analysis begins in 2000/01, the first fiscal year of the newly constituted Northwest Territories and Nunavut. Over the same period, their revenues overshot budget targets by an even larger amount: a cumulative $161 billion, or $4,300 per Canadian. While the fact that the revenue overshoot exceeds the expense overshoot means that Canada’s senior governments registered better bottom lines than they budgeted, the overshoots on both sides of their budgets mean are spending more and taxing Canadians more heavily than they would have if they had fulfilled their annual budget commitments.
The fact that governments do not hit their budget targets exactly is not surprising. But these misses are large, and they do not appear to be random. Troublingly, revenue and spending overshoots tend to coincide. This is not the pattern we would see if governments were responding to booms and busts with normal stabilization policies. It is a pattern that suggests governments are reacting to accidental or engineered revenue overshoots with in-year spending, or otherwise manipulating their reported numbers to achieve bottom-line targets.
We also note that increases in governments’ accumulated deficits have tended to be larger than prefigured by the formal bottom-line target in each fiscal year, with adjustments for “other comprehensive income or loss” being predominantly negative in recent years. Whatever their justifications, and while they are consistent with public sector accounting standards, these “below-the-line” adjustments create an obstacle to understanding on the part of legislators and the public. The fact that they are predominantly negative might also suggest that governments may use them to hide bad news.
The COVID-19 crisis has subjected Canada’s senior governments to unprecedented peacetime stresses. Their pre-crisis draw on Canadians’ resources would have been lower if they had hit their annual budget targets over the past 19 fiscal years. More encouragingly, most senior governments had been missing their budget targets by smaller amounts in the years running up to the crisis. Indeed, although the federal government went into the crisis with a deteriorating record in spending revenue windfalls, the suspicious positive correlation of in-year revenue and expense surprises among all senior governments was getting less serious.
Looking ahead, legislators and Canadians generally should ensure that these improving trends resume after the crisis. They should scrutinize budget targets more carefully. All governments should issue regular updates showing how their revenues and expenses are unfolding relative to plan, and explaining over- and under-shoots. When suspicious patterns emerge, such as sudden spending increases in response to “windfall” revenues, budget watchdogs, legislators and taxpayer representatives need to call attention to them and hold governments to account.
Canada’s senior governments have a budgeting accountability gap. The COVID-19 crisis has raised the stakes further. We need improvements in fiscal accountability to match.
Measuring Fiscal Accountability
Many formal measures that give legislators and voters oversight of public funds in Canada’s senior governments are well developed.
The federal, provincial and territorial governments usually present budgets before or, failing that, shortly after the fiscal year begins. They typically present their main estimates around the same time as, and often simultaneously with, their budgets. Budgets and estimates alike require legislative approval.
The senior governments publish financial statements after their fiscal year-ends. These statements are generally consistent with public sector accounting standards, with qualifications by legislative auditors becoming relatively less frequent. The C.D. Howe Institute’s annual reports on the quality of these documents (the latest is Robson and Omran 2020) note many improvements over time.
While formal oversight is a key element in effective control, it is not the same thing. The scrutiny of budgets and estimates by legislatures and their committees is uneven. Voting on a budget in its entirety is not the same as approving all expenses: legislators actually vote item by item only on the subset of expenses that are included in the estimates. And while legislators have unique powers to vote on changes in certain tax bases and rates, these powers are under constant pressure from the executive branch, with legislatures often ratifying actions after they occur. Furthermore, the COVID-19 crisis has emphasized the degree to which governments nowadays feel free to spend without legislative approval.
As for the bottom line – the difference between revenues and expenses, which determines the change in a government’s net worth and its capacity to provide future public services – the examination of a government’s audited financial statements by public accounts committees is a low-profile affair and one that is often cursory or non-existent. Headlines generated by value-for-money audits tend to overshadow the critical role auditors general play in verifying the numbers.
Budgets versus Results
A critical test of effective control over public money is how close the outcomes are to the budget targets. That is the inspiration for this parallel annual effort by the C.D. Howe Institute – comparing intentions to results. Canada’s senior governments have a fiscal year that runs from April 1 to March 31. Our investigation focuses on the two primary documents at the start and finish of that cycle: the budget and the audited financial statements.
The budget is the core statement of a government’s fiscal priorities. Budgets typically get extensive legislative debate, wide media coverage and attention from the interested public. Budget votes are votes of confidence: a failure of a budget vote causes a government to fall.
The audited financial statements are the definitive report of what actually happened. They should, and typically do, present consolidated revenues and expenses for the year. The difference between them is, in principle, equal to the change in the government’s net worth – a concept designed to measure the government’s capacity to deliver services – between the beginning and the end of the year.
Measuring Hits and Misses
Because budget numbers are those that legislators and voters rely on, they are the numbers that we use to measure the hits and misses.22 Governments sometimes release fiscal updates late in the year with changes so major – new tax rates, for instance, or restatements of past results – that they are tantamount to a fresh budget. After an election, a new government sometimes tables an entirely new budget. We use the planned revenues and expenses from the budget closest to the beginning of the fiscal year in our comparisons in order to avoid gaps – an update or new budget in September, for example, would “bake in” whatever had occurred during the first half of the fiscal year. Using the early budgets makes our measures of cumulative over- or undershoots more meaningful and improves our ability to compare like time-periods among different jurisdictions. Big gaps are worse than small ones. If gaps between budget targets and actual results are not random, the patterns may help us reduce future gaps.
Comparing budgetary revenue and expense targets with actual revenues and expenses in the year-end financial statements should be a straightforward indication of a budget’s reliability. Such comparisons should be simple, but they can be challenging in reality. If all governments over the years consistently presented their consolidated revenues and expenses, calculated in accordance with public sector accounting standards, we could simply compare the appropriate dollar amounts in budgets and financial statements. The only arithmetic required would be expressing amounts in percentages to allow comparisons among jurisdictions of different sizes and over time. In the past, however, senior governments did not present numbers that were consistent with public sector accounting standards, notably in their budgets. Even now, some still do not (Robson and Omran 2020).
Expressing amounts in percentages helps our comparisons for another reason. Suppose a budget or financial statement nets some revenues against expenses, reducing the level of both, or excludes some activities. Discrepancies between the two documents distort measures based on dollar amounts. Comparing percent changes in revenues and expenses in budgets to percent changes in revenues and expenses in the financial statements reduces distortions from inconsistent presentations in the two documents.33 In the case of budgets, we calculate percent changes in revenues and expenses for the upcoming fiscal year – the year we are interested in for our comparison – relative to the counterpart preliminary figures shown in the same budget for the prior year. In the case of financial statements, we calculate percent changes in revenues and expenses for the year just ended – the year we are interested in for our comparison – relative to the counterpart amounts shown in the same financial statements for the prior year. We then contrast the percent changes for that year in the two documents to arrive at our measure of under- and overshoots. This method is not perfect, since inaccuracies in a budget’s preliminary figures for the prior fiscal year affect the percent changes calculated from the budget. Notably, if the preliminary figures for the fiscal year about to end in the budget turn out to be too low, the percent changes we calculate from the budget’s figures for the upcoming year will be too high, which will reduce a calculated overshoot. Notwithstanding that problem, our method produces more meaningful comparisons than are possible from comparing dollar amounts in budgets and financial statements that use inconsistent accounting. That would treat differences in dollar amounts that reflected items included, excluded or expensed differently as overshoots or undershoots, yielding much more erratic results.
Expenses
The key numbers for the past 19 fiscal years appear in Table 1. Budgeted changes in expenses are in the top panel, actual changes in expenses are in the middle panel and the differences between them are in the bottom panel.
Table 2 summarizes the reliability of each government’s budget targets over the entire period. Two measures, bias and accuracy, capture key characteristics of their performance.
Bias is measured using the average difference between budgeted and actual changes in expenses – the arithmetic mean of the differences in the third panel of Table 1. Bias indicates whether a government tended to overshoot or undershoot its budget targets. From the point of view of fiscal accountability, a smaller number – less tendency, either way – is better. In calculating the consequences of misses over time, overshoots and undershoots cancel each other, so the sign of the difference is relevant. But we also care about closeness to targets regardless of sign, so the absolute value of the bias (shown as Absolute Mean Error in Table 2) is a useful measure when comparing performance across governments.44 The ranking in Column 3 is based on the absolute value of the bias (the Absolute Mean Error).
Accuracy is measured by capturing the differences between budgeted and actual changes, regardless of direction – the arithmetic mean of the absolute differences in the third panel of Table 1. Unlike the bias measure, in which overshoots and undershoots cancel each other, the accuracy measure treats overshoots and undershoots the same, penalizing governments with more erratic records. Suppose two governments overshot and undershot year by year so that their biases over the period were similar, but one had consistently larger misses in both directions. The accuracy measure would award the government with smaller misses a smaller number – a better score – and the one with larger misses a larger number – a worse score.
On the key question of overshooting versus undershooting, the data for the bias measure in Table 2 deliver a clear verdict. Over the past 19 fiscal years, Canada’s senior governments tended to spend more than they budgeted. The average annual expense overshoot across all governments was 2 percent. Over those 19 fiscal years, 13 of the 14 governments overshot on average: only Newfoundland and Labrador undershot more often on average.
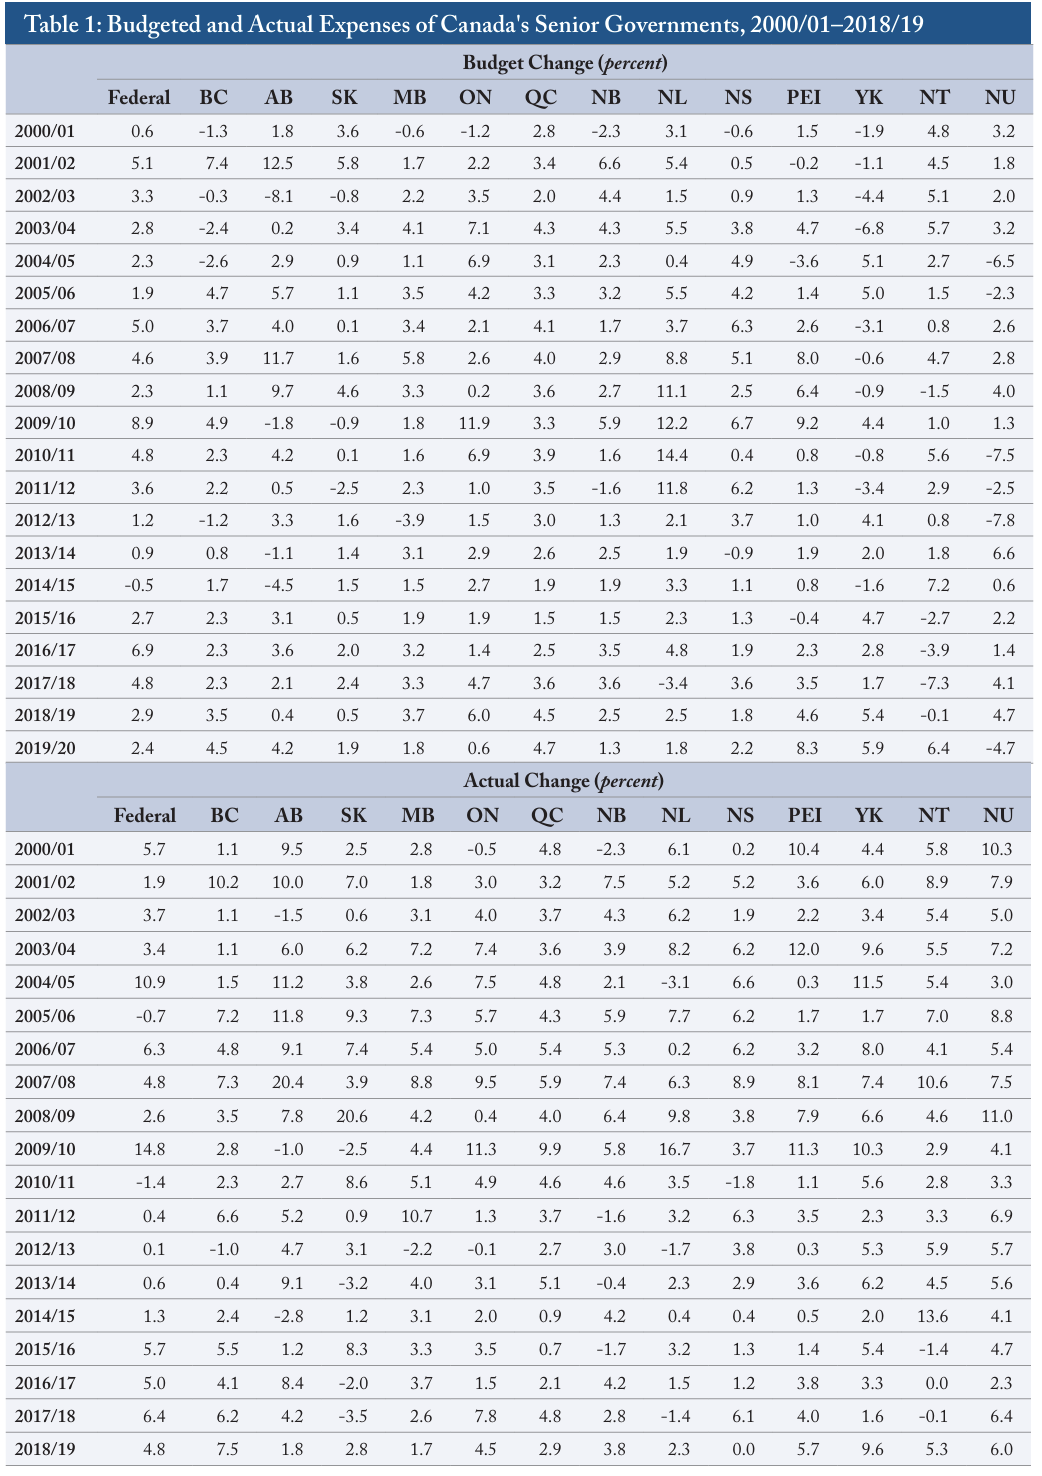
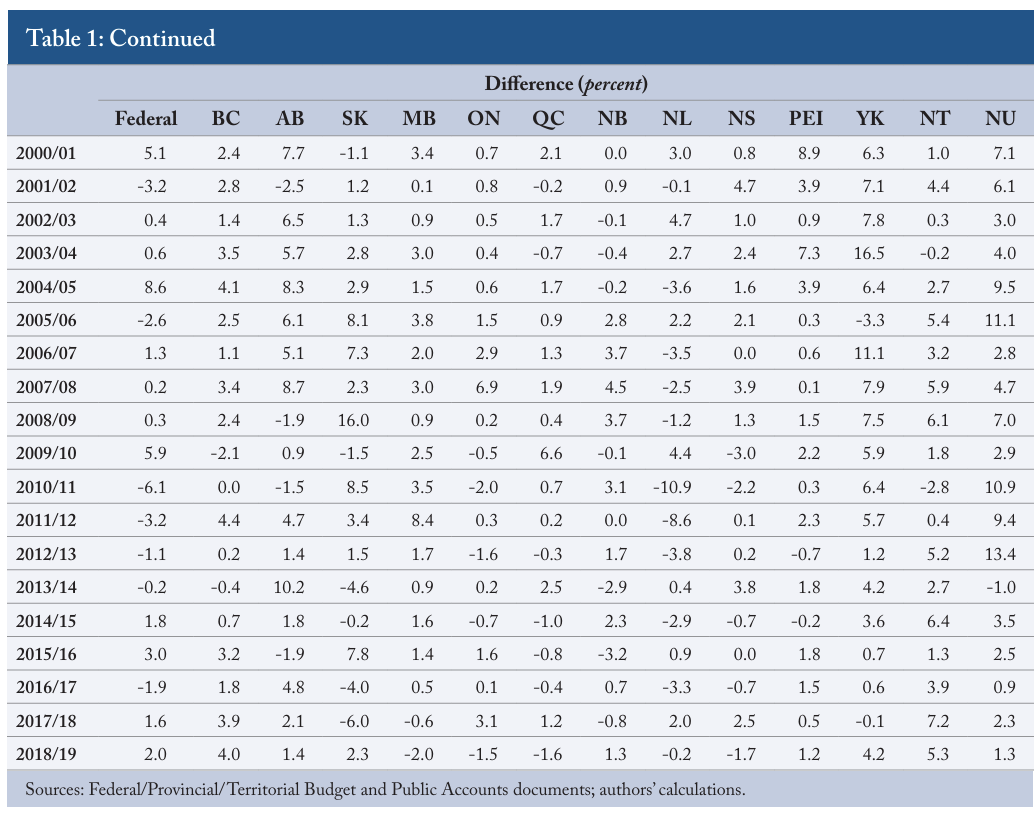
As for the best and worst records related to bias scores, Ottawa’s average overshoot of 0.6 percent gives it the best – that is, the smallest – bias score among the 14 governments. Ontario, Nova Scotia, Quebec and New Brunswick also had absolute bias scores less than 1 percent.55 Although Quebec is not unique in having inconsistencies in its budget presentations over this period, it provides a notable example of the effect those inconsistencies can have on our measures. From fiscal 2004/05 to 2013/14, Quebec did not present consolidated figures in its budgets. If, instead of its financial statements, we had used the non-consolidated figures Quebec presented in its public accounts for those years, Quebec would have ranked first in both the bias and accuracy measures for its expenses (a small improvement), second in bias and first in accuracy for its revenues (a big improvement). Saskatchewan and Alberta had the largest average expense overshoots – 2.5 and 3.6 percent, respectively – among the provinces. Yukon and Nunavut – with average overshoots of 5.2 and 5.3 percent – had the worst records of all.
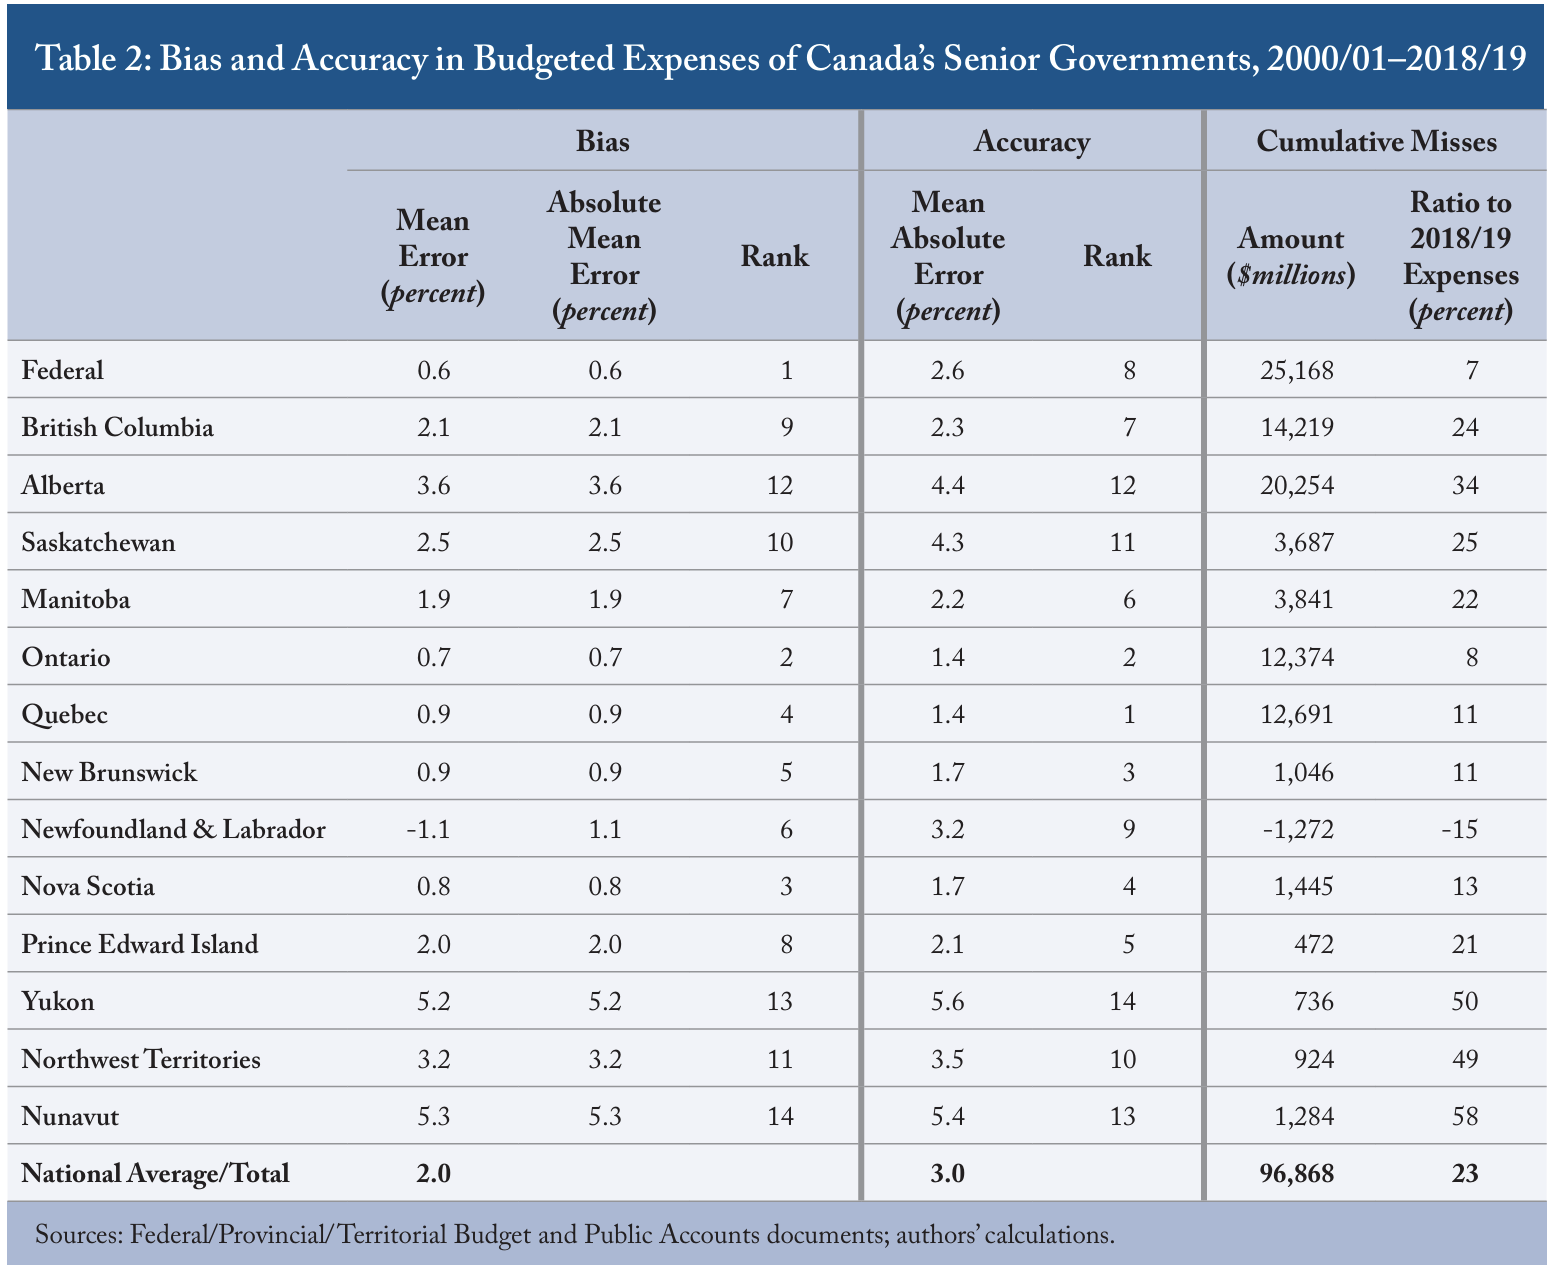
The accuracy scores tell a slightly different story. Quebec, Ontario, New Brunswick and Nova Scotia have mean absolute deviations in the 1.4to-1.7 percent range, putting them at the head of the class. The federal government’s accuracy score of 2.6 percent puts it in the middle of the pack, although it finished the period with a relatively small cumulative overshoot as indicated by the bias measure. Its accuracy score testifies to a more erratic performance year-to-year. Alberta’s and Saskatchewan’s expense targets were the least reliable among the provinces, while those of Nunavut and Yukon were the worst of all. While expense overshoots reflect circumstances such as disaster spending, which was relatively high in Alberta in 2013/14 and 2016/17, for example, calculating the averages over the entire period for which we have data provides us with an overall picture of the reliability of Canada’s senior governments’ budget targets.
Comparing each year’s actual change to the same year’s budgeted change effectively resets the baseline every year. It is reasonable, therefore, to think of these misses as cumulative: each year’s miss adds to the total of previous years’ misses. The final panel of Table 2 provides a snapshot of these cumulative misses, measured as the cumulative difference between actual and budgeted changes. Over the last 19 fiscal years, these cumulative misses added up to more than $97 billion of unanticipated spending – or, to give a sense of scale, almost $2,600 more per Canadian – than governments would have spent if they had met their annual targets.
For another relevant perspective on scale, the final column of Table 2 compares each jurisdiction’s cumulative misses over the 19-year period to budgeted expenses for the 2019/20 fiscal year. To emphasize, this measure says nothing about whether a government was a big or small spender, or whether its intentions were good. A government that budgeted big increases and achieved them, and a government that budgeted big decreases and achieved them would both have zeros in this column. But we see few numbers close to zero here. The cumulative impact of overshoots over the period raised expenses by almost 23 percent on average across all governments. A typical senior government would have started from an expense baseline around one-fifth lower last year if it had hit its budget targets since 2000/01.
Revenues
Revenues are less straightforwardly under governments’ control than expenses. Major changes in taxation belong in budgets, so mid-year changes are rare. Ups and downs in the economy affect revenue with a lag, and information about those impacts takes additional time to come to light. A parallel review of budgeted and actual revenues nevertheless yields useful information, including context for understanding misses on the expense side.
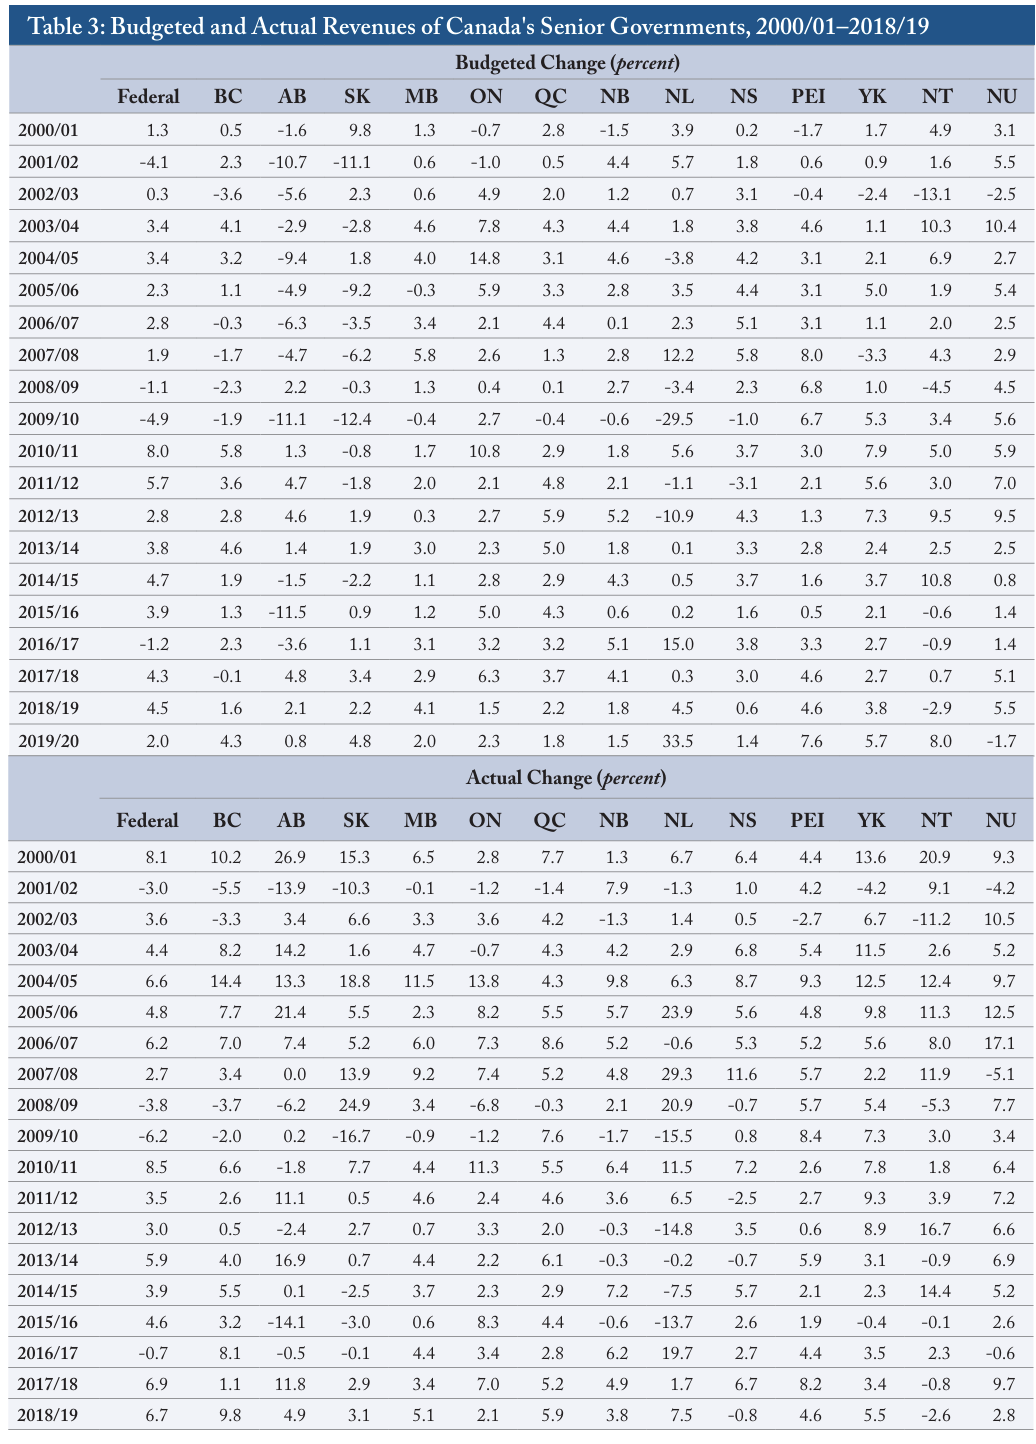
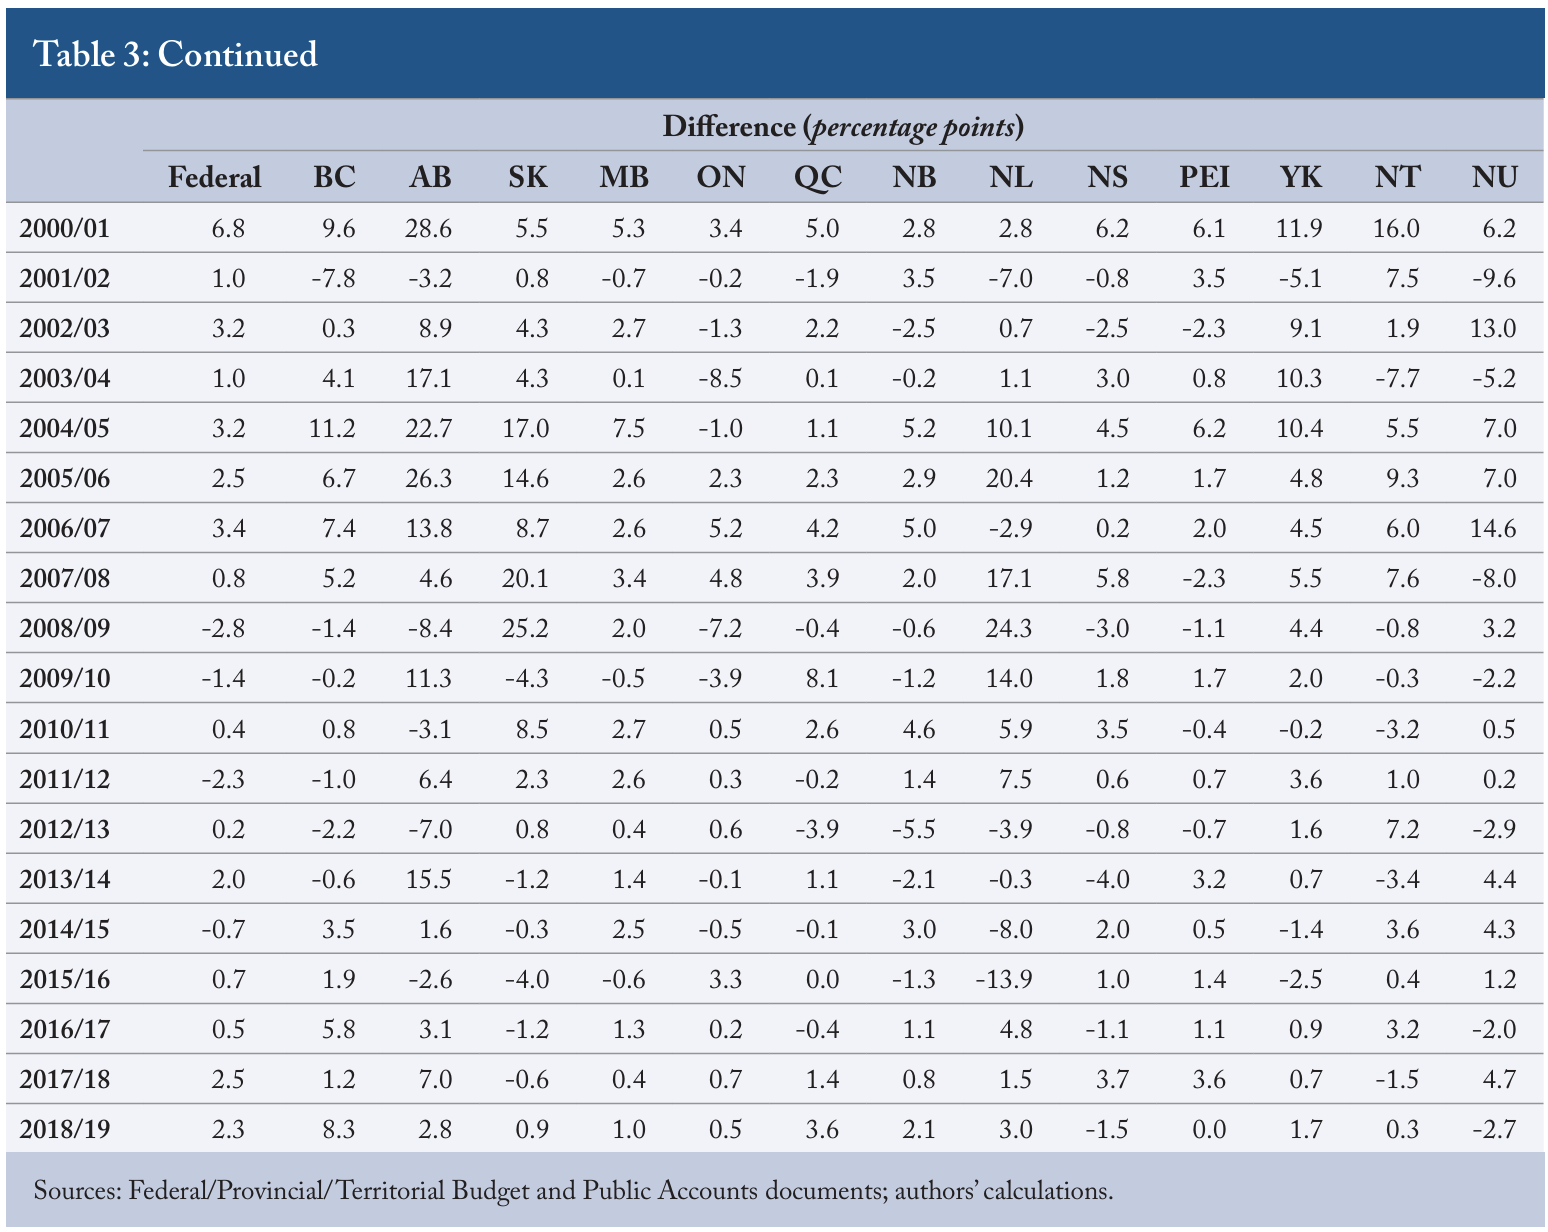
Table 3 presents the budgeted revenue changes of Canada’s senior governments’ over the past 19 fiscal years. The format is the same as in Table 1’s for expenses: budgeted changes in the top panel, actual changes in the middle panel and differences between them in the bottom panel.
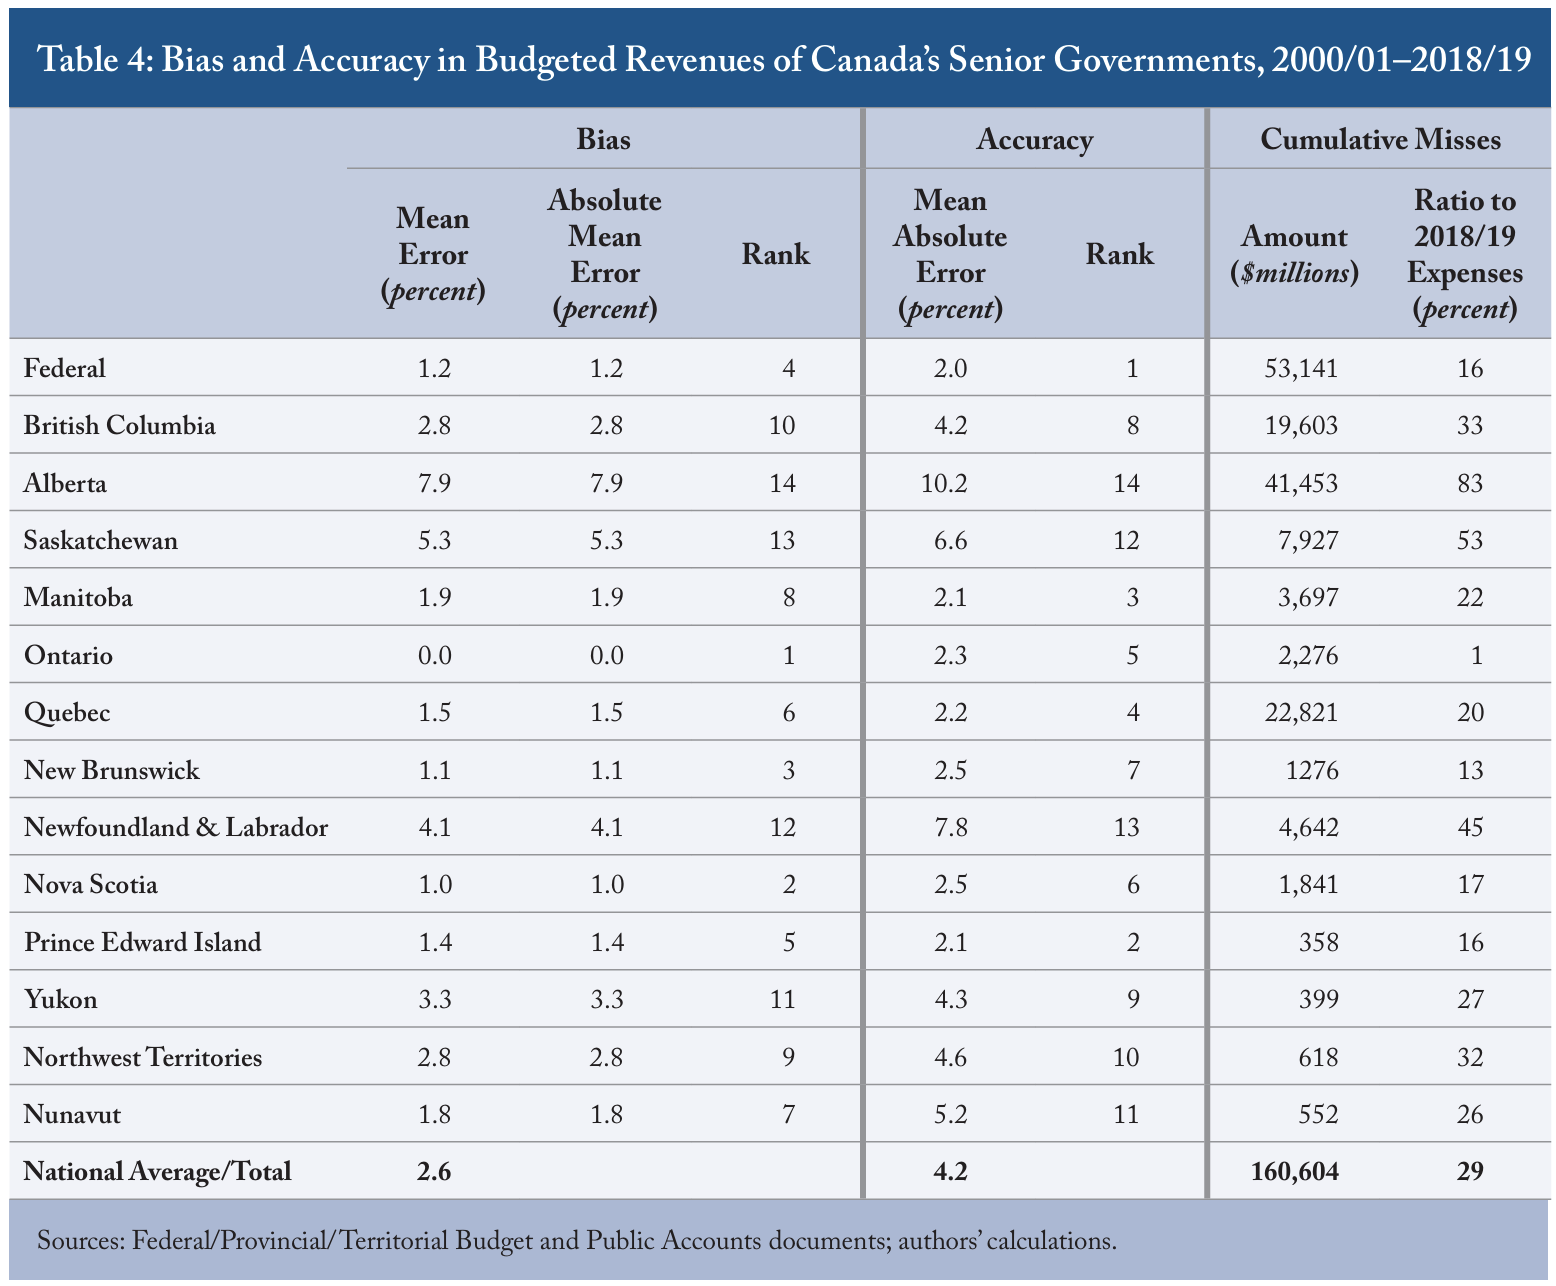
Also in parallel fashion, Table 4 summarizes each government’s performance on the revenue side. To determine scores for bias and accuracy, and cumulative misses in revenues, we apply the same methodology as used for expenses. That is, bias is the average difference between budgeted and actual changes; accuracy is the average of the absolute differences, penalizing larger misses either way.
Surprisingly, perhaps, bias scores show revenue overshoots were not only typical over the 2000/01to-2019/20 period but larger than their expense counterparts.66 This is opposite to the findings of some analysts who expect governments to over-predict revenues for the sake of producing healthier fiscal projections (Jochimsen and Lehmann 2015). Ontario is the only exception. Across all governments, actual revenues exceeded budgeted revenues by an average of 2.6 percent annually over the 19 fiscal years.
As with expenses, we can reasonably treat each year as a fresh start, so revenue overshoots are cumulative. Over the 19 fiscal years, cumulative revenue misses added up to $161 billion of unanticipated revenue – meaning that, in the current fiscal year, the average Canadian will pay more than $4,300 in taxes beyond what would have been the case if governments had adhered to their budget targets.
Ontario, the sole exception, recorded no revenue bias over the period. The federal government, Nova Scotia, New Brunswick, Prince Edward Island and Quebec were also among the better performers, with annual overshoots (bias scores) in the 1-to-1.5 percent range. Not surprisingly, provinces with economies more oriented toward natural-resource industries, which are more cyclical, volatile, and benefited from better-than-expected demand and prices during most years in this period, recorded the largest overshoots: Alberta with an annual average of 7.9 percent, Saskatchewan at 5.3 percent on average, and Newfoundland and Labrador at 4.1 percent.
Turning to accuracy, the federal government’s average absolute misses of two percent was the best – that is, the lowest – score among the 14 governments. Manitoba, Quebec, Ontario, New Brunswick, Prince Edward Island and Nova Scotia had accuracy scores of 2.5 percent or less. Consistent with bias scores, the naturalresource-dependent jurisdictions, more affected by commodity price swings, did poorly.
As Table 2 does for expenses, Table 4 shows in its final column the size of each jurisdiction’s cumulative revenue misses relative to budgeted revenues in its latest budget. On average, the cumulative impact of overshoots over the past 19 fiscal years left budgeted revenues for 2019/20 almost one-third higher than would have been the case if governments hit their budget targets in the past.
Understanding Budget Hits and Misses
Having considered together the differences between budgeted and actual revenues and expenses separately, we obtain some insights into why governments miss their targets.
Odd Patterns of Revenue and Expense Surprises
Students of fiscal policy in a macroeconomic context would not expect governments to chronically overshoot both their revenue targets and their expense targets. The standard prescription for macro fiscal management is that governments in booms should let revenues rise and expenses fall relative to plan, as both naturally will tend to do. In busts, they should let revenues fall and expenses rise relative to plan, as both will also naturally tend to do.
That kind of countercyclical policy moves the bottom line toward surpluses in booms and toward deficits in busts. It can stabilize aggregate demand, and it limits disruptive changes in tax rates and programs.
What is notable in the context of our analysis is that it would produce both annual overshoots in revenues that would coincide with undershoots in expenses and annual undershoots in revenues that would coincide with overshoots in expenses. The correlation between annual overshoots and undershoots in revenues and expenses would be negative.
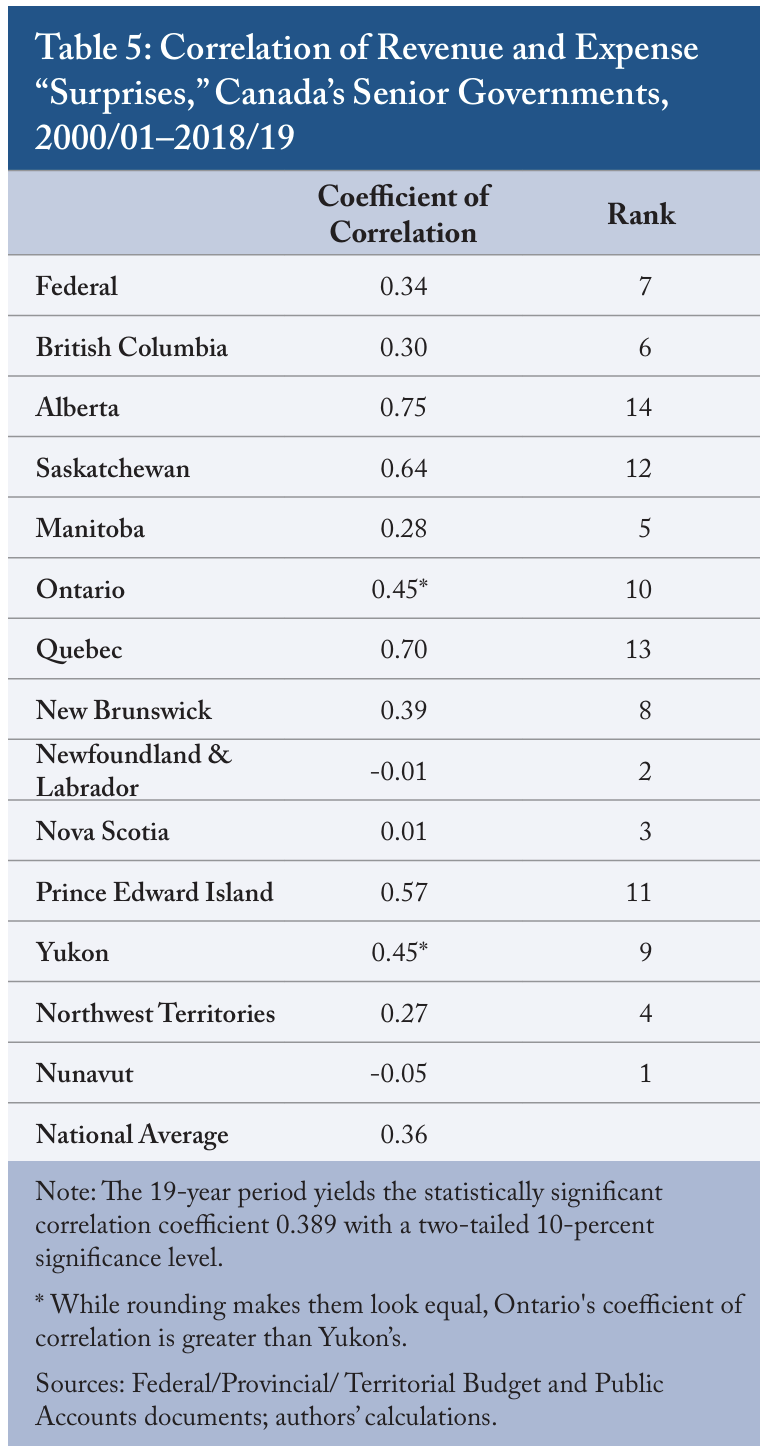
Comparing coefficients of correlations provides insight into fiscal management (Table 5). Negative correlations between in-year surprises are more indicative of good fiscal management and positive correlations more indicative of bad fiscal management.
During the 19-year period we analyze, the correlation between annual overshoots and undershoots in revenues and expenses (coefficient of correlation) was positive. This shows that governments reporting higher-than-projected revenues in a given year typically reported higherthan-expected expenses in the same year and that larger revenue surprises tended to coincide with larger expense surprises (Table 5). The positive coefficient for seven of the governments exceeded the 0.39 figure that standard statistical tests say is significant for this many observations. Only Nunavut and Newfoundland and Labrador recorded negative coefficients.
Governments sometimes justify extra spending during booms on the basis that economic growth attracts people and generates unexpectedly high demand for public infrastructure, schools and other public services. But those impacts affect capital spending more than current spending. Approving and building a hospital or a road takes years, and governments amortize their capital costs, meaning that the associated expenses appear in budgets and financial statements over the period the investments are expected to yield services. Therefore, such capital projects are not a plausible reason for persistent inyear surprises. Predictable impacts of the business cycle on revenues and expenses – a rise in revenues and drop in expenses during booms, and vice versa during busts – are not evident in the financial statements for Canada’s senior governments since 2000/01.
Why Might Revenue and Expense Surprises Coincide?
One possible explanation for the positive correlation between annual in-year revenue and expense surprises is that governments deliberately under-predict revenues. When revenues come in ahead of target as the year unfolds, they react to an emerging better-than-budgeted bottom line by spending more, or by trying to pre-book spending expected in future years.77 Prominent examples of pre-booking occurred at the federal level in the late 1990s and early 2000s. It included transfers to foundations that did not even exist at the end of the relevant fiscal years, prompting a series of complaints from the auditor general (see, especially, Canada 2001, 1.29-1.34).
Another possible explanation for the positive correlation is that governments have a desired bottom-line number and inappropriately recognize revenues and expenses to achieve it. A government headed for a surplus that is bigger than it wants might defer revenue to a subsequent year or book an expense in the current year even when the transaction will not occur until later. A government headed for a deficit when it has committed to balance might do the opposite: recognize revenue earlier than it should or defer an expense.
Since the standard stabilizing prescription dictates a negative correlation between revenue and expense surprises, and since a positive correlation suggests problematic behaviour, we rank the results in Nunavut, Nova Scotia and Newfoundland and Labrador as relatively good, and those in Alberta, Quebec, Saskatchewan, Prince Edward Island, Yukon and Ontario as relatively bad.
Have Fiscal Controls Improved?
The economic climate has changed in many ways over the past 19 fiscal years. Breaking the period roughly into thirds, the first six years featured robust growth, the middle seven saw a financial crisis and slump and the last six were characterized by sluggish growth. Meanwhile, the quality of fiscal reporting has generally improved (Robson and Omran 2020).
What does a comparison of Canadian governments’ performance relative to budgetary targets of revenues and expenses during these three periods suggest about progress or slippage?
Results versus Intentions
At a high level, the story with respect to biases and accuracy is positive. We summarize the bias and accuracy scores for each government over each of the three periods in Table 6. Since our concern is not whether expenses (or revenues) were too high or too low in general, we compare absolute values of biases, treating misses either way as equally problematic.
Our conclusion: most indicators of fiscal management registered better during the most recent six years than during the first six.
On the expense side, bias scores show that fewer governments in the last six years spent more than they budgeted and those that did, did so by smaller amounts. Only the Northwest Territories recorded a larger absolute bias in the last six years than in the first six.
On the other hand, Nunavut, followed by the Yukon and Prince Edward Island, recorded the largest improvements (reductions) in their absolute bias in the last six years. Notably, Saskatchewan, with one of the largest 19-year average expense overshoots, undershot its budget during the last six years with a bias score of -0.8 percent. The unweighted national average of the 14 governments’ absolute biases for expenses dropped from 2.9 percent in the first six years to 2.2 percent in the middle seven and to 1.1 percent in the last six.
The improvement in accuracy of expenses was smaller over the 19-year period, suggesting that some of the bias improvement reflected offsetting errors. It was better in nine of the 14 jurisdictions in the last six years than in the first six, again with the Yukon, followed by Nunavut and PEI, recording the largest improvements (reductions). Manitoba and PEI with accuracy scores around 1.3 percent are the top performers over the last six years. The average of the 14 governments’ accuracy scores was 3.8 percent in the first six years, rose to 4.4 percent in the middle seven years – the years that included the global financial crisis and slump – and dropped to 2.8 percent in the last six years.
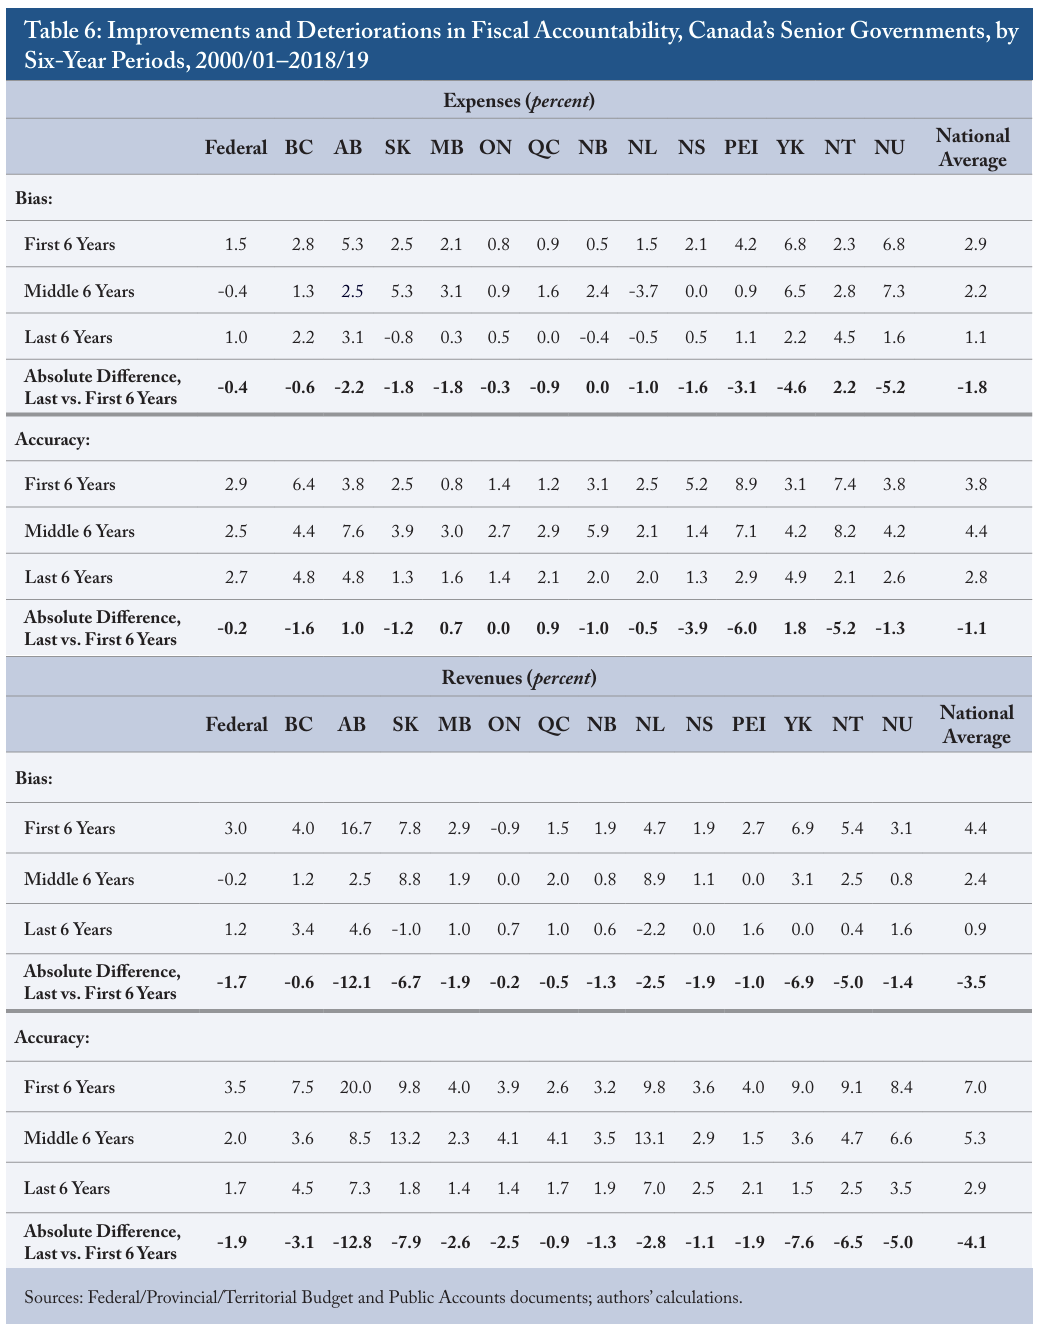
Our measures with respect to revenues show more pronounced improvements. The absolute size of biases was smaller for every government in the last six years than in the first six, with Alberta, followed by the Yukon and Saskatchewan, showing the best improvements. The average across all governments dropped from 4.4 percent in the first six years to 2.4 percent in the middle seven and to 0.9 percent in the last six.
In the last six years, only Newfoundland Labrador and Saskatchewan (both with naturalresource-oriented economies) undershot their budgets. The Yukon and Northwest Territories joined Ontario, Nova Scotia and New Brunswick among the better performers, with annual revenue overshoots (bias scores) in the 0.0-to-0.7 percent range in the last six years, displacing the federal government, PEI and Quebec who were among the top performers over the full 19-year period.
Accuracy scores for revenues also improved everywhere, with Alberta again showing the biggest improvement, followed by Saskatchewan and the Yukon. In the last six years, Manitoba and Ontario, each with scores around 1.4 percent, ranked highest – replacing Ottawa and PEI which had the best (lowest) accuracy scores over the 19-year period – while the Yukon and Saskatchewan joined governments with accuracy scores below 2 percent. The average of the 14 governments fell from 7 percent in the first six years to 5.3 percent in the middle seven and 2.9 percent in the last six.
Correlations between Revenue and Expense Surprises
As we have noted, negative correlations between in-year revenue and expense surprises are more indicative of good fiscal management, while positive correlations are more indicative of bad fiscal management.
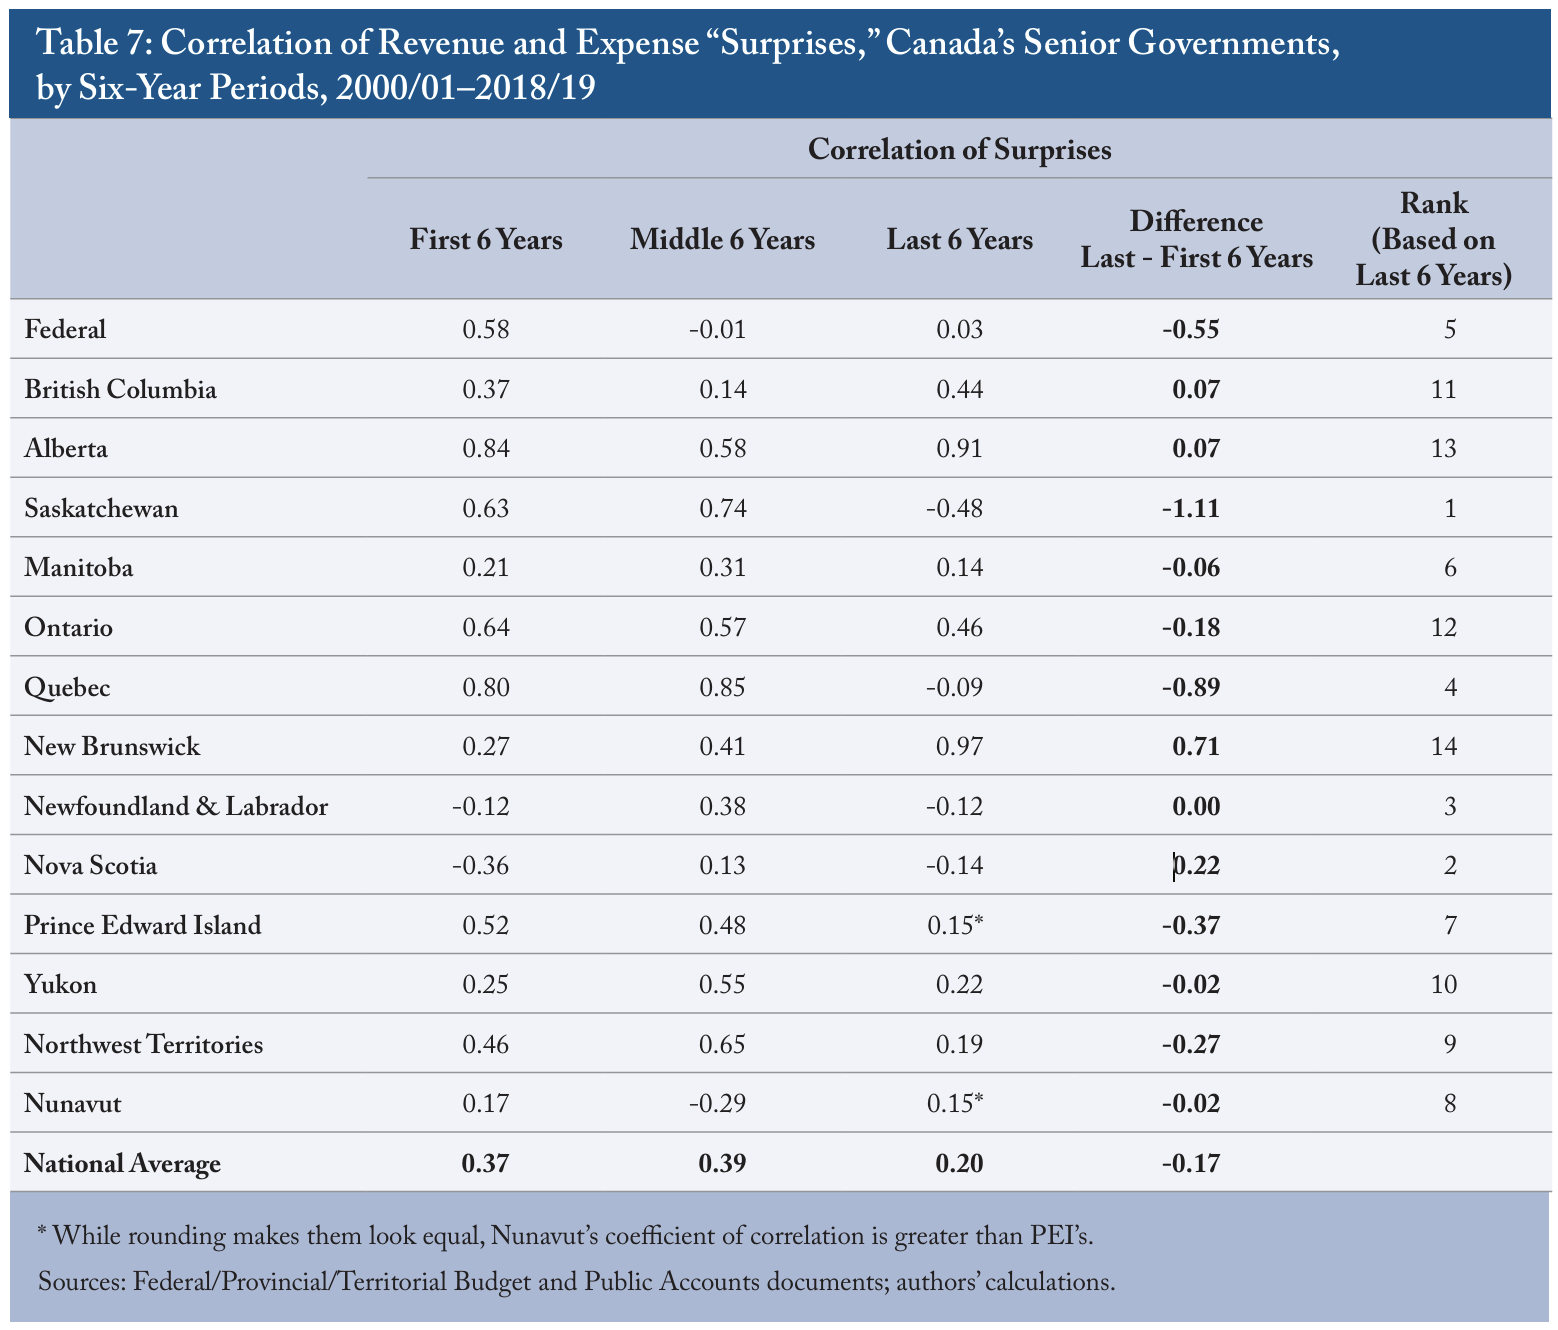
Comparing the differences in coefficients of correlations between the first and last six-year periods during the 19-year span (Table 7) suggests a bad situation has improved somewhat. These coefficients were lower in the last six years for nine of the 14 governments, lowering the overall national coefficient by 0.17 percent between the first and last six-year periods.
However, the reality that 10 of the 14 governments showed positive correlations in the last six years remains disappointing.
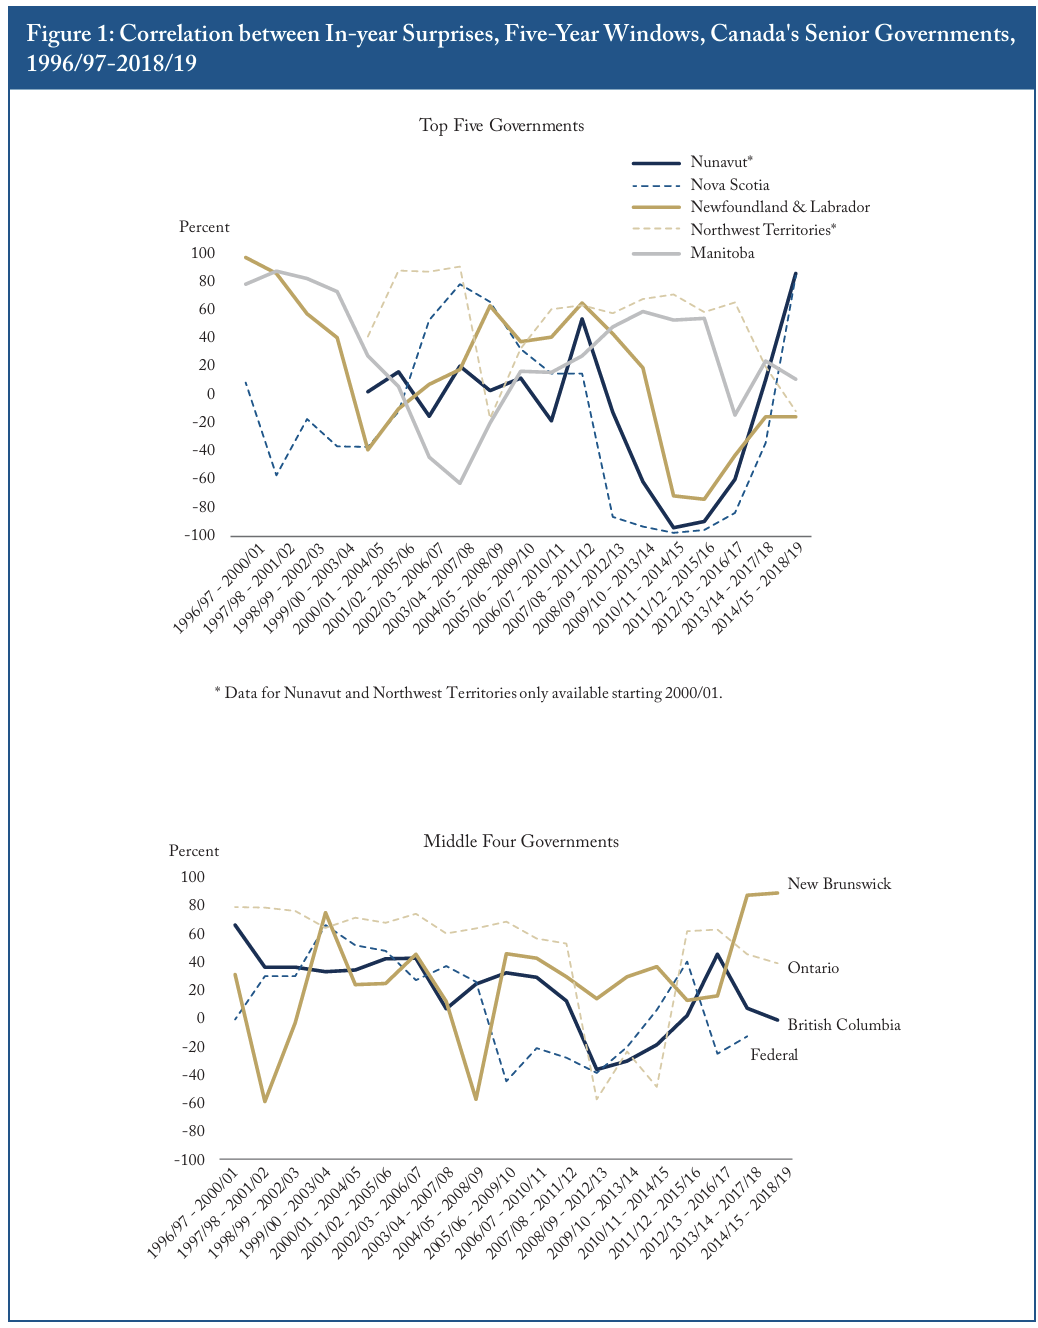
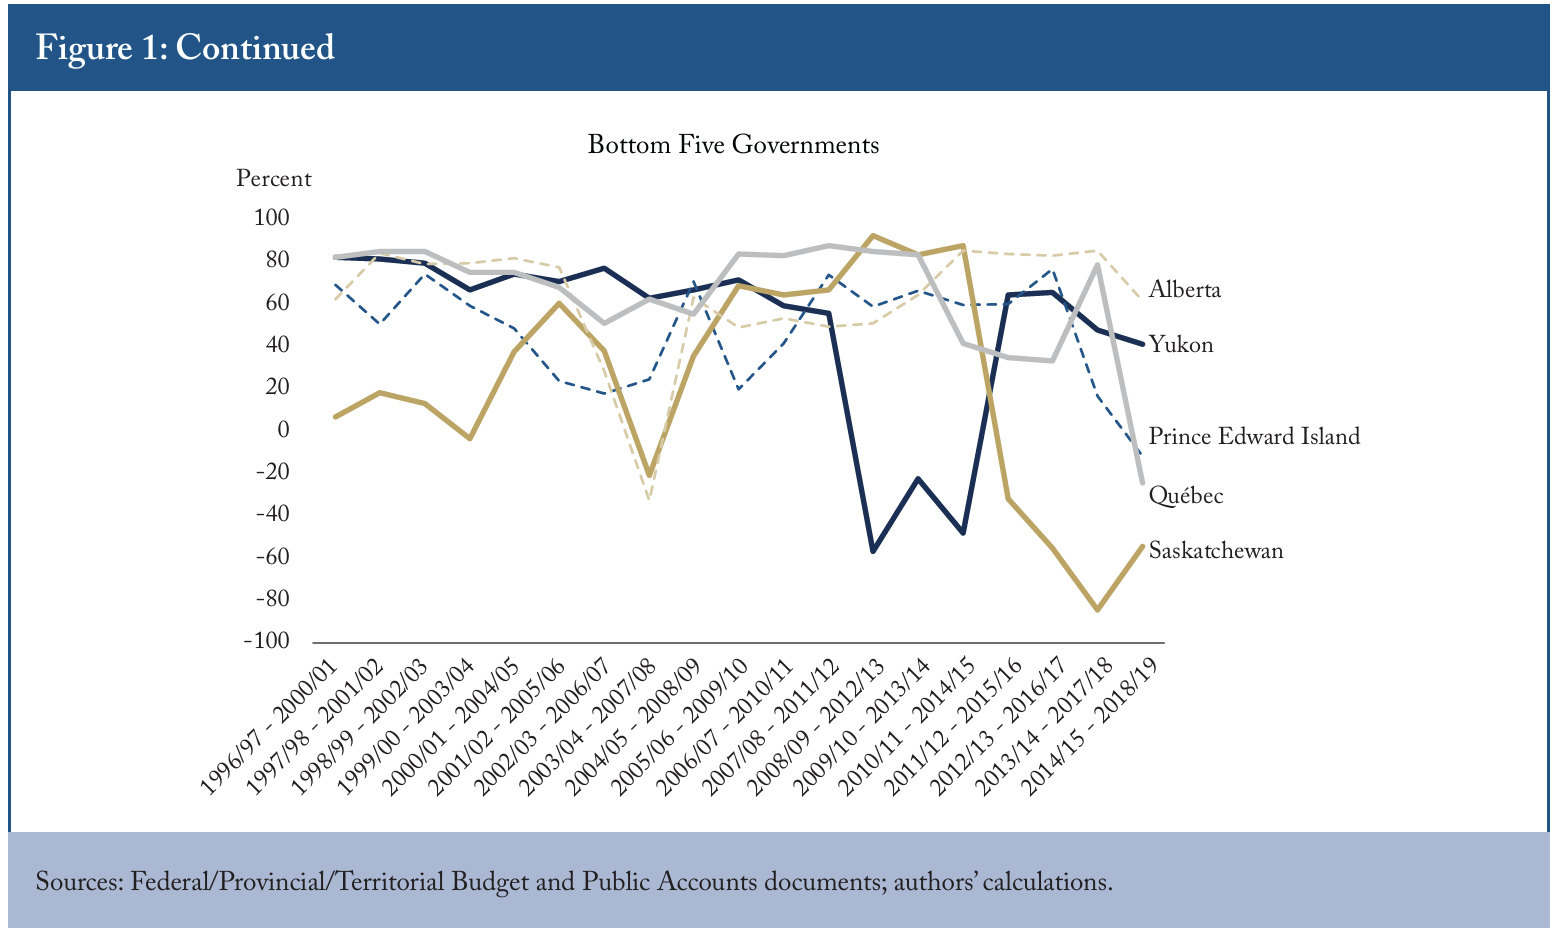
To provide more detail on improved versus more suspicious patterns of in-year surprises over the full period, Figure 1 shows rolling correlations between revenue and expense under- and overshoots for each government, using five-year windows.88 The observations in the figure for 2000/01 record the correlation between in-year surprises over the five fiscal years from 1996/97 to 2000/01, while the observation for 2001/02 records the correlation from 1997/98 to 2001/02, and so on. To repeat, a negative correlation is good, signifying that in-year surprises affected revenues and expenses in opposite directions, and a positive correlation is bad, signifying in-year surprises in the same direction. The top panel of Figure 1 shows the five governments with the lowest correlations (as shown in Table 5), the middle panel shows the four with mid-range results and the bottom panel shows the five with the highest correlations – the ones that raise the most concerns.
Even the two jurisdictions – Nunavut and Newfoundland and Labrador – with scores suggesting good fiscal management (negative correlations between revenue and expense over- and undershoots over the entire 19-year period) (Table 5) do not provide a convincing story of governments resolutely playing a stabilizing role. As Figure 1 highlights, even these two governments frequently exhibited positive correlations (suggesting poor fiscal management) over five-year intervals between 2000/01 and 2018/19.
The numbers across the country have improved recently (as shown in Table 7). It is interesting to note the correlations for the bottom performers over the 19-year period trended down –the good direction – toward the end of the 19 years. Saskatchewan and Quebec are notable improvers. Perhaps in Quebec’s case, the suspiciously positive correlation between revenues and in-year surprises earlier in the period reflected debt pressures and an intense preoccupation with the bottom line and the more recent negative correlation reflected the greater flexibility that fiscal consolidation allowed. And in Saskatchewan’s case, the improvement may relate to its strategy to transition away from its dependence on natural-resource-based revenue. Importantly, though, we have no example of a Canadian senior government persistently pursuing stabilizing fiscal policy over the entire period.
A concerning feature of Figure 1 is that many of the lines trend up – the bad direction – in the most recent years.99 For instance, correlation was moving upward when looking only at the last two years, 2017/18 and 2018/19, in 15 of the 28 observations for all 14 jurisdictions. A glum interpretation of these patterns is that the 2008-2009 financial crisis and slump depressed government revenues and boosted expenses so dramatically that it produced the negative correlation typical of stabilizing fiscal policy even though the problematic influences that normally produce positive correlations persisted. The federal government, for example, played a strongly stabilizing role in the first half of the last decade – but lately it seems to be returning to a pattern of spending unbudgeted revenues.
Below-the-Line Adjustments
Another wedge between the commitments that governments make to legislators and the public and what actually results is adjustments that change a government’s net worth – its accumulated surplus or deficit – in ways not captured by the annual surplus or deficit. These “below-the-line” adjustments are not anticipated in budgets, and therefore escape the formal scrutiny of legislators and others at the beginning of the fiscal year.
“Other Comprehensive Income or Loss” an Obstacle to Understanding
As we discuss in our companion paper on the quality of senior governments’ financial documents (Robson and Omran 2020) there are justifications for these adjustments. Suppose a government discovers that a contingent liability related to cleaning up a long-standing environmental problem is more or less expensive than expected. It might reasonably want to show its impact on its financial position separately from the revenues and expenses it was able to control during the year. Businesses often highlight “extraordinary items” in their earnings for such reasons. Public sector accounting standards prescribe this treatment for certain types of gains and losses.
But businesses can use “extraordinary items” to distract financial statement readers. They imply that the relevant gains – or, more usually, losses – are not representative of the underlying health of the operation. That may be true, but it is not unusual for discrete adjustments in single years to reveal information that should have been disclosed during the years before or that adds to our understanding of the operation’s true viability. We should be similarly attentive to the below-the-line adjustment – usually labelled “other comprehensive income or loss” – in governments’ financial statements.
The accumulated surplus or deficit is the definitive statement of a government’s capacity to provide services. Any change in the accumulated surplus or deficit deserves the same scrutiny that any other element in the government’s revenues and expenses deserves. There is clearly a problem if the annual budget targets show something different from the financial statements. And that is especially true when a below-the-line adjustment distracts attention from something that is within a government’s control. A relevant example is when a government deliberately under-reports expenses related to deferred compensation such as pensions, producing a misleadingly positive bottom line in one year and then later reports the under-reported amounts in a reconciliation item that hardly anyone understands. Another example is carrying on an uneconomic activity through a Crown corporation, moving an expense that would otherwise receive legislative scrutiny out of the budget, with the losses emerging in a relatively opaque reconciliation item.
The Record on Below-the-Line Adjustments
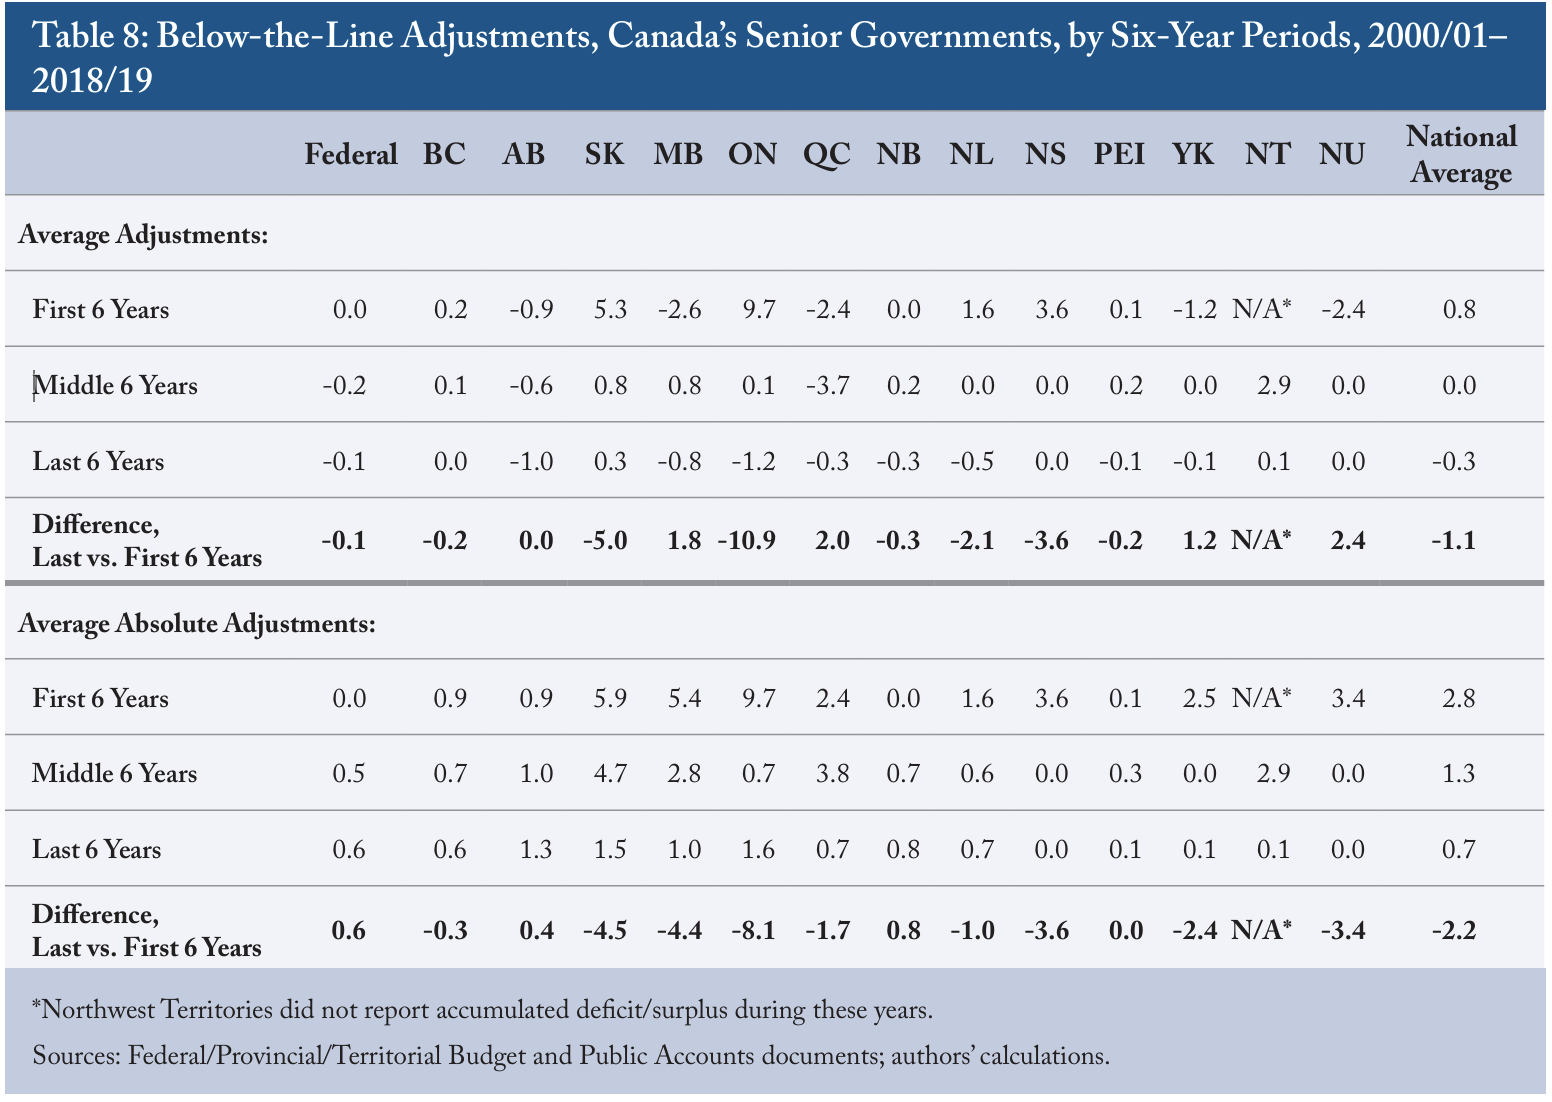
Table 8 summarizes the record of Canada’s senior governments’ below-the-line adjustments over the past 19 fiscal years. It compares the annual surplus or deficit to the change in the governments’ accumulated surplus or deficit during that same year, expressing both relative to expenses in order to facilitate comparison. Like Table 6, Table 8 breaks the period roughly into thirds. The first panel shows the average adjustment over the three periods – similarly to our bias scores earlier, the figures in the panel treat positive and negative adjustments as offsets – and the difference between the first and last periods. The second panel shows the governments’ average absolute adjustments, treating adjustments upward or downward as equally objectionable.
Overall, increases in governments’ accumulated deficits have tended to be larger than the formal bottom-line result in each fiscal year would lead a casual reader to anticipate. Notably, adjustments for “other comprehensive income or loss” have been predominantly negative in recent years. The first panel of Table 8 shows the national average adjustment was 0.85 percent in the first six years and -0.29 percent in the last six years. The good news here is that in absolute terms, the national average adjustments were smaller in the last six years than in the first six, but the bad news is they became more negative for 10 of the 14 governments.
The second Table 8 panel confirms the improving trend in the size of these adjustments: only three governments had average absolute adjustments that were higher in the last six years than in the first six years. The national absolute adjustments were considerably smaller in the last six years – they went from 2.81 percent in the first six years to 0.65 percent in the last six years.
The recent negative adjustments, however, mean that the deterioration in governments’ service capacity in recent years has been worse than the numbers most legislators and the public pay attention to would have led them to expect. The current difficult fiscal environment, including very low bond yields, which make governments’ pension promises more expensive, will be one that tempts governments to engage more in activities that produce below-the-line adjustments. Legislators and commentators will need to watch not just the bottom line but what happens below it.
Improving Fiscal Accountability in Canada
To summarize to this point, we note a tendency in more recent years for Canadian senior governments’ end-of-year results to match their budget targets more closely and, more tentatively, we note somewhat less of a tendency for their revenue over- and undershoots to coincide with expense over- and undershoots. But these improvements, if they are real, are relative to a poor baseline of chronic overshoots and suspicious positive correlations between in-year revenue and expense surprises. While below-the-line adjustments have tended to get smaller over the years, they are chronic and most of the more recent ones have been negative, signalling less positive outcomes than suggested by the reported surpluses and deficits.
The COVID-19 crisis has been so severe that it will produce at least one year when revenues are markedly below, and expenses spectacularly above, what governments budgeted. In that respect, we can look forward to one positive result in future iterations of this report – revenue and expense surprises in opposite directions. But that repetition of the 2008-2009 financial crisis impact on our figures might be a blip. Upcoming fiscal pressures may increase the temptation for governments to mislead with their targets, “manage” their bottom lines and use below-the-line adjustments to obscure information they wish to hide. We close with some thoughts about how to ensure that Canadians can have more confidence in the budget commitments of their federal, provincial and territorial governments.
Healthy Finances and Sound Fiscal Plans
Two chronic problems that we have identified – major overshoots of revenues relative to budget targets, and in-year spending, or aggressive accounting, to reduce the resulting better-than projected bottom-line – arise more often when governments are under fiscal pressure and the focus on the end-of-year surplus or deficit is intense. As Ottawa did so conspicuously in the late 1990s and as most provinces have done most of the time, Canada’s senior governments project revenues conservatively in their budgets, which betrays concern about a credible and achievable bottomline target and indicates possible efforts by finance officials to restrain spending departments.
However well this tactic works in the run-up to the budget, its power dissipates as revenues come in above target and its defects come to the fore. A bottom-line target is usually important in determining a government’s spending plans. Positive in-year revenue surprises will undercut the finance minister’s ability to hold the line during the year. And if a much-larger-than-projected surplus threatens to undercut the minister’s ability to hold the line in the future, the temptation to reduce the surplus with last-minute spending – or booking future spending in the current year – increases.
This pressure seems likely to be less severe when a government’s fiscal health is not a high profile concern. By the time of the 2008-2009 financial crisis and resulting recession, the federal government’s finances were in much better shape than had been the case in the 1990s. With less need to show specific bottom-line results, Ottawa had latitude to respond to the crisis with traditional countercyclical policies. So we see positive (bad) correlations between in-year surprises on the revenue and expense sides in previous years give way to negative (good) ones later on.
Perhaps a lack of pressure to achieve a given bottom-line target helps explain why the territories – whose record in hitting revenue and expense targets is poor, but whose balance sheets are relatively healthy and have the federal government as a backstop – have less suspicious correlations between in-year revenue and expense surprises than most other senior governments.
An alternative for a government under scrutiny for its borrowing and debt is to use a more middle-of-the-road revenue projection and aim for a healthier surplus that can withstand some disappointment. Including a contingency reserve in spending to further protect the budget balance against adverse developments is open to objections that it legitimates a spending surprise in advance, but a contingency reserve is more transparent than a low-balled revenue forecast and is less likely to produce problematic positively correlated revenue and expense surprises.
As for below-the-line adjustments, it is reasonable for readers of corporate or not-forprofit financial statements to infer that a problem exists when there are persistent differences between highlighted bottom lines and the changes in the organization’s net worth. For example, if a government has a Crown corporation that is routinely running large losses, it should either mitigate its exposure or ensure that the required subsidy shows up in expenses and, therefore, in the budgeted and actual surplus or deficit. Governments in better fiscal shape will have less incentive to massage their numbers. For both businesses and not-for-profits, a solid foundation for transparency is having nothing to hide.
Fiscal Transparency and Accountability
Legislators and voters should do more to hold governments to account for the revenue and expense targets they set, for their record in hitting them, and for consistency between their reported bottom lines and changes in their net worth. Four examples of holding governments to account follow, in the order in which various events occur during a government’s annual fiscal cycle.
A critical update on the current fiscal year comes when the government presents its budget for the following year. The preliminary outcomes for total consolidated revenues and expenses for the prior fiscal year about to end provide vital information about what the government has done and expects to do. If the government is on its way to overshooting revenue and/or expense targets from the prior budget, those projected outcomes are among the most timely and important indication of problems. Yet it is the budget targets for the upcoming year – which, as this report documents, are far from reliable – that get all the attention. The interim numbers for the prior year deserve much more scrutiny from legislators, analysts and the public.
Secondly, legislative and public scrutiny is also weaker than it should be when it comes to the spending estimates that require legislators’ approval. In many jurisdictions, legislators cannot easily see if what they are authorizing when they vote on the estimates is consistent with the fiscal plan. In some cases, governments present estimates using cash accounting, which is incompatible with the accrual accounting now typical in budgets and financial statements. Another discrepancy arises when the estimates are prepared using similar accounting to the budget but using a different aggregation of spending types without explaining how these estimates fit within the aggregated budget. Another problem arises when legislators are asked to authorize spending before they have seen the budget or to authorize spending that is no longer consistent with the fiscal plan.
All senior governments should release their main estimates simultaneously with the budget and should use the same accounting methods in both, showing clearly how the proposed spending that legislators are voting on aligns with the overall fiscal plan. The need for legislatures to consider the estimates in the context of the overall fiscal plan applies with equal force to the supplementary estimates that authorize spending later in the fiscal year. These, coming at irregular intervals when legislatures are occupied with other matters, get even less scrutiny than the main estimates, yet they are no less critical to determining if the government will hit its budget targets. In this regard, general contingency reserves or reserves for specific events such as a natural disaster are a more transparent way to protect a planned budget surplus from adverse events than low-balling revenue. But the transparency is only as good as the use legislators make of their power to scrutinize spending. Otherwise, contingency reserves can become slush funds to cover spending that would not otherwise pass inspection.
A third element that allows for holding governments to account is the timely publication of interim and final results. Like any organization, a government trying to hit fiscal targets in the face of unexpected developments needs timely information to adjust course. Speed in assembling the information that appears in periodic financial updates and in the audited financial statements would improve the prospects for a realistic budget plan – including the critical but typically neglected figures for the current year.
There is no good reason financial results for the year ending on March 31 should still be a mystery more than three months later. Some governments release their financial statements quickly – Alberta requires financial statements before the end of June – but most receive their auditor’s approvals and produce their reports far later (Robson and Omran 2020). With modern information technology, there is no reason all senior governments could not publish quarterly or even monthly reports and release their audited financial statements as early as June 30 and certainly no later than August 30.
Timely updates and publication of audited numbers would provide legislators, commentators and voters better opportunities to spot deviations between budget targets and results while it is early enough to do something about them, and to insist on budgets that address problems such as chronic under-budgeting of revenues that this scrutiny reveals.
Finally, public accounts committees, legislators generally and other readers of government financial statements need to focus harder on below-the-line adjustments. Lines such as “other comprehensive income and loss” have their justifications, but there are more reasons to dislike them. When they are large, persistent and negative, it is reasonable to ask if they are truly the result of circumstances out of governments’ control.
For example, with COVID-19 having driven bond yields to new lows, the cost of deferred compensation such as pensions has gone up. Governments will be tempted to under-record these obligations as they accrue, lowering their operating expenses, and report the negative adjustments below the line, as though they were unforeseeable accidents. Such practices will undermine the usefulness of financial statements for Canadians trying to understand how governments’ actions year-by-year are affecting their capacity to deliver services in the future.
Canada’s Senior Governments Will Have to Do Better
Canadians need more transparency and accountability in the fiscal policies of the governments that tax much of their income to deliver costly programs. Our investigation reveals that while Canada’s senior governments have improved their stewardship of public money over the past 19 fiscal years, chronic overshooting of both revenues and expenses continues. The suspicious positive correlation of in-year revenue and expense surprises, and the tendency for governments to show negative below-the-line adjustments in recent years, suggest that control of public funds still leaves much to be desired.
Most governments, most of the time, seem to be more intent on managing their annual bottom line than on stabilizing their economy, tax rates and programs. For all the attention budgets receive and the formal legislative accountability that surrounds both budgets and the estimates that authorize spending, governments’ budget targets are less reliable than they should be. For all the scrutiny they receive from legislative auditors and public accounts committees, financial statements are often published later and are less informative than they should be.
The unprecedented peacetime spending and borrowing triggered by the COVID-19 epidemic and related economic stresses have raised the stakes. More than ever, legislators and voters should demand that Canada’s federal, provincial and territorial governments improve their budgeting processes and their transparency about how well, or badly, they have achieved their budget commitments.
References
Canada. 2001. Receiver General of Canada. Public Accounts of Canada, 2000-2001. Ottawa: Minister of Public Works and Government Services. September.
Ferguson, Michael. 2017. “Why is more attention not paid to government financial statements?” Presentation to the CPA Canada Public Sector Conference. Ottawa. October 23.
Jochimsen, Beate, and Robert Lehmann. 2015. “Do OECD Countries Cheat with Their National Tax Revenue Forecasts?” Annual Conference 2015 (Muenster): Economic Development –Theory and Policy 113089, Verein fur Socialpolitik I German Economic Association. March. Available at: https://www.econstor.eu/bitstream/10419/113089/1/VfS_2015_pid_766.pdf.
Robson, William B.P., and Farah Omran. 2020. The ABCs of Fiscal Accountability: Grading Canada’s Senior Governments, 2020. Commentary 577. Toronto: C.D. Howe Institute