





by Adam Found and Peter Tomlinson
- Before a business decides to locate or expand in a given jurisdiction, it must consider the tax implications of such an investment. Heavy tax burdens reduce potential returns, driving investment away to other jurisdictions and, with it, the associated economic benefits. Interjurisdictional comparisons of tax regimes are, therefore, important for businesses and the governments that seek to attract and retain them.
- Yet such comparisons are challenging because there are gaps in the way Canadian governments and analysts measure the overall tax burden on business investment, primarily because they exclude business property taxes. As in previous editions, we find this omission to be of major significance: business property taxes account for about half the total tax burden on business investment in the municipalities we examine.
- In this edition, we incorporate Canada’s Accelerated Investment Incentive, which the provinces have mirrored in their corporate income tax regimes. While this temporary measure tends to make certain forms of industrial corporate income taxation more competitive, we find it yields only a modest increase in overall business tax competitiveness.
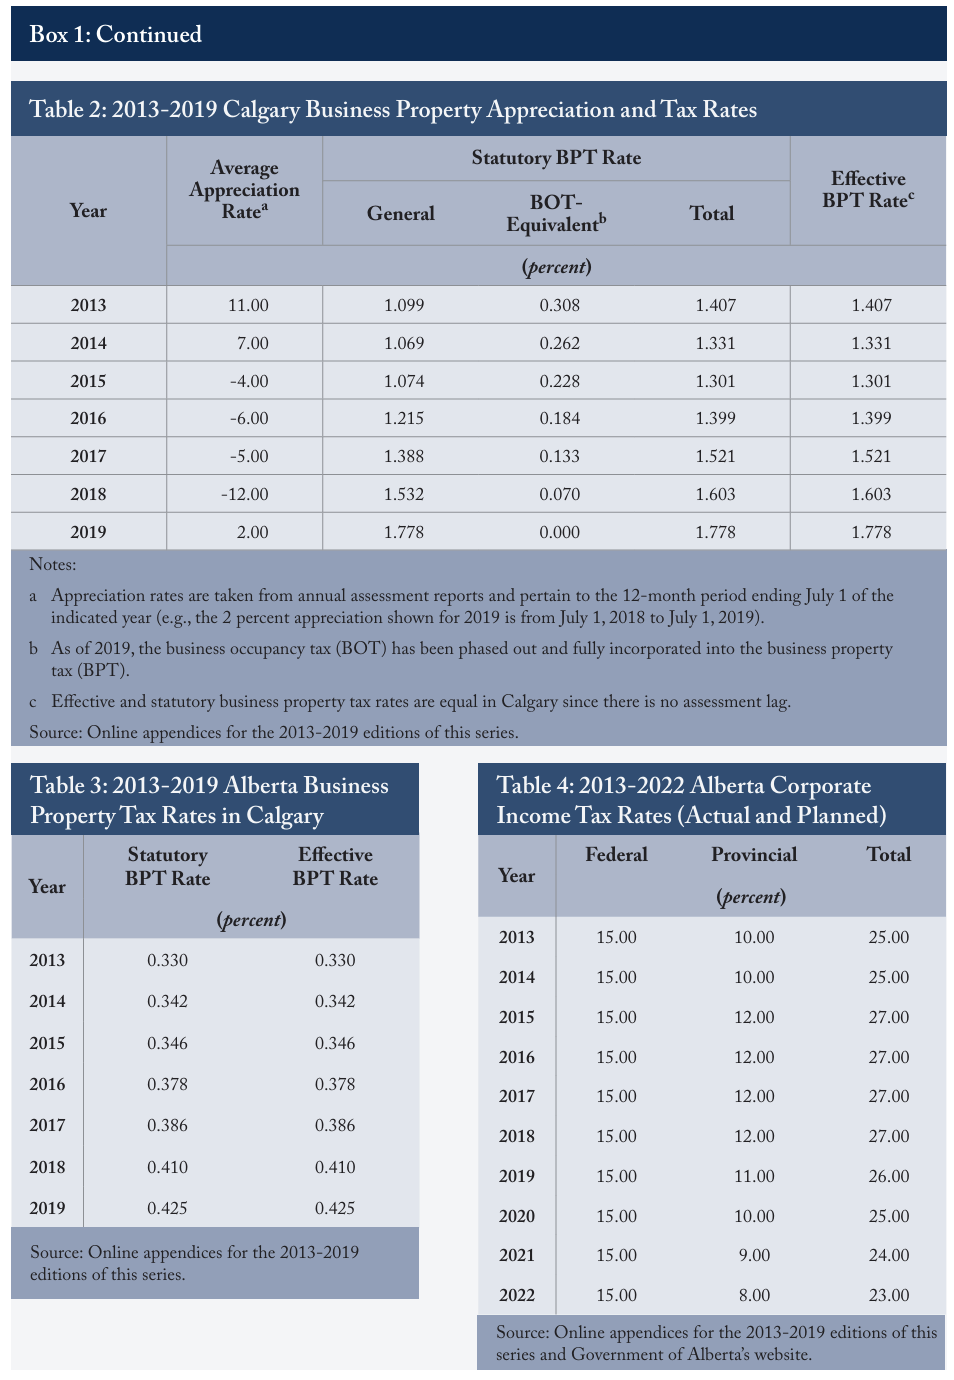
- Calgary’s experience with depreciating property values is discussed in this edition. Starting in 2015, demand for downtown office space in Calgary fell dramatically, even as new construction greatly increased supply. Assessed values of downtown office buildings depreciated rapidly, causing unmanageable tax shifts onto other businesses. The city decided to forgo revenue in order to mitigate the tax increases, but tax rates still had to go up. Downtown office building values finally bottomed out by 2019, so the tax shift is no longer growing.
- Also, new to this edition are charts showing provincial marginal effective tax rate (METR) estimates. These estimates incorporate all federal and provincial taxes, including provincial property taxes and land transfer taxes, while omitting the municipal taxes incorporated in our main METR estimates. Our results show that METR estimates that exclude provincial property taxes, for example the estimates in Ontario’s 2019 budget, are unjustifiably too low for provinces that levy such taxes.
Governments across Canada have made it a policy priority to reduce the METR on new business investment.11 While many factors – such as agglomeration economies, climate, business taxes and public service benefits – affect inter-jurisdictional competitiveness for investment, the METR is designed and intended only to measure general business tax competitiveness. By incorporating various business taxes, the METR is a widely accepted composite measure of the burden business taxation places on new investment.22 The METR measures the percentage of the gross-of-tax return needed to pay business taxes on the marginal investment. For example, if the minimum acceptable rate of return on investment net-of-tax is 6 percent, and if investors need a gross-of-tax return of 10 percent to pay taxes and leave shareholders with a 6 percent return, net-oftax, the METR would be (10 – 6) / 10 = 40 percent. Readers interested in model parameters and data in addition to information outlined in the online appendix are invited to contact the authors through the C.D. Howe Institute. As Canadian capital markets are small relative to the worldwide market, if the cost of investing in a particular Canadian jurisdiction is higher than the cost of investing elsewhere, that jurisdiction’s capital stock will be smaller than it otherwise would be. The higher the METR, the greater the investment loss and overall economic harm (Amatov 2015, Bird et al. 2012, Dahlby and Hassett 2016, Gale et al. 2015, Enami et al. 2020, Found 2017, Giroud and Rauh 2019, Hassett and Hubbard 2002, Hassett and Newmark 2008, Ojede and Yamarik 2012 and White 1986).
In this E-Brief, we build on earlier editions in this six-year-old series by estimating the 2019 METR for the largest municipality in each province by focusing on corporate income taxes, retail sales taxes, land transfer taxes and business property taxes. As with similar analyses, our METR calculations reflect general rates of business taxation and exclude taxes not directly related to capital investment cost.33 For example, value added taxes (e.g., Ontario’s HST), payroll taxes, pension contributions, employment insurance premiums and municipal user fees do not directly affect capital investment costs. However, we include – to the extent possible – tax-based incentives such as investment tax credits and capital cost allowance deductions from corporate income. These features form part of the business taxation system and, therefore, directly affect investment decisions. Generally aligned with the modelling framework developed in Found (2014), our METR findings reflect the tax burden on a hypothetical investment that has the same net-of-tax return regardless of where in Canada it is located.
After 2006, the federal government and many provinces reduced business taxes – such as those on corporate income, retail sales and corporate capital stock. However, widely published METR estimates still exclude business property taxes, which are not only salient to investors but also considerably increase the rate of return an investment must yield to be economically viable. We again find that business property taxes account for about half the total METR on corporate investment, a share much too large for METR analysts and Canadian governments to continue overlooking.
Business Property Taxes
An investment located within a province is also located within a municipality.44 The exception is when the investment is located in an area without municipal organization. Therefore, potential investors must consider local business tax burdens as much as those imposed by provincial and federal governments when considering alternative locations. Given the predominance of business property taxes at the local level, METRs that include these taxes paint a more accurate and complete picture of business tax competitiveness than METRs that exclude them. Likewise, METRs are more comparable across jurisdictions when provincial business property taxes are included, regardless of whether municipal taxes are also included.
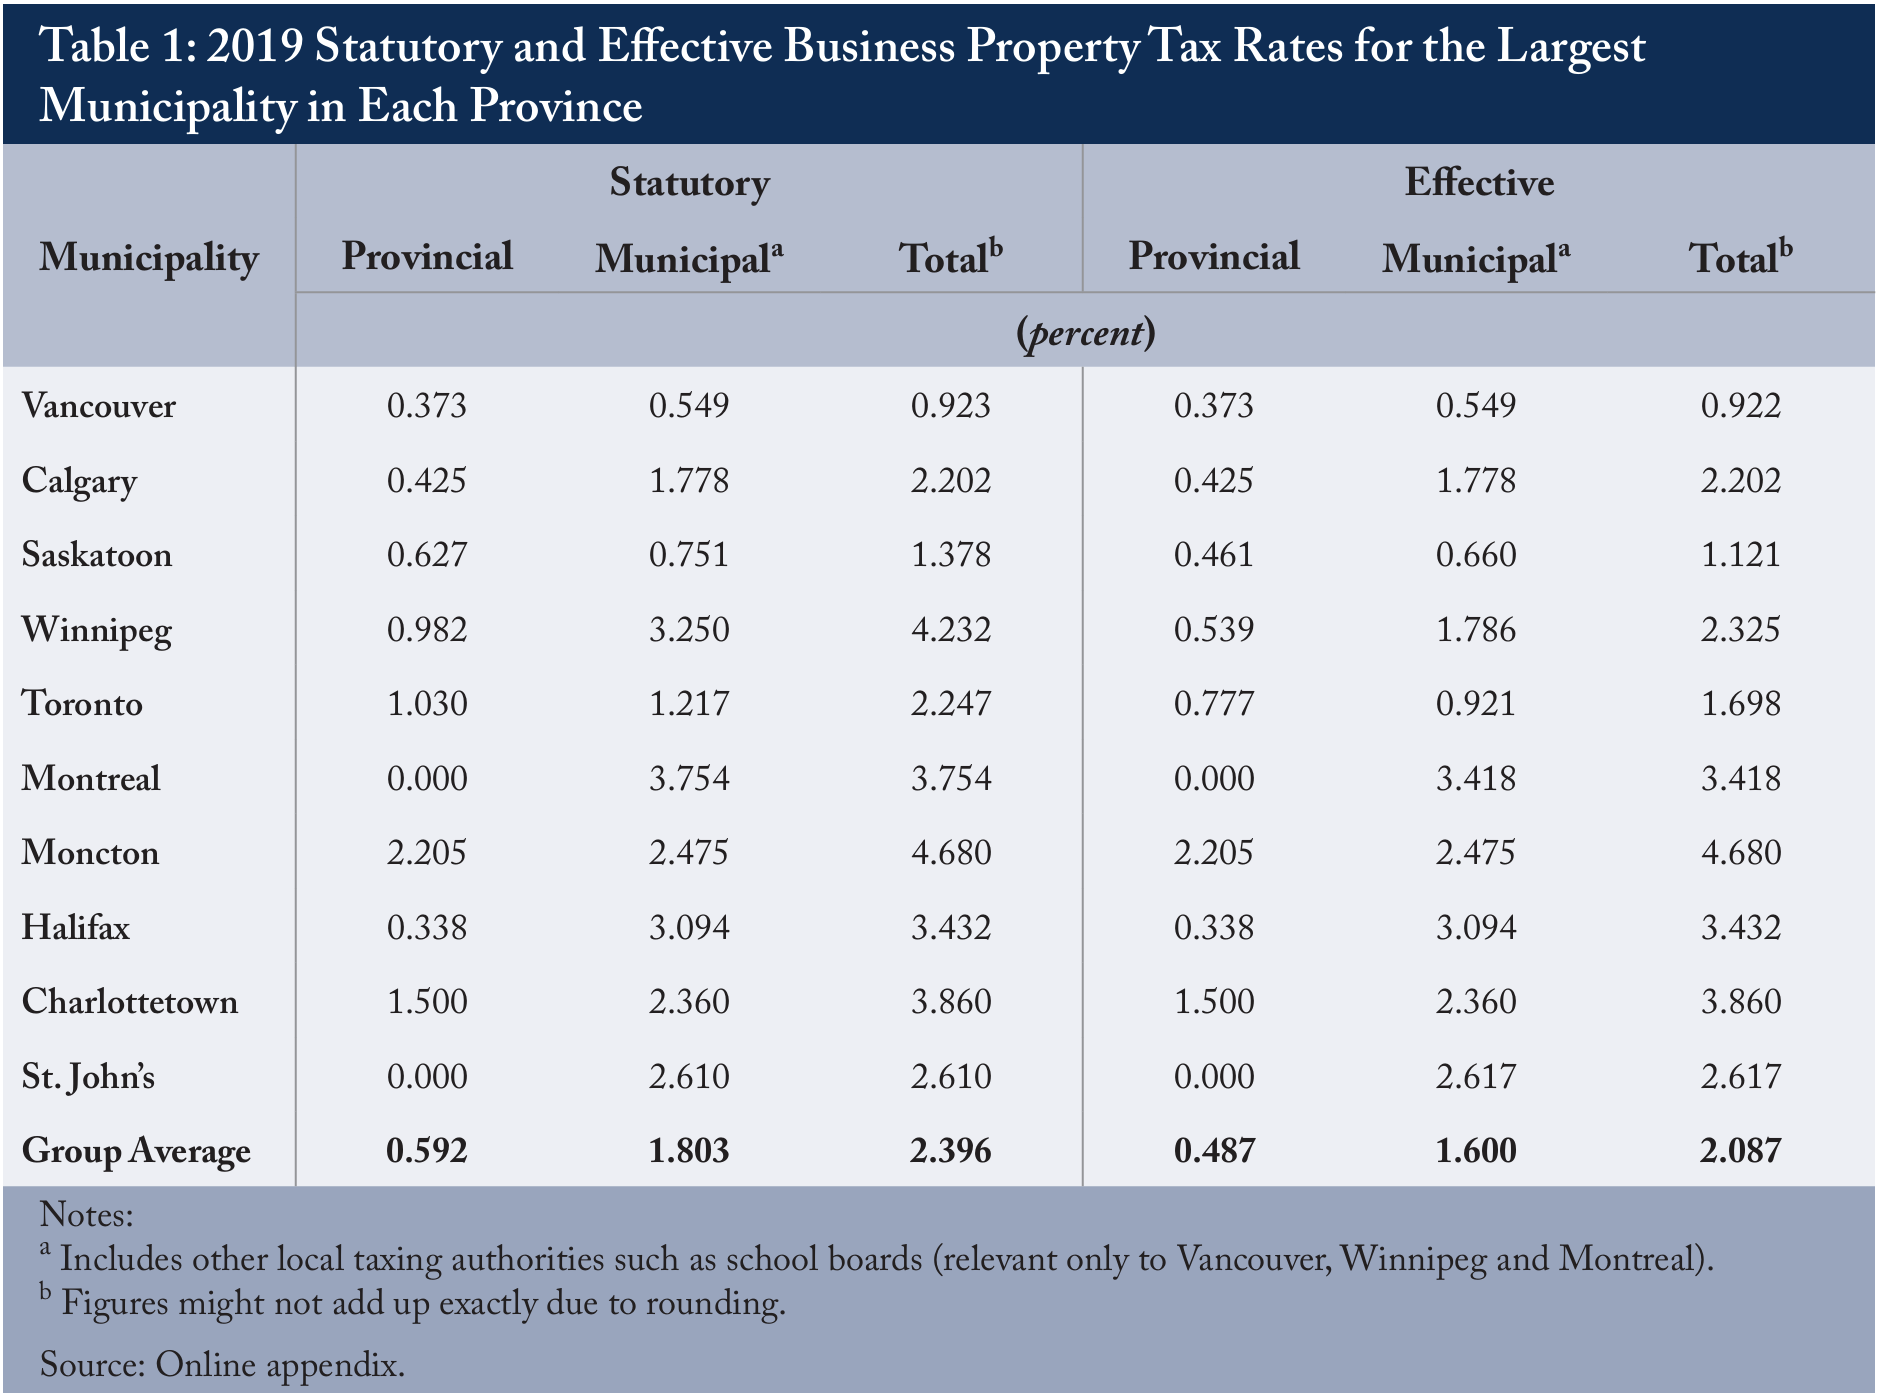
Provinces often structure their business property tax systems such that effective tax rates differ from their statutory counterparts.55 The difference between the statutory and the effective tax rate is illustrated by the following example. Suppose an investor owns real property that buyers would pay $100 million to purchase. Due to lagged assessment, the property is assessed at $80 million. The statutory tax rate – the rate applied to the property’s assessed value – is 2 percent, resulting in a tax burden of $1.6 million per year. However, the effective tax rate – the tax as a percentage of the market value of the property – is only 1.6 percent ($1.6 million divided by $100 million). Although each provincial and local property tax regime is unique, we have developed a standardized approach to transforming statutory business property tax rates into estimated effective rates (Table 1).66 As is done to calculate group average METRs, group average tax rates are calculated by weighting individual rates by corresponding provincial corporate capital investment shares. Similarly, and as shown in the online appendix, business property tax rates in Table 1 are assessment-weighted averages across business property classes (where applicable). In some cases, even the calculation of average statutory business property tax rates is fairly involved, as indicated in the online appendix.
We continue to include business occupancy taxes in the METR as their negative investment impact is equivalent to that of business property taxes – whether the legal incidence falls on property owners or on tenants is irrelevant. As of 2019, Calgary has phased out its business occupancy tax and fully incorporated it into its business property tax. Among our 10 municipalities, only Winnipeg still levies a business occupancy tax. By contrast, we continue to exclude business improvement area levies from the analysis, since funding raised by such levies is allocated not by governments, but by boards directly accountable to member businesses.
Impact of Business Property Taxes on the METR
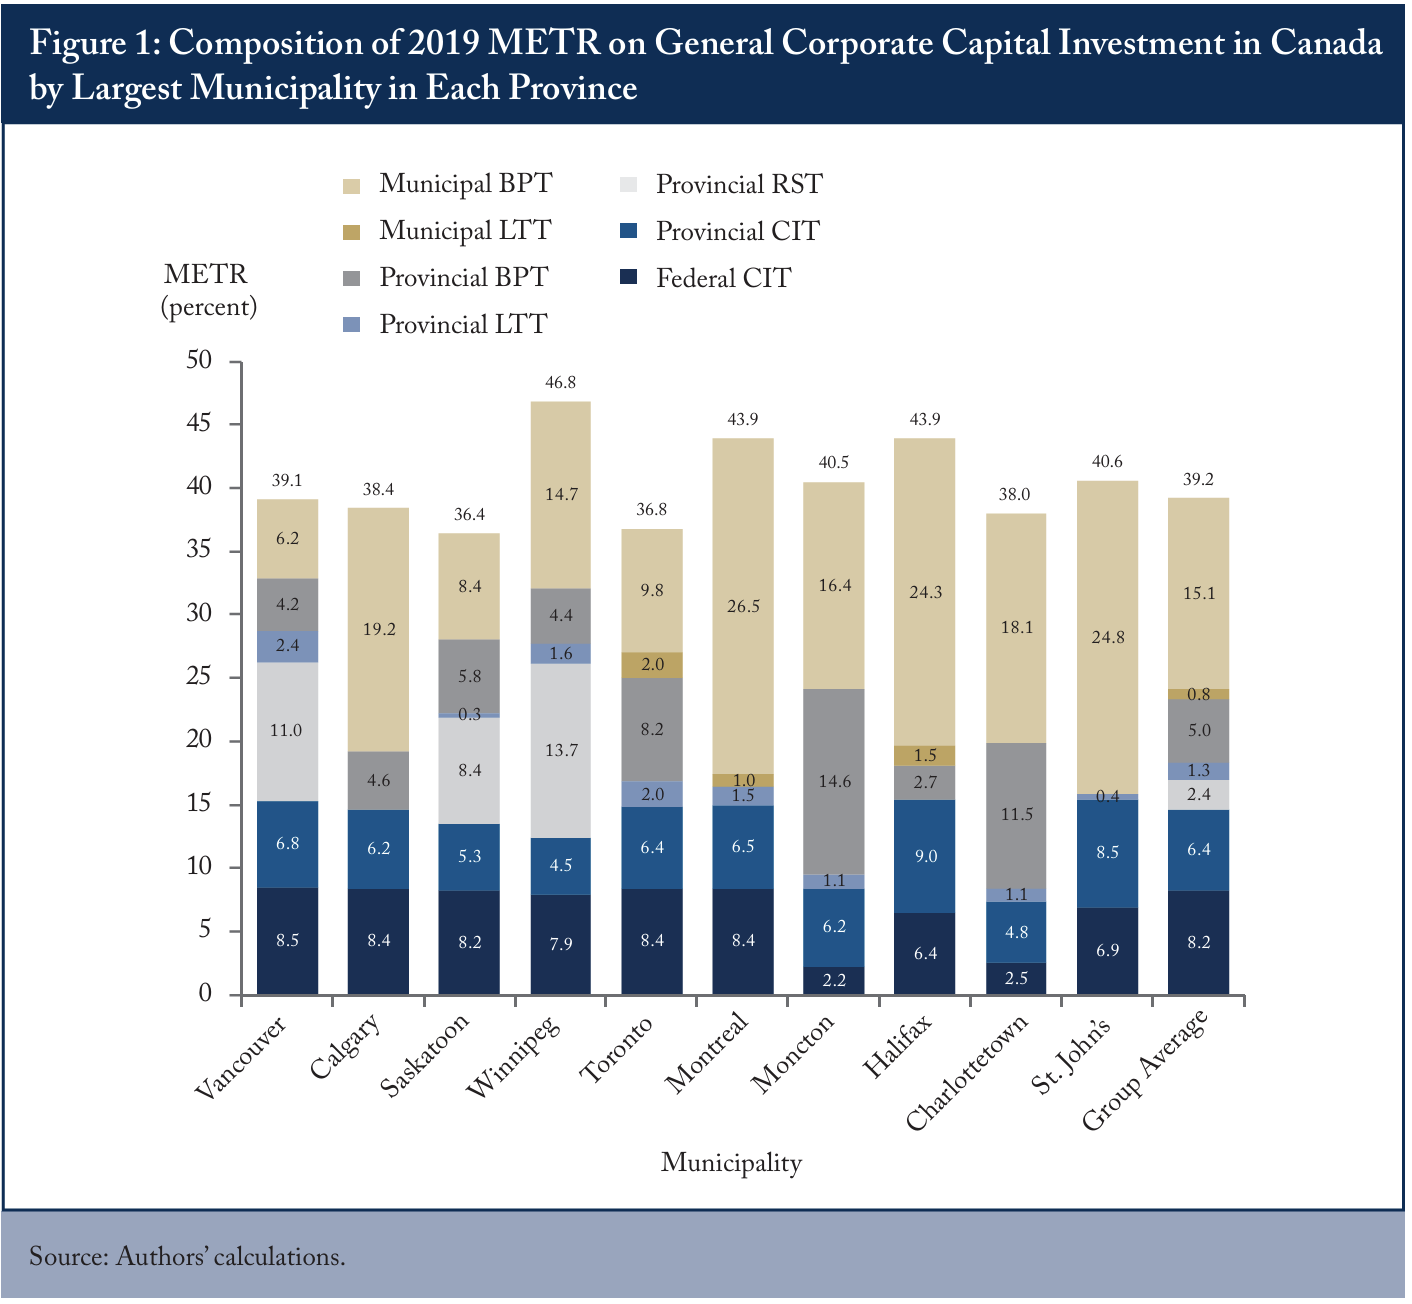
Aside from our own, Canadian METR estimates indicate that the four Atlantic provinces have by far the lowest METRs.77 The acronyms for taxes appearing in Figures 1-4 are defined as follows: corporate income tax (CIT), retail sales tax (RST), land transfer tax (LTT) and business property tax (BPT). However, after incorporation of business property taxes, such a conclusion no longer holds (Figure 1). We find that, rather than significantly lower, the weighted-average METR for the largest municipalities in the Atlantic provinces (41.4 percent) is higher than that for the other municipalities in our group (39.1 percent). While Saskatoon enjoys the most competitive position, it is followed fairly closely by Toronto, Charlottetown, Calgary and Vancouver, with the latter at the group average. Above this average are Moncton, St. John’s, Halifax Montreal and Winnipeg. Moreover, we find that business property taxes on average account for more than half the METR for our 10 municipalities (20.1 percentage points out of 39.2).
The largest provincial tax burdens are in British Columbia, Manitoba and Saskatchewan, followed by Ontario, New Brunswick and Prince Edward Island. In all these provinces, provincial business property taxes are substantial barriers to business investment, and retail sales taxes in the first three remain even larger barriers still. Newfoundland and Labrador has the most competitive provincial business tax regime, followed by Quebec, Alberta and Nova Scotia. Meanwhile, provincial and federal corporate income taxes still weigh heavily on business investment across Canada.
As for municipal business tax burdens, they are highest in Montreal, Halifax and St. John’s, while near the group average (17.3 percent) in Calgary, Charlottetown and Moncton. Vancouver showcases the most competitive municipal business tax environment, followed by Saskatoon, Toronto and Winnipeg.
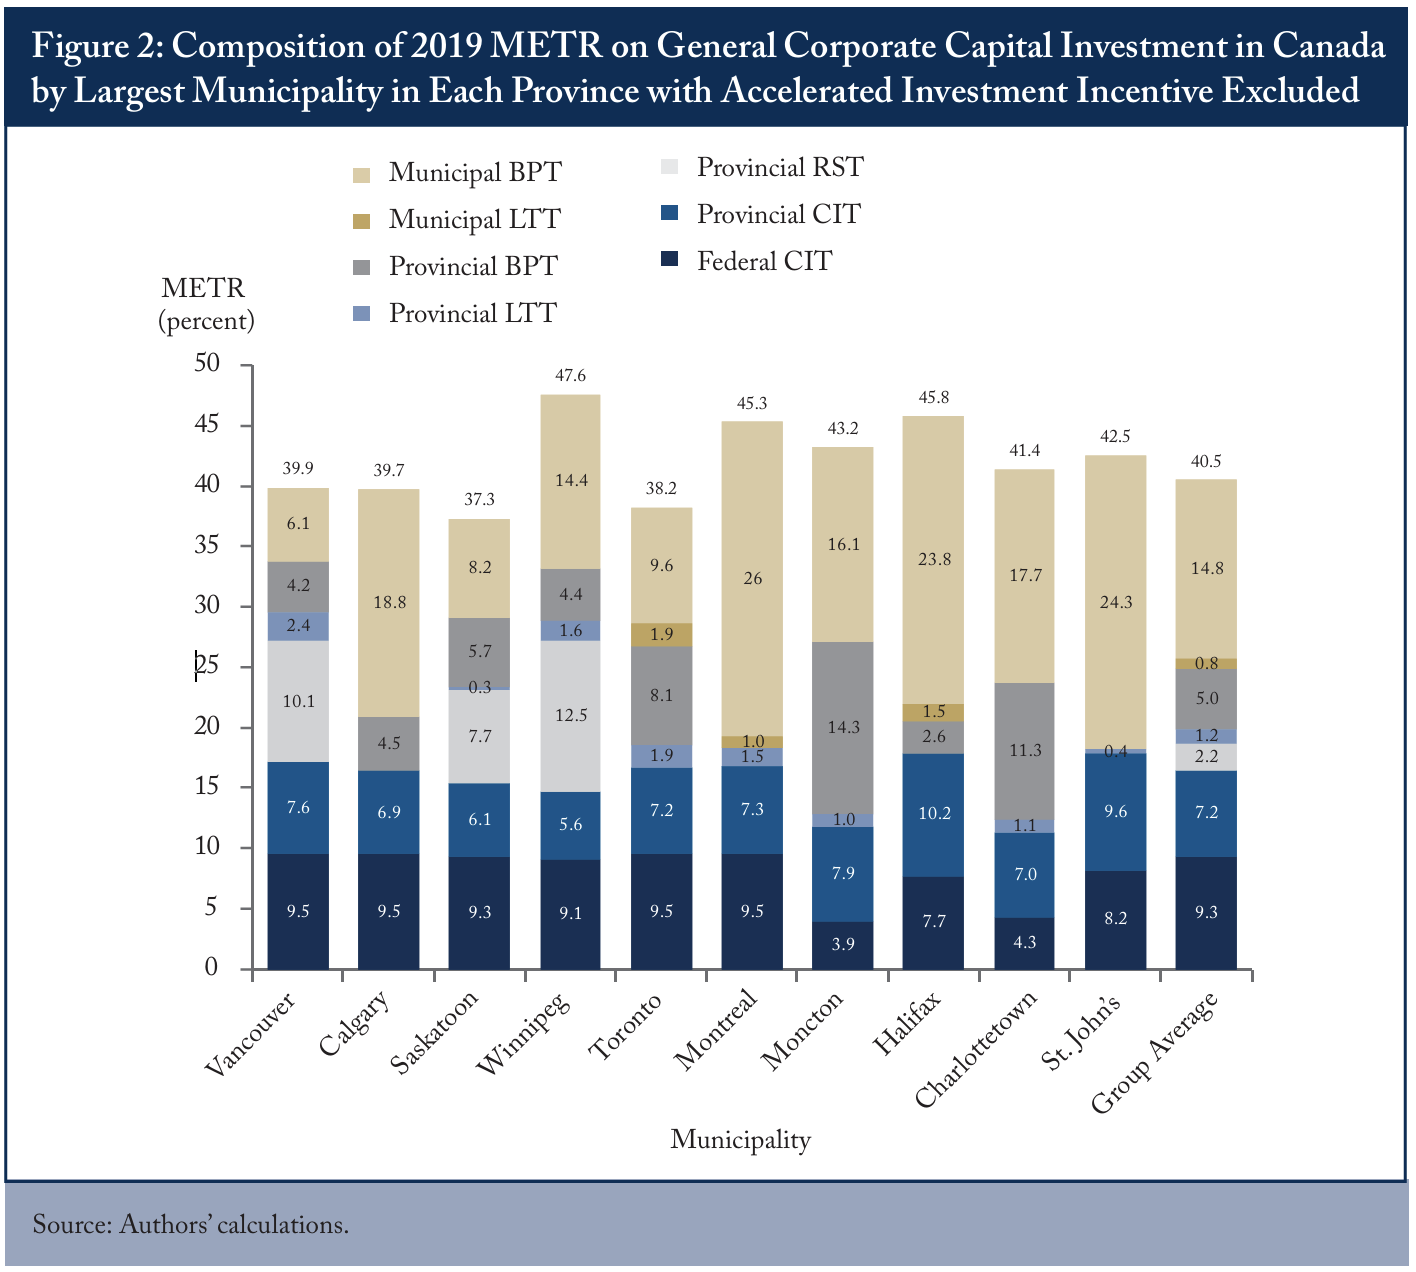
Largely in response to the 2018 tax reform in the US, Canada has adopted the Accelerated Investment Incentive (AII), which enhances capital cost allowance (CCA) provisions for corporate capital investments made and put into use between Nov. 21, 2018 and Dec. 31, 2027. For comparison purposes, Figure 2 shows hypothetical METRs with the AII removed. The AII increases to 100 percent the first-year CCA rate for machinery and equipment used for manufacturing and processing, and it multiplies first-year CCA rates for other capital classes by a factor of 1.5 or three (the factor applicable to buildings is three).
All 10 provinces have mirrored the AII in their corporate income tax regimes (Bazel and Mintz 2019). In comparing Figures 1 and 2, we nonetheless find that the AII provides for an average METR decrease of only 1.3 percentage points (from 40.5 to 39.2) and note the following factors explaining the modesty of this reduction in the overall business tax burden:
- CCA Inapplicable to Non-Depreciable Capital: The CCA is inapplicable to non-depreciable capital, namely land and inventories. Therefore, CCA acceleration has no effect on the METR components related to land and inventories, which represent 42.6 percent of corporate capital investment.88 See the online appendix for corporate investment shares across capital classes.
- Minor CCA Acceleration for Buildings: CCA rates applicable to buildings have tripled for the first year of asset use, while regular CCA rates continue to apply in subsequent years. As buildings are longlived assets with relatively low regular CCA rates, a tripling of only the first year’s CCA rate lowers only marginally the effective burden of corporate income taxation on buildings. This effect is then weighted by the share (38.4 percent) of corporate capital investment attributable to buildings prior to being incorporated into the METR calculation.
- Low Weight Attached to Machinery and Equipment Investment in Manufacturing and Processing: The CCA rate applicable to machinery and equipment used in manufacturing and processing has increased from 50 percent to 100 percent. This means such capital is entirely written off for corporate income tax purposes in the first year of use instead of over the first two years, providing for a meaningful but not overly substantial incentive to increase investment. Moreover, machinery and equipment account for only 19 percent of corporate capital investment and, of this, only about 14 percent is related to manufacturing and processing. In sum, the new 100 percent CCA rate applies to only 2.7 percent (0.19 multiplied by 0.14) of corporate capital investment.
- AII-Induced Increases in the METR Contributions of Other Taxes: Recall that the METR is a measure of the amount by which the rate of return on investment must be increased in order to pay business taxes. As this is expressed as a percentage of the gross-of-tax rate of return, a reduction in a subject tax’s burden on investment has two opposing effects on the METR, one direct and the other indirect.99 See the online appendix for a proof of this result. The direct effect is a decrease in the subject tax’s contribution to the METR, while the indirect, of less magnitude, is an increase in the METR contributions of the other taxes. This means the AII-related decrease in the corporate income tax’s contribution to the METR is partially offset by induced increases in other taxes’ METR contributions.
With the first three of these points implying that the AII has little-to-no impact on more than 97 percent of corporate capital investment, it is no wonder why the AII provides for such a limited reduction in the METR.
The AII story does not end with its modest improvement to overall business tax competitiveness. As noted by Bazel and Mintz (2019), the AII’s accelerated CCA rates increase distortion in capital markets by pushing investment toward short-lived assets, placing more businesses in a non-taxpaying status and encouraging more socially wasteful shifting of reported profits and losses.

METR Estimates in Provincial Budgets: Actual and Potential
After a five-year hiatus, METR estimates returned to the Ontario budget in 2019. Still, referring to estimates like those in the budget, Mintz (2019) observes that: “…METR calculations do not account for all taxes, particularly municipal property taxes that are not currently measurable in Canada. Past studies have shown that inclusion of property taxes could almost double the METR.”
Apart from municipal property taxes, the provincial property tax is likewise not included in the Ontario budget’s METR estimates. Measuring the provincial property tax burden would be a much less complex undertaking than measuring the overall property tax burden levied by hundreds of municipalities. Ideally, the government would undertake both the less and more complex measurements, but undertaking just the former gets closer to the ideal METR estimate than undertaking neither. Estimates that include some, but not all, property taxes would parallel academic estimates that include provincial/state land transfer taxes while excluding municipal land transfer taxes (for example, estimates in Bazel et al. 2018).
Insofar as a measurability problem exists, it involves estimation of effective tax rates when only statutory tax rates are observable. The problem arises with both provincial and municipal property taxes. Although independent analysts face measurability problems due to data limitations, no such problem is faced by provincial governments, given their control of assessment agencies such as Ontario’s Municipal Property Assessment Corporation (MPAC).
Assessed values in Ontario for 2019 were based on a weighted average of valuation dates in 2012 and 2016. An estimate of appreciation since 2016 is needed to convert 2019 statutory tax rates into 2019 effective rates. Since MPAC routinely analyzes property sales, it can provide the government with reliable appreciation estimates in real time. However, MPAC’s publicly available appreciation data is limited to appreciation from 2012 to 2016. Given this limitation, independent analysts’ best option is to extrapolate 2012-2016 appreciation to 2019.
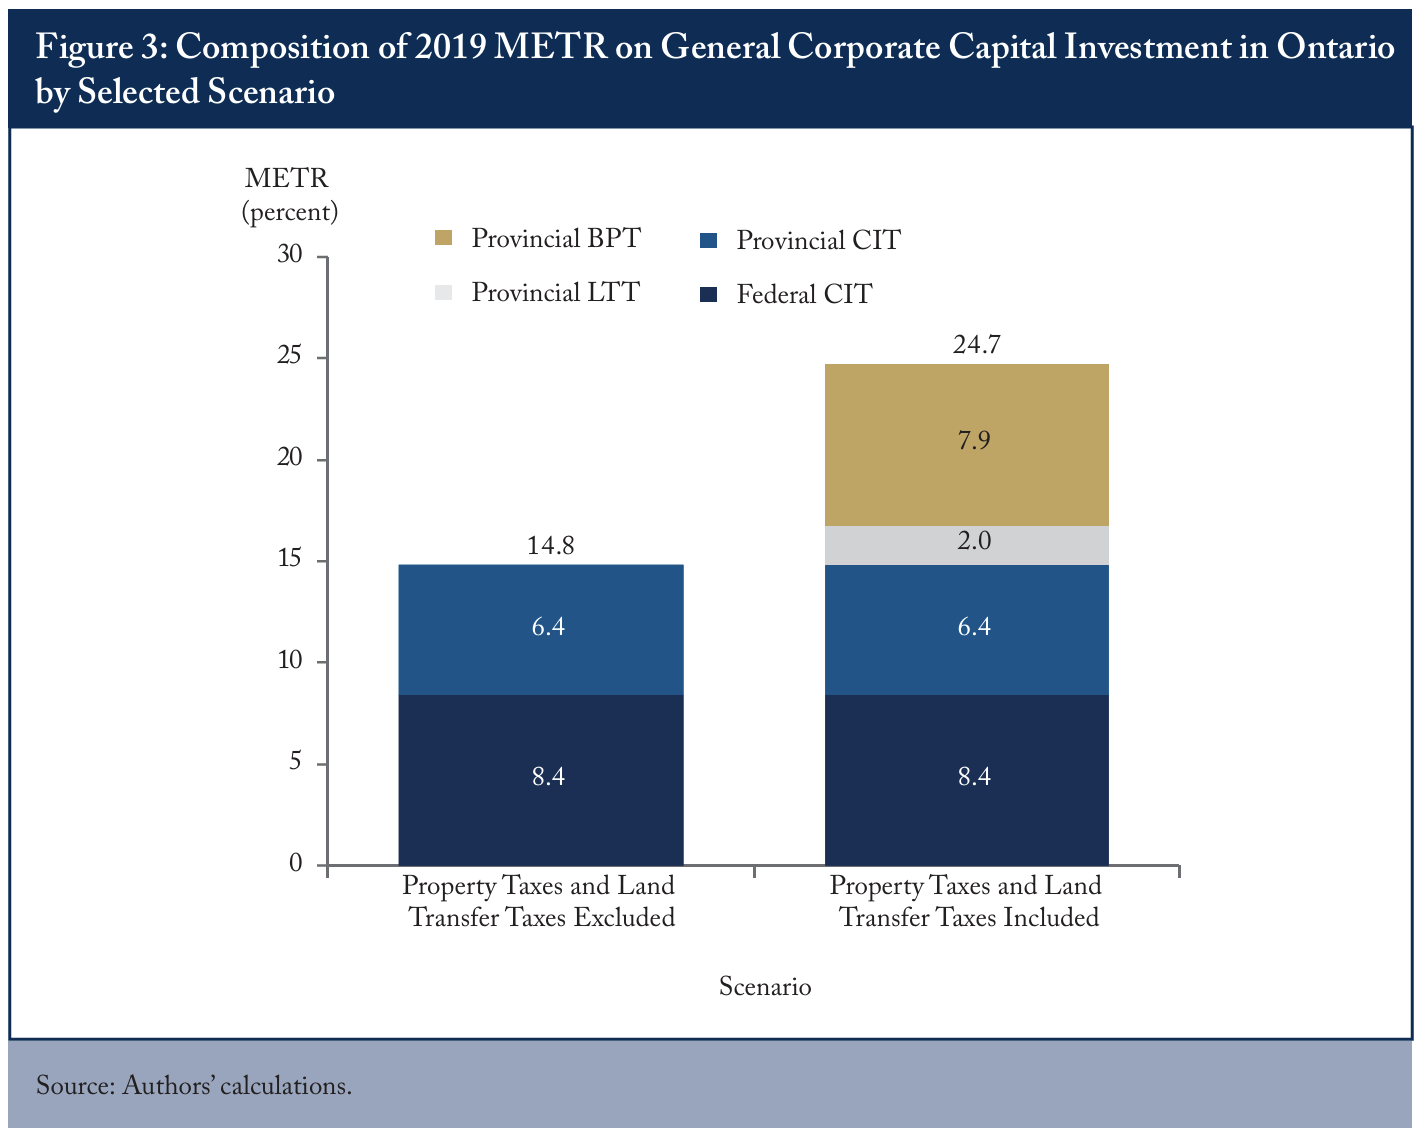
Having done this extrapolation, we have estimated an average effective provincial business property tax rate to determine its contribution to the Ontario METR (Figure 3). This 7.9-point contribution is a proxy for the definitive contribution the government – with its control of MPAC – could readily estimate with greater accuracy. We have also included the provincial land transfer tax in the right-hand bar of Figure 3. The left-hand bar’s 14.8-point total METR, which corresponds to the 12.6-point estimate in the provincial budget, is well short of the 24.7-point total of the right-hand bar. Therefore, the left-hand bar is further from an ideal total than the righthand bar.
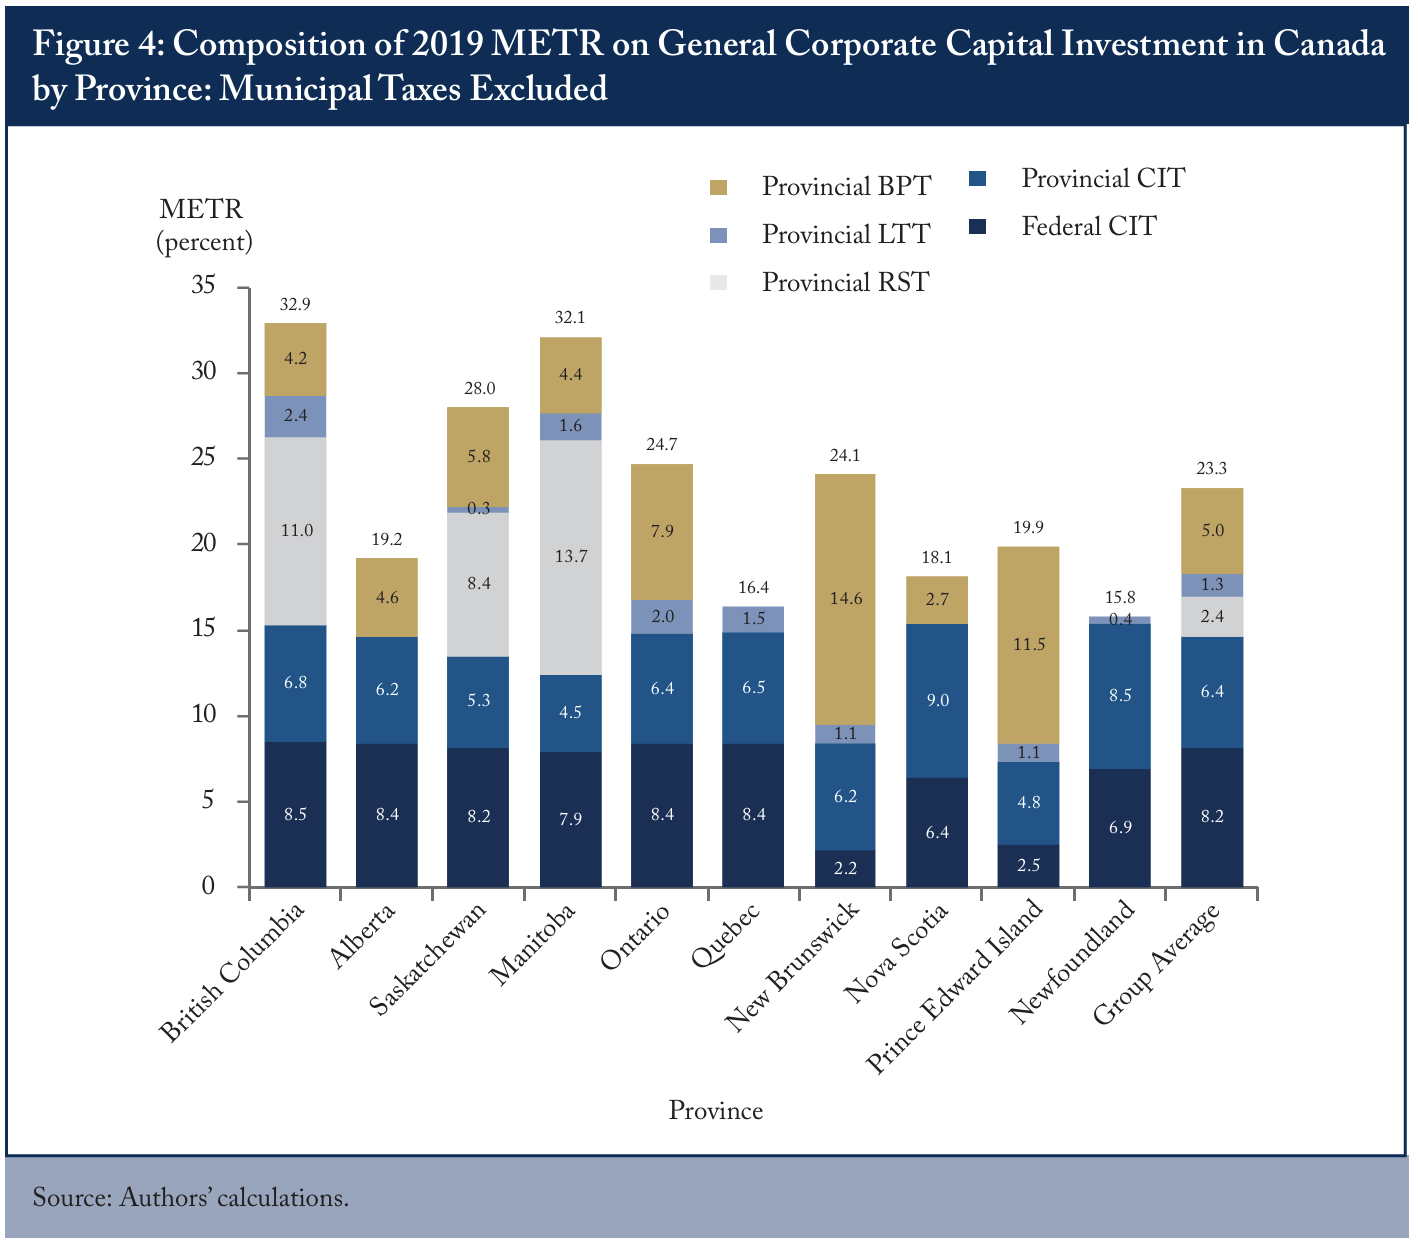
In Figure 4, we compare provincial METRs, including only provincial and federal taxes. In British Columbia, Alberta, New Brunswick, Nova Scotia and Prince Edward Island, assessment lags amount to no more than a year, so independent analysts can estimate effective tax rates almost as readily as provincial governments. In other provinces that levy a property tax – i.e., all but Quebec and Newfoundland and Labrador – assessment lags require us to use proxy measures for effective tax rates, as we did in the Ontario case.
Recommendations
Governments and METR analysts need to begin including business property taxes in METR estimates, given that such taxes can account for around half the METR. Otherwise, widely published METR estimates will continue to paint inaccurate pictures of overall business tax competitiveness and, therefore, misinform policymaking.
Once governments better understand the effect of business property taxes on competitiveness, they are more likely to reduce the burden such taxes impose. To facilitate the inclusion of business property taxes in METR estimates, provincial governments should make readily and freely available the data needed to determine effective property tax rates.
Also, as we have argued previously, provinces should not call their provincial property taxes “education taxes,” since that label is misleading. All provincial property taxes function as general revenue taxes, but only New Brunswick and Prince Edward Island label them appropriately. Provincial governments elsewhere might hope the misleading education label will mitigate taxpayer discontent. However, that objective, insofar as it is achieved, undermines transparency and accountability.
Finally, we align with Bazel and Mintz (2019) in finding that corporate income-tax-rate reductions are preferable to distortionary capital-cost-allowance rate structures and acceleration. As a general rule, the federal government and the provinces should adopt competitiveness-enhancing measures that diminish rather than exacerbate existing economic distortions.
Conclusion
Despite years of concerted federal and provincial efforts to reduce the tax-related cost of business investment, METR analysts and Canadian governments still need to address a gap in their METR monitoring. A major tax on business investment – the business property tax – has been missing from widely published METR estimates. Correction of this omission by governments and analysts would provide more accurate estimates of the tax burden governments impose on business investment.
References
e-Brief Amatov, Aitbek. 2015. “The Effect of State Level Taxes on Employment.” Master’s Thesis. University of Georgia. Available at: https://getd.libs.uga.edu/pdfs/amatov_aitbek_201505_ms.pdf.
Bazel, Phillip, and Jack Mintz. 2019. “Canadian Policy Makers Respond to U.S. Tax Overhaul.” Tax Policy Trends. Calgary: School of Public Policy. June.
Bazel, Philip, Jack Mintz, and Austin Thompson. 2018. “The 2017 Tax Competitiveness Report: the Calm Before the Storm.” Calgary: School of Public Policy Publications. 11:7.
Bird, Richard M., Enid Slack, and Almos Tassonyi. 2012. A Tale of Two Taxes. Cambridge, Massachusetts: Puritan Press.
Calgary, City of. 2019a. “Downtown Tax Shift Response – Updated.” Available at: https://pub-calgary.escribemeetings.com/filestream.ashx?DocumentId=87560.
___________. 2019b. “Calgary’s Fast Financial Facts.” Available at: https://www.calgary.ca/CA/citymanager/Pages/Our-Finances/Financial-facts/Tackling-the-tax-shift-together.aspx.
___________. 2019c. “Tax Shift.” Available at: https://www.calgary.ca/CA/city-manager/Pages/Tax-shift.aspx.
___________. 2019d. “2019 Municipal Non-Residential Phased Tax Program (PTP).” Available at: https://www.calgary.ca/PDA/Assessment/Pages/phased-tax-program.aspx.
___________. 2019e. “City Council Approves 2020 Adjustment to City Budget.” Available at: https://www.calgary.ca/cfod/finance/Pages/Plans-Budgets-and-Financial-Reports/Plans-and-Budget-20192022/2020-Budget-Reductions.aspx.
___________.2020. “2020 Property Assessment Market Report.” Available at: https://www.calgary.ca/_layouts/cocis/DirectDownload.aspx?target=http%3a%2f%2fwww.calgary.ca%2fPDA%2fAssessment%2fDocuments%2fpdf%2f2020-property-assessment-market-report.pdf&noredirect=1&sf=1.
Dahlby, Bev, and Kevin Hassett. 2016. “The Economic Effects of the Corporate Tax: A Review of the Recent Literature.” Paper presented at the University of Calgary School of Public Policy Conference on the Corporate Income Tax.
Enami, A., C.L. Reynolds and S.M. Rohlin. 2020. “The Effect of Property Taxes on Businesses: Evidence from a Dynamic Regression Discontinuity Approach.” Working Paper. Available at: https://docs.google.com/viewer?a=v&pid=sites&srcid=a2VudC5lZHV8Y3JleW5vbDl8Z 3g6NjA2OTExN2Y1ZjY0NWRmYg
Found, Adam. 2014. “Business Property Taxes and the Marginal Effective Tax Rate on Capital.” In Essays in Municipal Finance. PhD diss. University of Toronto.
___________. 2017. “Flying Below the Radar: The Harmful Impact of Ontario’s Business Property Tax.” E-Brief 266. Toronto: C.D. Howe Institute. November.
Gale, W.G., A. Krupkin, and K. Rueben. 2015. “The Relationship Between Taxes and Growth at the State Level: New Evidence.” National Tax Journal 68: 919-942.
Giroud, X., and J. Rauh. 2019. “State Taxation and the Reallocation of Business Activity: Evidence from Establishment-Level Data.” Journal of Political Economy 127 (3): 1262-1316.
Hassett, Kevin, and R. Glen Hubbard. 2002. “Tax Policy and Business Investment.” In Alan Auerbach and Martin Feldstein eds. Handbook of Public Economics 3. Elsevier.
Hassett, Kevin, and Kathryn Newmark. 2008. “Taxation and Business Behaviour: A Review of the Recent Literature.” In John W. Diamond and George R. Zodrow eds. Fundamental Tax Reform: Issues, Choices and Implications. Cambridge, MA: MIT Press.
McKenzie, Kenneth. 2016. “Inside the Black Box: Marginal Effective Tax Rates in Canada – A Primer.” Canadian Tax Journal 64 (4).
McKenzie, Kenneth, Mario Mansour, and Ariane Brule. 1998. “The Calculation of Marginal Effective Tax Rates.” Working Paper 97-15. Ottawa: Technical Committee on Business Taxation, Department of Finance.
Mintz, Jack. 2019. “Our Corporate Taxes Aren’t as Competitive as the Finance Department Thinks.” National Post. July 25.
Ojede, A., and S. Yamarik. 2012. “Tax policy and state economic growth: The long-run and short-run of it.” Economics Letters 116 (2): 161-165.
White, Michelle. 1986. “Property Taxes and Firm Location: Evidence from Proposition 13.” In Studies of State and Local Public Finance, edited by Harvey Rosen. Chicago: University of Chicago Press.