






by Parisa Mahboubi and Tingting Zhang
- In 2025, Canada’s labour market cooled as employment growth slowed, unemployment rose, and job vacancies declined from the unusually tight conditions seen after the pandemic. Trade tensions with the United States, slower immigration-driven labour force growth, and technological change contributed to increasingly uneven labour market outcomes across regions, sectors, and demographic groups.
- Despite growing trade uncertainty, the Canadian economy remained relatively resilient, supported by continued CUSMA protections and government support measures, with most sectors recording employment gains. However, some trade-exposed resource industries and business support services experienced notable employment losses, while businesses became more cautious about hiring and investment.
- Ongoing challenges persist, including rising youth unemployment, long-term unemployment, immigrant overqualification, labour shortages in certain sectors, regional labour market imbalances, and weak productivity growth. Many recent immigrants and non-permanent residents continued to face weaker labour market outcomes than Canadian-born workers.
- This labour market review emphasizes the need for policies that strengthen labour mobility, improve school-to-work transitions and immigrant labour market integration, support workforce adaptation to technological change, and encourage productivity-enhancing investment and innovation.
Introduction
In 2025, Canada’s labour market continued to adjust after the unusually tight11 A tight labour market reflects an imbalance where labour demand exceeds supply, resulting in high job vacancies and low unemployment, as observed in mid-2022. In contrast, a slack labour market indicates weaker demand for workers, characterized by fewer job vacancies and slower hiring. Tight labour markets typically put upward pressure on wages, while slack markets tend to exert downward pressure. conditions of the post-pandemic recovery. Employment growth slowed, unemployment rose across most demographic groups, and the balance between labour supply and demand shifted noticeably away from the exceptional tightness seen in 2022 and early 2023. Several forces shaped this transition: escalating trade tensions with the United States, demographic shifts alongside lower levels of immigration, and artificial intelligence (AI).
This Commentary updates and extends the C.D. Howe Institute’s inaugural 2024 labour market review, analyzing how these forces reshaped Canada’s labour market in 2025 (Mahboubi and Zhang 2025). This second edition examines how shifting trade patterns affected employment across industries and regions, alongside broader changes in productivity, labour market conditions and mismatches, and labour market outcomes for groups including youth, recent immigrants, and non-permanent residents (NPRs).22 Non-permanent resident refers to a person from another country with a usual place of residence in Canada and who has a work or study permit or who has claimed refugee status (asylum claimant).
Looking ahead, the external environment has become more challenging. The Canada-United States-Mexico Agreement (CUSMA) review scheduled for July 2026 and the economic disruptions stemming from the Iran conflict, which began in early 2026, add new uncertainty to an already fragile labour market outlook. Against this backdrop, this paper argues that Canada’s policy response must go beyond the emergency measures deployed in 2025 and address four interconnected structural priorities: mitigating trade and geopolitical risks, improving labour market outcomes for youth and immigrants, enhancing labour mobility, and restoring productivity growth through investment and regulatory reforms.
Overview of Canada’s Labour Market
Canada’s labour market underwent major changes in 2025, shaped most notably by trade tensions with the United States and shifting demographics. Although the labour force and employment both continued to expand, growth slowed compared with the previous year.
Stricter immigration policies have limited the inflow of permanent and non-permanent residents, contributing to slower labour force growth. By 2025, Canada had 22.6 million people in the labour force, up 2 percent from 2024.33 All 2025 data represent year averages except where otherwise noted. Similarly, employment increased by 1.4 percent to 21 million. Most sectors continued to add jobs, reflecting the fact that CUSMA still shields most goods and services from tariffs, limiting the immediate labour market impact of trade disputes.
Despite these gains, several indicators point to a gradual cooling of labour market conditions. While some of this cooling reflects a cyclical easing from the exceptionally tight post-pandemic labour market, the uneven nature of the adjustment across sectors, regions, and demographic groups suggests that structural forces – particularly trade disruptions, demographic change, and technological transformation – are also at work (Bank of Canada 2026). The unemployment rate increased by half a percentage point to 6.8 percent, reflecting slower hiring and rising labour market slack, mainly due to tariff impacts and related uncertainties. The number of unemployed individuals rose to 1.54 million, up from 1.4 million in 2024.
At the same time, the employment rate44 The employment rate is the number of employed persons expressed as a percentage of the population aged 15 years and over. declined from 61.3 percent to 60.8 percent, while labour force participation edged down slightly to 65.3 percent, reinforcing the evidence of a softening labour market. Ontario and BC experienced the biggest declines compared to 2024, both falling 0.7 percentage points to 60 and 60.9 percent, respectively. Saskatchewan and Alberta recorded the highest employment rates, both at 63.9 percent, while Newfoundland and Labrador lagged at 52 percent. These regional disparities reflect differences in sectoral composition, demographic structure, and broader economic conditions (Mahboubi and Zhang 2025). For example, Newfoundland and Labrador and New Brunswick had the highest old-age dependency ratios (OADs) in 2025 at 40 and 37 percent, respectively, while Alberta remained among the youngest provinces with an OAD ratio of 23 percent.
The composition of employment also shifted modestly. The share of workers employed full-time declined slightly to 81.8 percent in 2025, continuing the gradual decline trend observed in recent years. Paid employees represented the majority of the workforce, at 87.1 percent, while the share of self-employed individuals remained unchanged in 2025, at 12.9 percent.
Job vacancy data further illustrate the easing labour market. The job vacancy rate (the percentage of unfilled positions) fell to 2.8 percent in December 2025, returning to levels last seen in 2017. With fewer available positions, there were almost four unemployed individuals for every job vacancy that month, indicating that the labour market had shifted from the tight conditions of the early 2020s toward excess labour supply.
Overall, the easing of labour market conditions appears to have been driven primarily by weaker demand. While moderating labour supply and weaker demand can both slow employment growth, the simultaneous decline in vacancies and rise in unemployment point to demand-side factors as the dominant force. In addition to trade-related uncertainty, higher borrowing costs likely weakened investment and made firms more cautious about hiring (Bank of Canada 2025).
Demographic patterns also shaped labour market outcomes in 2025. Among core-aged workers (ages 25-54), employment continued to expand, reaching 13.96 million, although growth slowed from previous years. Gains were broadly based, led by healthcare, finance, and professional services, which offset modest losses in more trade-exposed industries. The unemployment rate for this group increased modestly from 5.4 percent in 2024 to 5.8 percent in 2025, while participation remained high at 88.5 percent.
In contrast, labour market outcomes for youth aged 15-24 weakened more noticeably. The youth unemployment rate rose to 13.8 percent in 2025, up from 13.1 percent in 2024, while the youth employment rate declined slightly. Although the youth labour force continued to grow, job creation did not keep pace with the increase in labour supply, making it more difficult for younger workers – particularly recent graduates with limited work experience – to find employment. Notably, youth were the only age group to record net job losses in accommodation and food services, even as prime-age and older workers in that sector saw gains. Employment also declined in manufacturing, pointing to compositional shifts in hiring that compounded the demand-side barriers facing young workers.
Among older workers aged 55 and over, labour market conditions softened modestly in 2025. The employment rate declined from 34.6 to 34 percent, the participation rate fell from 36.4 to 35.8 percent, and the unemployment rate rose from 4.9 to 5.3 percent. The decline in the participation rate primarily reflected population growth outpacing labour force growth, consistent with ongoing retirements and demographic ageing. At the same time, rising unemployment alongside a slight decline in employment suggests some weakening in labour demand for this cohort. Employment among older workers declined across several goods-producing industries, particularly construction and resource-related sectors, while services-producing sectors recorded modest gains. Unemployment duration data for older workers do not show a marked deterioration, suggesting the increase in unemployment did not primarily reflect substantially longer unemployment spells.
These demographic patterns – deteriorating conditions for youth, modest softening among older workers, and continued but slower growth among core-aged workers – contributed to the slight overall decline in labour force participation observed in 2025.
Trade Impact in 2025
In 2024, approximately 2 million Canadian jobs depended on exports of goods to the United States, representing about 9.5 percent of total employment, with particularly high exposure in manufacturing, mining and oil and gas extraction, and wholesale trade.55 See Figure A1 in the Online Appendix. At the subsector level, about three-quarters of jobs in automobile manufacturing and aluminum production and two-thirds in iron and steel were tied to US demand (Clarke, Stewart and Trifonov 2026). When services trade is included, 2023 data suggest that approximately 13 percent of total employment depended on US demand, pointing to a much larger share of the labour market that could become vulnerable depending on the outcome of the CUSMA review scheduled for July 2026.
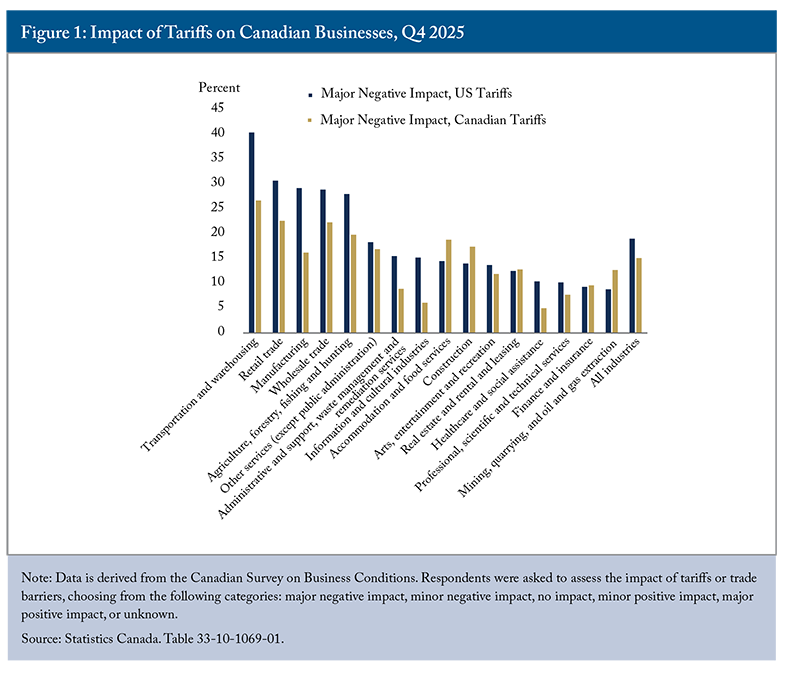
The introduction of tariffs on autos, steel and aluminum, oil and gas, and lumber in early 2025 had a significant negative impact on affected businesses. At the same time, Canada’s retaliatory tariffs also affected Canadian businesses. In the fourth quarter of 2025, nearly one in five businesses reported a major negative impact from US tariffs, while 15 percent reported the same from Canadian tariffs (Figure 1). Transportation and warehousing, retail trade, and manufacturing were the most affected sectors, with nearly 30 to 40 percent of businesses indicating a major negative impact from US tariffs. By the first quarter of 2026, more than half of manufacturing businesses (50.6 percent) reported being negatively affected by US tariffs over the preceding year – well above the all-business average of 32.2 percent – though 23.2 percent of manufacturers also reported increased sales of Canadian products over the same period (Clarke, Stewart and Trifonov 2026).
These pressures contributed to uneven employment outcomes across sectors, regions, and demographic groups. Nationally, there has been no net employment growth in the first eight months of 2025, and payroll employment showed no net increase from January to June (Gellatly and McCormack 2025). From January to August 2025, manufacturing alone lost more than 58,000 net jobs, alongside notable declines in agriculture and business support services. None of them had fully recovered by December 2025. Importantly, these employment declines were driven primarily by a slowdown in hiring rather than by elevated layoffs. Layoff rates in trade-dependent industries remained in line with pre-pandemic norms, while job-finding rates among the unemployed dropped sharply – with only 15.2 percent of those unemployed in July finding work by August, compared with 23.3 percent over the same months before the pandemic. This points to a labour market in which firms were reluctant to hire rather than quick to let workers go (Clarke and Fields 2025).
The effects of trade disruption were not evenly distributed across the workforce. Workers in trade- and transport-sensitive industries – where exposure to US demand tends to be highest – are disproportionately male, older (35 and over), and immigrant, meaning these groups are more likely to bear a larger share of the adjustment costs (Frenette and Mehdi 2025).
Many goods sold to the US remain protected by CUSMA, which has limited the overall impact of tariffs. In Q4 2025, approximately one third of businesses reported purchasing or selling CUSMA-compliant goods to the United States over the previous 12 months.6See Figure A2 in the Online Appendix. Engagement was highest in agriculture and manufacturing, where more than 40 percent reported purchasing goods from the US, and over 60 percent reported selling goods there. These figures highlight the depth of cross-border supply chain integration in these sectors and the potential disruption that a breakdown of CUSMA would create.
In response to tariffs and ongoing uncertainty, many businesses adopted alternative strategies to maintain profitability. One key response was changing suppliers and diversifying trade partners beyond the United States. In Q4 2025, 13 percent of businesses reported switching suppliers in response to the trade war, with the highest shares in retail trade, accommodation and food services, and manufacturing.77 See Figure A3 in the Online Appendix. As tariffs reduce US demand for Canadian exports and disrupt cross-border supply chains, firms may face higher per-unit costs, reduced scale, and greater uncertainty, prompting them to re-evaluate supplier relationships and seek more cost-effective or reliable alternatives.
Looking ahead, these sectors – as well as large-sized companies in general – are more likely to continue seeking alternative suppliers, with 12 percent of all businesses indicating they would take this approach over the next 12 months.88 See Figure A4 in the Online Appendix. Other commonly planned actions include raising prices for goods and services (16.1 percent) and increasing domestic sourcing (14.7 percent). In Q1 2026, slightly more than one third (33.4 percent) of businesses reported that they were either very likely or somewhat likely to pass tariff-related cost increases onto customers over the next 12 months.99 Statistics Canada. “Canadian Survey on Business Conditions, first quarter 2026.” https://www150.statcan.gc.ca/n1/daily-quotidien/260227/dq260227c-eng.htm. As a result, costs for consumers and downstream industries may rise as the trade conflict continues, with firms likely reallocating resources and investments accordingly.
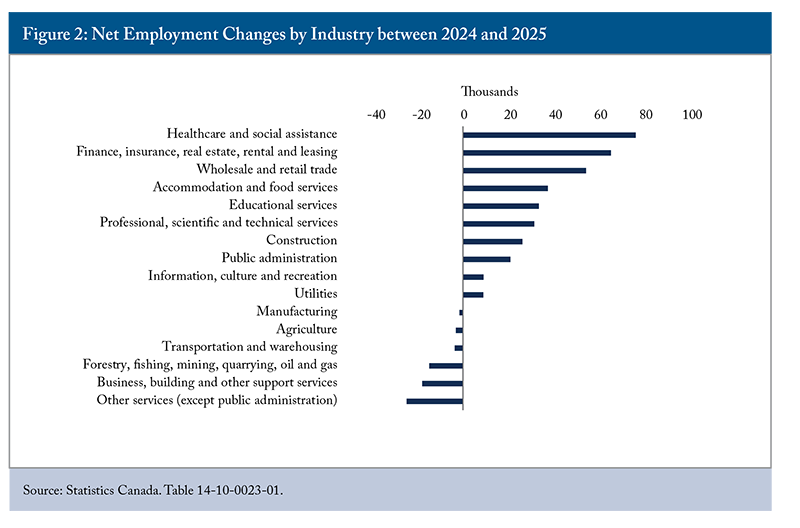
Overall, the Canadian economy remained resilient amid trade uncertainty, although the effects were uneven. Compared with 2024, most industries recorded net employment gains, led by healthcare, finance, and wholesale and retail trade (Figure 2), while employment declined in more trade-exposed sectors, including forestry and transportation. While some sectors faced higher duties, the overall effective tariff rate on imports from Canada remained at about 6.3 percent (Villeneuve, Fanjoy and Sarraf 2026). As a result of both CUSMA’s continued protection of most Canadian trade and swift government intervention to support affected workers and businesses,1010 Key federal measures included expanding work-sharing through employment insurance, launching the $1 billion Regional Tariff Relief Initiative to help firms diversify markets and adopt new technologies, establishing the $228.8 million Canada-Ontario Workforce Tariff Response program for retraining, and providing other tariff support through the $5 billion Strategic Response Fund. These programs, alongside BDC loan facilities, helped prevent layoffs and gave businesses the resources to weather the impacts of tariffs. the trade impact in 2025 was more muted than might have been expected. However, elevated uncertainty still affects businesses, causing them to hesitate to invest in job creation, expansion, or productivity improvements. Most firms will maintain their current staffing levels and limit investment to routine maintenance over the next 12 months.1111 Bank of Canada. “Business Outlook Survey – Fourth Quarter of 2025.” https://www.bankofcanada.ca/2026/01/business-outlook-survey-fourth-quarter-of-2025/. Looking ahead, prospects for the labour market will heavily depend on the Canada-US trade relationship, especially with the CUSMA review scheduled to formally take place by July (but is likely to give rise to protracted talks that could add to the uncertainty).
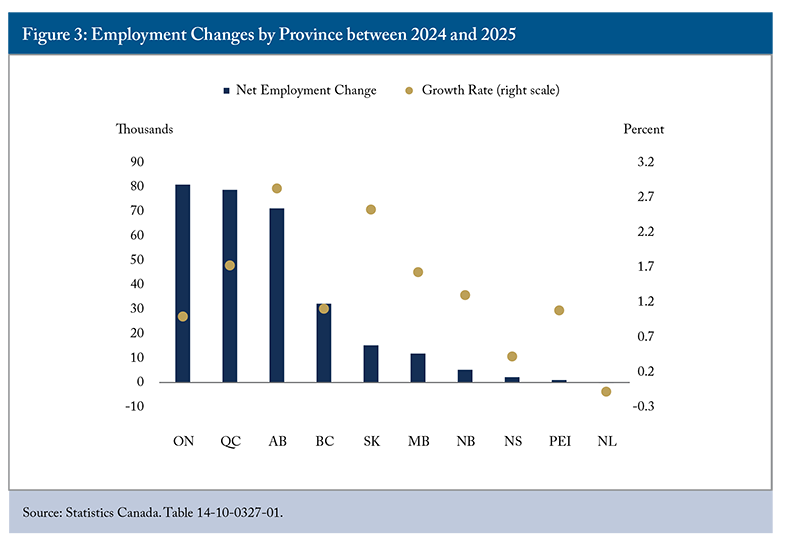
All provinces except Newfoundland and Labrador experienced net employment increases. Alberta and Saskatchewan led growth at 2.8 percent and 2.5 percent, respectively, with Alberta adding over 70,000 jobs between 2024 and 2025 (Figure 3). In absolute terms, Ontario and Quebec recorded the largest employment gains. This pattern suggests that expansion in domestically oriented sectors has outweighed losses in export-oriented sectors.
Overall, these trade shocks and uneven employment shifts also influence broader economic outcomes by intersecting with Canada’s longer-standing productivity challenges. Uncertainty in trade and export markets can discourage investment, slow capital formation, weaken hiring intentions, and contribute to declining labour productivity, which in turn affects long-term growth and living standards.
Ongoing Productivity Challenge
Weak productivity growth in Canada has become a major concern for policymakers and the public. Over the past five decades, Canada has consistently generated less output per hour worked than its peer countries, particularly the United States (Vincent 2025). Slower real GDP per capita growth in Canada relative to the US has widened the prosperity gap. In recent years, while US real GDP per capita has continued to grow, Canada’s has stagnated or declined, making the challenge more acute (Robson and Bafale 2025).
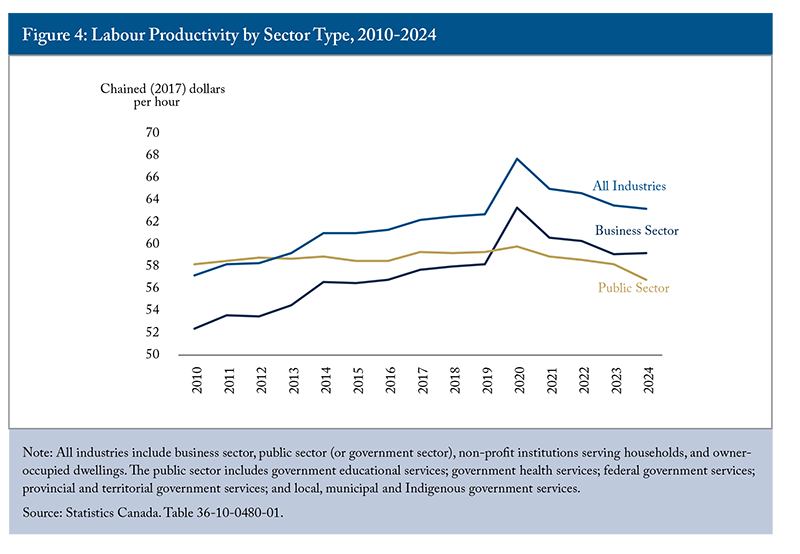
Canada experienced a temporary boost in productivity in 2020, largely driven by a temporary sectoral shift toward more productive industries during the pandemic. As labour-intensive sectors reopened, aggregate output per hour declined in 2021 and continued trending downward. By 2024, trends had diverged across sectors: labour productivity in the business sector remained 1.7 percent above its 2019 level, while productivity in the public sector 12There are conceptual and measurement challenges associated with public sector productivity (Harrison and Sharpe 2024). In Canada, there is no direct or comprehensive measure of public service productivity, and productivity estimates often rely on proxies or assumptions that differ from those used in the private sector. Recently, the working group on public service productivity highlighted these data limitations and methodological challenges in measuring public sector productivity and provided recommendations to address them. However, the Treasury Board of Canada does not actively consider these recommendations, as they do not readily align with current government priorities.declined by 4.2 percent over the same period – falling below even its 2010 level – weakening overall productivity performance (Figure 4). This pattern coincides with the rapid expansion of the public sector since 2020, which has outpaced private-sector growth.1312 See Figure A5 in the Online Appendix.
Between 2010 and 2025, public-sector employment1413 Public-sector employees include those who work for a local, provincial, or federal government, for a government service or agency, a Crown corporation, or a government-funded establishment such as a school (including universities) or hospital. grew by 34.1 percent, compared with 25.8 percent in the private sector – a gap that widened markedly after 2020. Growth has also varied across provinces: BC experienced the highest growth of 52.6 percent, followed by PEI (39.2 percent) and Quebec (37.4 percent), while Ontario recorded comparatively modest growth over this period.1514 See Figure A6 in the Online Appendix.
Since 2019, public-sector employment has grown at more than twice the rate of the private sector, rising by 21.8 percent versus 9.9 percent. Education, healthcare, and public administration are the largest employers within the public sector. Between 2019 and 2025, they accounted for most net employment growth, representing 29 percent, 32 percent, and 32 percent, respectively, of the 0.8 million increases. Although public-sector employment growth slowed over the past year, it still exceeded private-sector growth by 0.6 percentage points in 2025. As a result, public-sector jobs accounted for 25 percent of all employees in 2025, up from 23 percent in 2019. As long as the public sector continues to make up a larger share of total employment, its relatively lower and declining productivity could weigh on Canada’s overall labour productivity performance.1615 Following years of rapid expansion, the federal government announced plans to reduce the size of the federal public service by approximately 16,000 positions over three years, which may moderate the public sector’s share of total employment and its drag on overall productivity going forward (Government of Canada 2026). https://www.canada.ca/en/government/publicservice/workforce/workforce-adjustment/workforce-reductions-federal-public-service.html.
Available quarterly data for the business sector provide a more detailed view of productivity dynamics in this sector over time (Figure 5). After modest but steady growth through much of the 2010s, business-sector productivity surged during the pandemic, mainly because hours worked contracted faster than output and activity shifted toward more productive, essential industries (Wang 2021). This increase proved temporary: productivity declined through 2021 and 2022 and has only partially recovered since, with considerable volatility in the post-2020 period. Despite recent gains, productivity remains only modestly above its pre-pandemic level. In 2025, business labour productivity grew by 1.1 percent – its strongest annual gain in several years – supported by robust GDP growth outpacing hours worked (1.9 percent versus 0.8 percent), even amid trade tensions and a softening labour market.
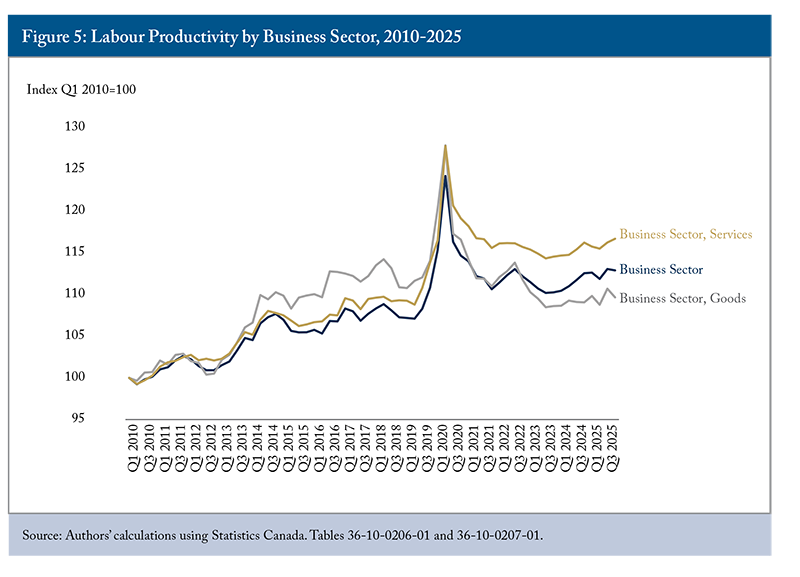
However, divergent sectoral trends mask underlying vulnerabilities. Productivity in the service-producing sector has trended upward since Q3 2023 and, by Q4 2025, exceeded its pre-pandemic level by 2.5 percent. In contrast, productivity in the goods-producing sector remains 3.8 percent below its Q4 2019 level, as hours worked have grown faster than real GDP (7.6 percent versus 3.5 percent). In part, this reflects a compositional reversal: as labour-intensive goods-producing sectors returned to full operation following the pandemic, aggregate output per hour naturally declined from its temporarily elevated levels. At the same time, persistently weak output-per-hour growth suggests broader structural challenges, including relatively weak business investment, slow technology diffusion, and persistent competitiveness challenges (Vincent 2025; Robson and Bafale 2025).
A closer look at the goods-producing sector reveals distinct patterns. Agriculture stands out for strong labour productivity gains over time, reaching historically high levels despite a slight decline in Q4 2025 (Figure 6). Between Q4 2024 and Q4 2025, its labour productivity surged unusually by 18.1 percent, though part of this increase reflected declining hours worked and employment alongside stronger output growth. Favourable weather conditions and stronger yields likely boosted output,1716 Statistics Canada. “Production of principal field crops, November 2025.” https://www150.statcan.gc.ca/n1/daily-quotidien/251204/dq251204a-eng.htm. while better farm management, improved input efficiency, and increased technology adoption may also have supported productivity performance.1817 Statistics Canada. “Adoption of new technologies over the last three years, training provided, and employees’ ability to adapt to new technologies.” https://www150.statcan.gc.ca/t1/tbl1/en/tv.action?pid=3310112901.
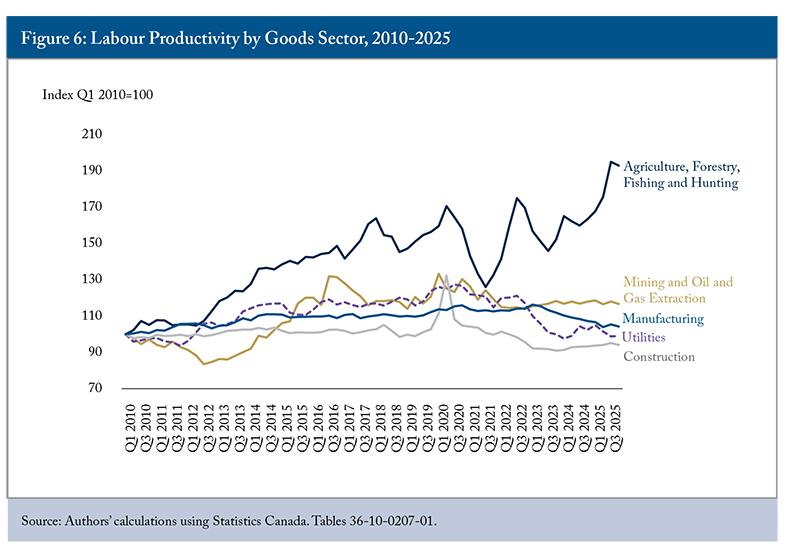
Moreover, Canada’s agricultural productivity not only outperformed US levels in 2023 but also exceeded US growth rates between 2014 and 2023 (Almeida et al. 2025). However, agriculture accounts for less than 5 percent of goods-producing sector employment, meaning its gains are insufficient to offset broader productivity weakness in the sector. Manufacturing presents a more mixed picture. While it has performed well and outpaced US productivity growth over the longer term, recent declines raise concerns. Still, weakening demand and recent tariff impacts may partly explain these declines, and both pressures could prove temporary.
More concerning are declines in construction, which accounts for 10.1 percent of total output. Construction productivity has shown little improvement over the past two decades and has declined in recent years. In both residential and commercial construction, municipal red tape and regulatory complexity can impede efficiency and weaken productivity. More recently, monetary policy and cyclical factors have also weighed on performance, as higher interest rates, tighter financing conditions, and softer housing market activity have slowed residential construction. Residential construction, dominated by small firms with inherently lower productivity growth than larger firms, accounted for most of the sector’s 37.3 percent cumulative labour productivity decline between 2001 and 2023 (Watt, Gu and Iorwerth 2026). Given that residential investment represented a relatively large share of economic activity,1918 Its share was more than 7 percent of GDP in 2024: https://thehub.ca/2026/05/06/canadas-real-estate-economy-is-costing-us-heres-how/. these structural weaknesses can constrain broader economic flexibility and growth potential.
Overall, these trends illustrate Canada’s broader challenge: productivity growth across many Canadian industries has lagged behind that of the United States in recent years. The gap has been especially pronounced in several key sectors, including information and cultural industries, mining and oil and gas extraction, and professional, scientific, and technical services (Almeida et al. 2025).
Because Canada’s living standards depend on productivity growth, these gaps pose a major challenge. Multiple factors drive the problem: chronic underinvestment in information and communication technology, machinery and equipment, and intellectual property products over the years (Robson and Bafale 2025; OECD 2025). According to Gu and Willow (2023), lower productivity growth in the information and communication industries sector (including software development) contributed, on average, about 0.3 percentage points per year out of the 0.92 percentage point difference in average business productivity growth between Canada and the US from 2001 to 2019. If this gap persists, Canada will continue falling behind the US in economic competitiveness, innovation capacity, and living standards. It may also undermine Canada’s competitiveness in AI, software development, and digital services, which are critical to future growth.
Despite record post-pandemic immigration levels, many newcomers are overqualified for their jobs, working in positions requiring only a high school diploma (Mahboubi and Zhang 2024). This may reflect several factors, such as differences in credential recognition, language ability, job matching, and the quality or transferability of education and work experience (Mahboubi and Zhang 2025). At the same time, rapid population growth can dilute the capital stock when investment does not keep pace, reducing the stock of machinery, buildings, and natural resources available per worker, which can lower productivity. Without adequate capital investment and technology adoption, the economy may struggle to fully translate labour force growth and immigrant human capital into productivity gains (Sargent 2024; Robson and Bafale 2025). Weaker per capita GDP growth also partly reflects the composition of recent inflows, including a relatively large share of lower-skilled and non-permanent residents who are concentrated in lower-paid and lower-productivity occupations (Mahboubi and Zhang 2025; OECD 2025). This may dampen firms’ incentives and points to ongoing challenges related to capital deepening and labour market integration.
As trade uncertainty discourages business investment, productivity growth will likely remain a challenge for many sectors. Tackling Canada’s productivity challenges will require improving the investment climate through competitive income tax rates, reducing red tape, streamlining regulations, and enhancing competition. Faryaar, Rosell and Stegnjaic (2026) show that stronger competition is positively associated with labour productivity growth at both the firm and industry levels. Similarly, Cette et al. (2026) find that current regulations that unnecessarily restrict competition in four non-manufacturing sectors – energy, transportation, retail distribution, and professional services – limit Canada’s long-term economic growth by up to 10 percent. Additional gains could come from reducing interprovincial trade barriers and lowering barriers to foreign investments, alongside targeted investments in skills development, technological adoption, and industry-specific strategies (Robson and Bafale 2025; OECD 2025; Mahboubi and Zhang 2025).
Ultimately, these productivity challenges have direct implications for the labour market. Weak productivity growth can constrain wage gains, limit the creation of high-quality jobs, and reduce the economy’s capacity to absorb and fully utilize a growing and increasingly skilled workforce. Addressing these constraints is therefore central not only to improving economic performance, but also to strengthening labour market outcomes and sustaining living standards.
Labour Market Conditions and Mismatches
Assessing labour market conditions requires examining multiple indicators, including unemployment, job vacancies, wage growth, and hiring behaviour. Together, these measures provide insight into the balance between labour demand and labour supply and help reveal the pressures faced by both employers and job seekers.
Labour demand – the total of filled and unfilled positions – weakened as trade tensions escalated. Job vacancies averaged about 498,700 in 2025, down from roughly 570,800 in 2024. Vacancies declined across most sectors, with particularly large reductions in healthcare and social assistance, transportation and warehousing, and construction. With 1.6 million unemployed people in December 2025, there were almost four job seekers for every vacant position.
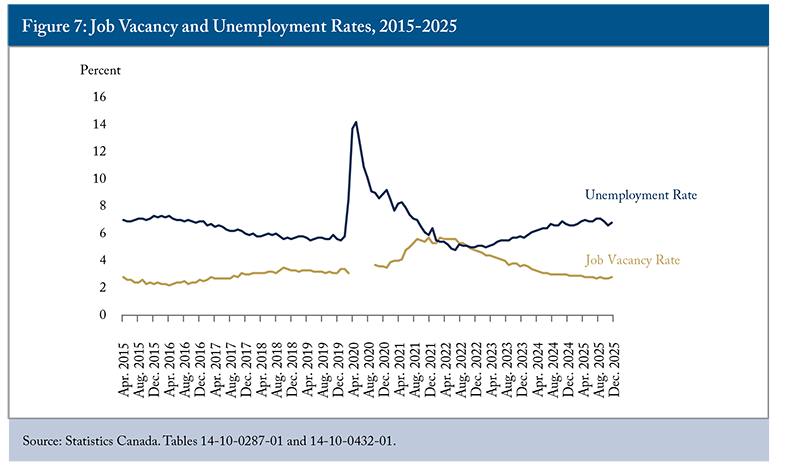
The labour market continued to slacken, with a relatively high unemployment rate (6.8 percent) and a low job vacancy rate (2.8 percent) in December 2025 (Figure 7). Conditions changed significantly from April 2022, when the overall vacancy rate peaked at 6 percent. Rising unemployment and falling vacancies indicate that the labour market has moved away from the exceptionally tight conditions seen during the post-pandemic recovery. In many respects, the 2025 labour market has returned to conditions similar to those observed in the mid-2010s (the earliest year for which comparable vacancy data are available) in terms of vacancy and unemployment rates. However, long-term unemployment and long-term vacancies suggest a more nuanced adjustment, with structural mismatches proving more difficult to resolve than aggregate figures imply.
Long-term Unemployment
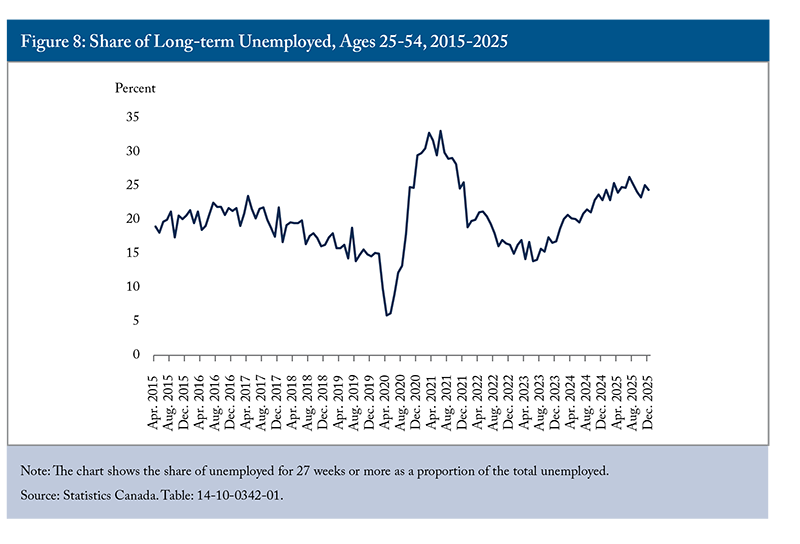
Beyond the headline unemployment rate, the rising share of core-age individuals experiencing long-term unemployment – defined as unemployment lasting 27 weeks or more as a share of the total unemployment – raises broader concerns about both the uneven distribution of labour market adjustment and its longer-term implications. By December 2025, approximately one in four core-aged unemployed Canadians had been out of work for 27 weeks or more, approaching levels last seen during the pandemic and nearly double the trough of 13.9 percent reached in June 2023 (Figure 8). This divergence – relatively moderate overall unemployment but a growing concentration of prolonged joblessness – points to structural reattachment difficulties beyond what could be expected in a purely cyclical slowdown. It also means the headline unemployment rate understates the degree of hardship faced by a subset of job seekers, who face increasing risks of long-term scarring effects on earnings and employability. Prolonged absence from work may also erode skills and labour market attachment, making re-entry progressively harder over time.
Wage Trends
Wage developments provide another signal of shifting labour market conditions. Typically, wage growth accelerates when labour markets are tight and slows when labour demand weakens. Consistent with an easing labour market in 2025, annual wage growth for core-aged full-time workers (ages 25-54) moderated to about 3-3.8 percent, down from roughly 4-6 percent during 2022-2024 (Figure 9). During the peak inflation period of 2022-2023, wage increases lagged behind inflation, resulting in real wage losses despite nominal gains.
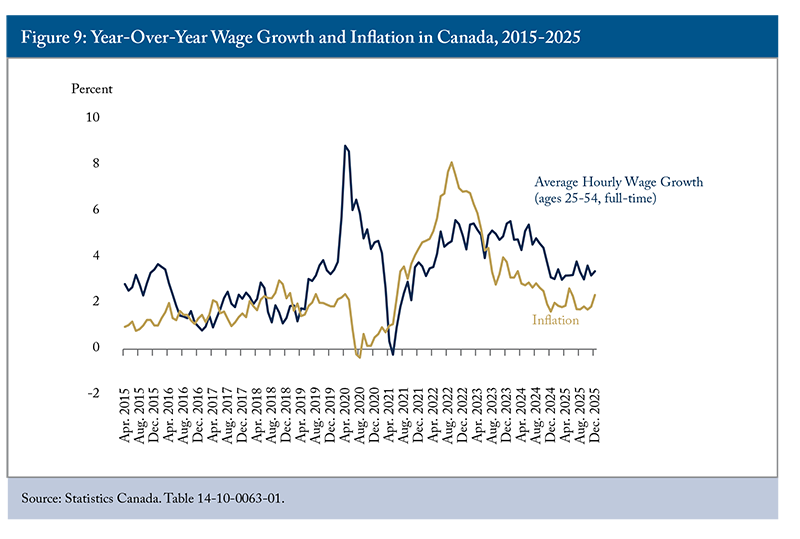
By 2025, with inflation near the 2 percent target, wages are rising faster than prices, indicating a gradual recovery in real purchasing power. Nevertheless, wage growth remains slightly above the roughly 2 percent pace typical of the mid-2010s. This persistence partly reflects delayed adjustments in the public sector, where collective bargaining agreements produced catch-up increases following the high-inflation period, including the well-documented lag between labour market conditions and wage adjustment, estimated at up to two years (Bounajm and Devakos 2025). As these catch-up effects fade and labour market slack continues to build, nominal wage growth is expected to ease further in the near term.2019 A caveat is that these figures can also be influenced by compositional changes in the labour force, including an ageing workforce and shifts in part-time and occupational structures, and therefore may not fully capture individual workers’ hourly wage growth.
Shortages in Certain Sectors
Firm behaviour also reflects easing labour market pressures. Even though permanent layoffs are not significantly higher than a year ago, workers are taking longer to find jobs. Most firms reported having plenty of capacity, including labour. And many are delaying hiring or restructuring decisions as they assess an evolving landscape shaped by geopolitical tensions and rapid technological transformation. Meanwhile, businesses find it easier to recruit workers compared to a year ago, and the share of firms reporting labour shortages that constrain their operations fell to its lowest level since 2020.2120 Bank of Canada. “Business Outlook Survey—Third Quarter of 2025.” https://www.bankofcanada.ca/2025/10/business-outlook-survey-third-quarter-of-2025/. However, shortages in certain sectors persist.
These sectoral differences are reflected in the unemployment-to-vacancy ratio by industry, which reveals a highly uneven picture beneath aggregate numbers (Figure 10). For example, the healthcare sector had the highest number of job vacancies, with 98,305 positions, but only half of the unemployed persons were available in the fourth quarter of 2025. In contrast, educational services and the information, culture, and recreation industries had the highest unemployment-to-vacancy ratios (3.9 and 3.6, respectively), indicating an excess labour supply. Accommodation and food services also experienced a low unemployment-to-vacancy ratio of 1.4. However, this likely reflects the sector’s constant need to replace workers because of high turnover. At the same time, offered wages in this sector remain the lowest among all industries, making it increasingly difficult to attract workers despite the apparent shortage. Moreover, the sector increased its average offered hourly rate by only 2.2 percent between Q4 2024 and Q4 2025, below the industrial average of 3.4 percent, weakening its competitiveness relative to other sectors.
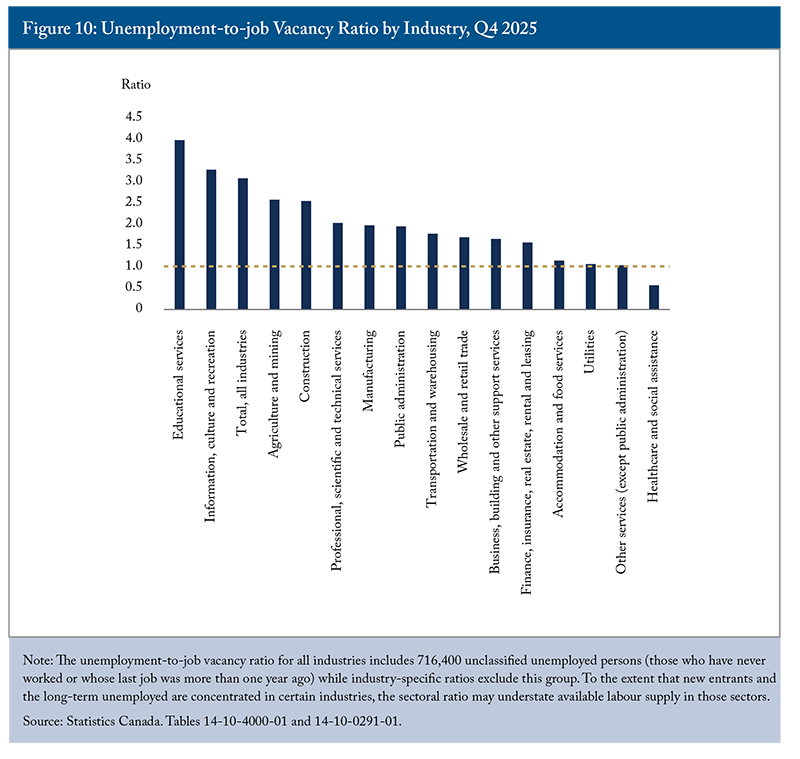
Notably, the average hourly offered wage in the utilities sector2221 The utilities sector comprises establishments primarily engaged in the generation, transmission, and distribution of electric power, natural gas, and water, as well as sewage treatment and steam and air-conditioning supply, covering both private-sector and government-owned entities. decreased by 1.2 percent between Q4 2024 and Q4 2025, despite having a low unemployment-to-job vacancy ratio of 1.1. Employers in this sector need to raise wages to attract and retain workers with the necessary skills. Otherwise, they may rely on their existing workforce to work longer hours to maintain operations, which can reduce productivity at the margin and create retention challenges (Mahboubi and Zhang 2025). Consistent with this pattern, the utilities sector experienced a sharp decline in labour productivity from 2022 onward, following an upward trend observed from 2015 through 2021 (Figure 6).
Job Mismatches
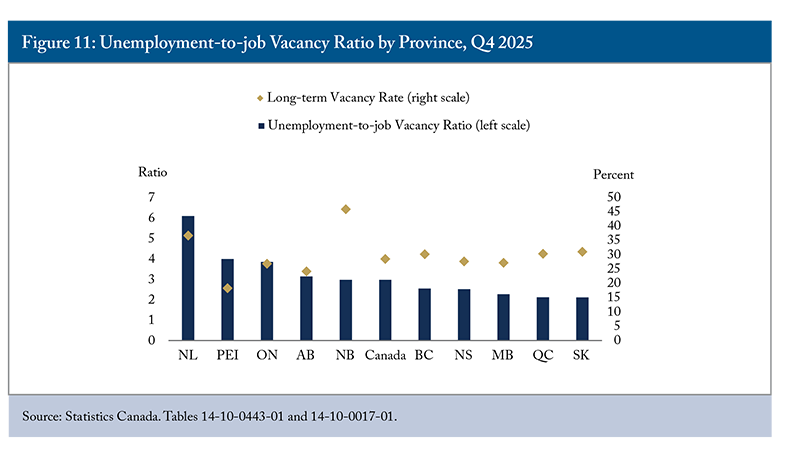
As labour market conditions eased, the long-term job vacancy rate – the share of vacancies remaining unfilled for 90 days or more – steadily declined over the last three years. In the fourth quarter of 2025, it fell to 28.6 percent from 39.5 percent in Q4 2022. While long-term job vacancies can indicate labour market mismatches, such mismatches are also evident among employed workers, some of whom work in jobs that do not align with their education or training. In September 2025, 16.4 percent of core-aged workers with postsecondary education worked in jobs unrelated to their education or training, up 0.9 percentage points from 12 months earlier.2322 Statistics Canada. “Labour Force Survey, September 2025.” https://www150.statcan.gc.ca/n1/daily-quotidien/251010/dq251010a-eng.htm. Recent immigrants faced steeper mismatches: 21.2 percent worked in unrelated fields compared to 15.2 percent of Canadian-born workers.
The gap widened further when considering overqualification. Overall, immigrants reported an overqualification rate of 25.2 percent, compared with 19.1 percent among Canadian-born workers, while the rate for recent immigrants reached 32.6 percent (Lovei 2026). Notably, recent immigrants with university degrees above the bachelor’s level were about six times more likely than their Canadian-born counterparts to work in roles requiring only a high school diploma or less (16.1 percent versus 2.8 percent). Across Organisation for Economic Co-operation and Development (OECD) countries, roughly one-third of workers are employed in jobs that do not match their qualifications or field of study, with Canada exceeding the OECD averages (OECD 2024). Although job mismatches are common, Canada’s relatively high rates are concerning because they can contribute to underemployment, lower wages, reduced job and life satisfaction, and slower career progression (Lovei 2026). At the macroeconomic level, job mismatches can also weigh on productivity. OECD analysis finds that countries and industries with better alignment between workers’ qualifications and job requirements tend to achieve higher labour productivity, and labour market mismatches account for an estimated 15 percent of Canada’s productivity gap with top-performing countries (OECD 2024).
Beyond educational and qualification mismatches, the share of immigrants reporting that they possess more skills than their jobs require is broadly similar to that of Canadian-born workers, at approximately 30 percent (Lovei 2026). However, notable differences emerge among workers with less than 10 years of work experience. In particular, recent immigrants with less than five years of work experience are more likely to report being over-skilled for their jobs (22.5 percent) than their Canadian-born counterparts (14.2 percent). This gap suggests that recent immigrants continue to face barriers to accessing roles that fully utilize their qualifications and skills.
Geographic Barriers to Mobility
Labour shortages coexist with overall labour market slack when workers’ skills, experiences, or locations do not align with employers’ needs. In such cases, employers in certain sectors may continue to report hiring difficulties even when unemployment is relatively high. Geographic barriers compound this challenge.
For example, Saskatchewan experienced a relatively tight labour market with about 2.1 unemployed persons per vacant position, while Newfoundland and Labrador had more than six unemployed persons per vacant position (Figure 11). Yet the long-term vacancy rate in both provinces exceeded 30 percent, indicating that employers in both regions face persistent difficulty finding workers with the right skills, regardless of overall labour availability. As a result, labour market imbalances persist across regions, with limited adjustment through geographic mobility. Workers in high-unemployment regions do not always relocate to areas with stronger labour demand due to barriers like occupational licensing differences, housing affordability constraints, relocation costs, and personal or family considerations. At the same time, persistently high long-term vacancy rates in both high- and low-unemployment regions indicate that these imbalances also reflect deeper mismatches between workers’ skills and employers’ requirements.
Shifting Skill Demands
Beyond technical skills, employers increasingly demand social and emotional skills – including critical thinking, problem-solving, communication, collaboration, and adaptability – as these abilities are less likely to be automated and often take time to develop.2423 A recent survey conducted by the Future Skills Centre found that the most in-demand skills over the next three years will be digital skills, communication skills, and adaptability. For more information, see https://fsc-ccf.ca/research/national-survey-sme/. Between 2012 and 2022, demand for language and social skills increased the most in occupations highly exposed to AI (OECD 2025).
Technological change is reshaping the types of skills employers seek. With digitalization, automation, and AI increasingly performing routine tasks, many jobs require stronger analytical, interpersonal, and problem-solving abilities. These shifting skill demands are partly reflected in employment trends by skill level, which are primarily education- and credential-based.
Since 2015, high-skill employment in Canada has grown by 42 percent, while low-skill employment has remained essentially flat and has not recovered to its pre-pandemic level by 2025 (Figure 12). The divergence accelerated during the pandemic: between 2019 and 2021, high-skill employment grew by 14 index points, while low-skill employment fell by 9 points and has since recovered only marginally. This widening gap shows the growing divide in labour market opportunities across skill groups and the mounting disadvantage faced by workers in routine and low-skill occupations.
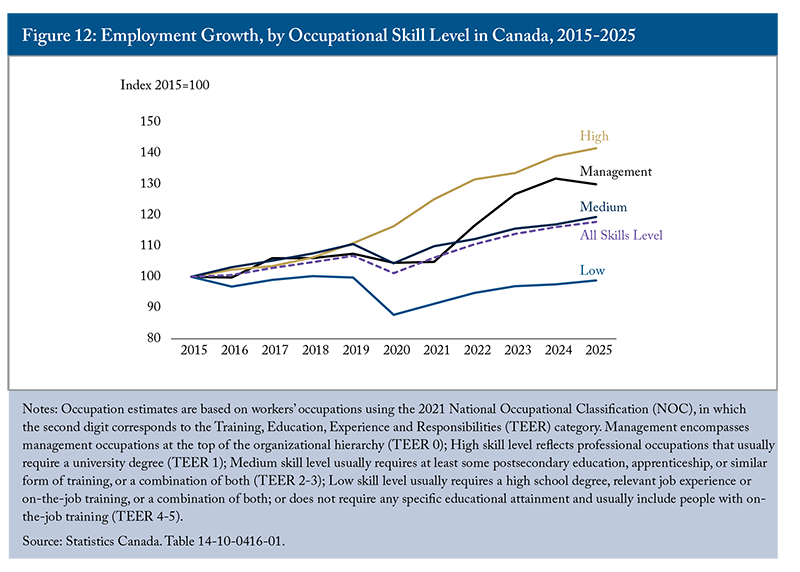
But management employment – which had grown steadily since 2015 – declined in 2025, bucking the trend across all other skill categories. This may reflect a combination of demographic turnover as older managers retire, corporate restructuring, and cost-cutting amid heightened economic uncertainty.
Addressing these structural mismatches – across sectors, regions, and skill groups – is unlikely to happen automatically as the economy recovers and will require deliberate policy interventions to retrain displaced workers, improve credential recognition, and reduce barriers to geographic and occupational mobility.
Overall, the labour market adjustment in 2025 became increasingly uneven across occupations, sectors, and worker groups. While employment continued to grow in many high-skill occupations, hiring weakened, unemployment duration increased, and many recent immigrants remained overqualified for their jobs. These patterns suggest that labour market conditions cannot be understood through aggregate employment trends alone, as access to available jobs increasingly differed across demographic groups and career stages.
Outcomes by Demographic Characteristics
Youth Unemployment
Youth unemployment reached 13.8 percent in 2025, up from 10 percent recorded in 2022, reversing post-pandemic gains and returning to 2012-13 levels (Figure 13). Aggregate figures, however, mask an important age divide in labour market experiences. Unemployment among 20-24-year-olds – who are more likely to be transitioning into full-time, permanent work and entering the early stages of their careers – provides a more reliable gauge of early-career prospects, while teenage unemployment is more heavily influenced by schooling patterns and part-time employment.
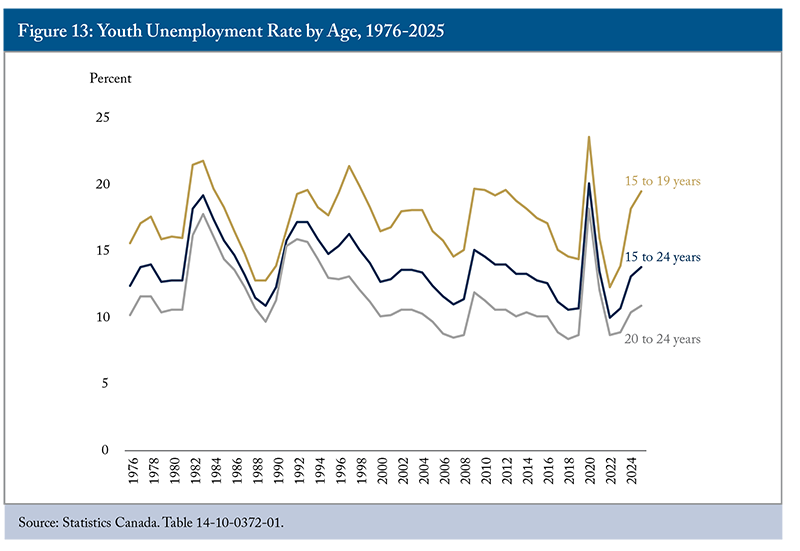
The unemployment rate for this group (young adults aged 20-24) increased from 8.7 percent in 2022 to 10.9 percent in 2025, signalling deteriorating entry-level opportunities and raising concerns about potential scarring effects, which can translate into lower lifetime earnings (Mahboubi and Higazy 2022). These effects may also delay homeownership, family formation, and retirement savings, with broader implications for housing demand and consumption patterns.
While young adults generally experience higher unemployment than prime-age adults due to lack of experience, the gap between unemployment among 20-24-year-olds and prime-age adults varies considerably across provinces, pointing to differing degrees of youth-specific barriers to labour market entry (Figure 14). Provinces such as Ontario and New Brunswick exhibit relatively large gaps despite moderate prime-age unemployment, indicating youth-specific barriers to labour market entry. By contrast, in Newfoundland and Labrador, elevated unemployment across both age groups reflects broader regional labour market weakness. Quebec and Saskatchewan, with lower youth unemployment and smaller gaps, point to comparatively smoother school-to-work transitions.
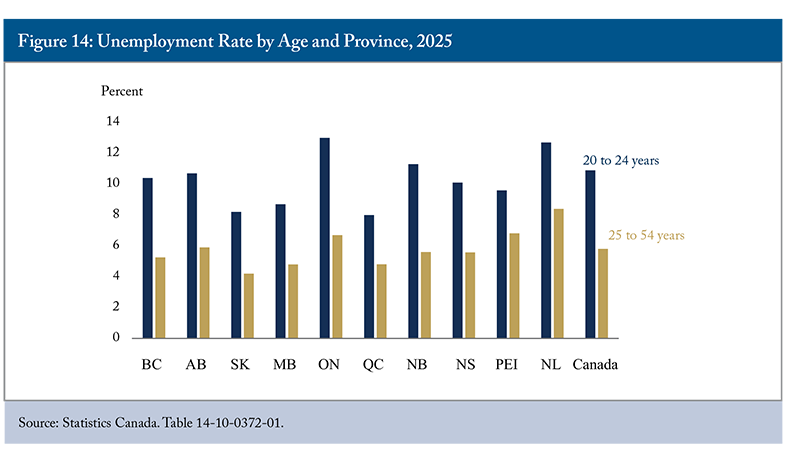
These differences suggest that elevated youth unemployment in 2025 cannot be understood solely as a cyclical phenomenon and reflects, in part, structural barriers affecting labour market entry. Additional evidence points to a deterioration not only in the incidence but also in the duration of youth unemployment. Among those aged 15-24, the average duration of unemployment rose from 10.1 weeks in 2022 to 15.9 weeks in 2025, while the share of unemployed for at least 27 weeks more than doubled. This pattern is consistent with a labour market in which job-finding rates have slowed, increasing the risk of longer-term scarring effects among young adults and recent graduates.
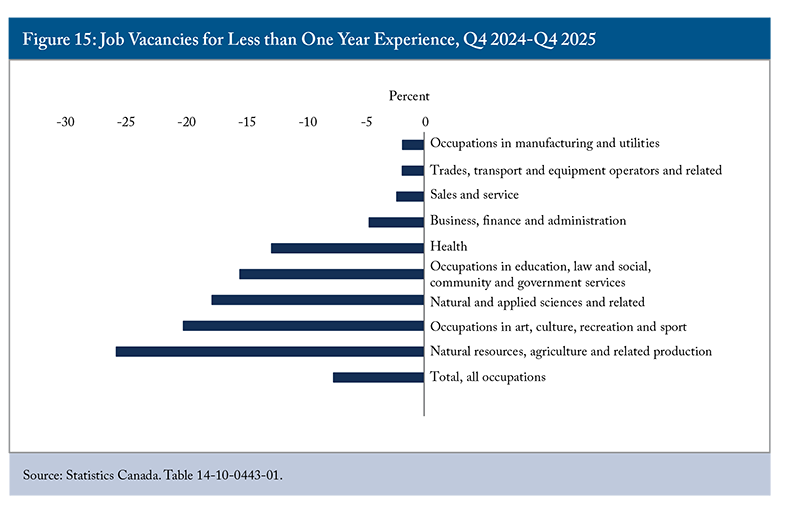
Evidence from job vacancies reinforces the view that worsening demand-side conditions have made labour market entry more difficult for young adults. The share of entry-level job vacancies is declining,2524 Bank of Canada. “Structural change—Canada at a crossroads.” https://www.bankofcanada.ca/2026/02/structural-change-canada-at-a-crossroads/. and vacancies requiring less than one year of experience declined across all occupational groups between the fourth quarter of 2024 and 2025 (Figure 15), compressing the pool of opportunities available to new entrants. The largest declines among service jobs occurred in arts, culture, recreation, and sport (–19.9 percent), education and social services (–15.2 percent), and health (–12.6 percent), sectors that traditionally employ large numbers of young and early-career workers. The decline in health is notable given that overall healthcare employment rose substantially in 2025. This likely reflects two dynamics: many entry-level positions were successfully filled, contributing to employment growth, while remaining vacancies increasingly required experienced workers – suggesting that new entrants face higher barriers to breaking into the sector even as it expands.
The credential-to-vacancy mismatch adds a further structural layer to these challenges. In the fourth quarter of 2025, half of all job vacancies (234,900) required postsecondary training or education, while 63 percent of unemployed workers had that level of education attainment (881,600). Job vacancies declined across all education levels between the fourth quarter of 2024 and 2025.2625 See Figure A7 in the Online Appendix. During this period, vacancies requiring a university certificate, diploma, or degree above the bachelor’s level dropped the most by 16.1 percent, followed closely by positions requiring a non-university certificate or diploma (–14.4 percent). Compared with other education levels, non-degree-holders face relatively tighter labour market conditions in 2025. Positions requiring postsecondary education below a bachelor’s degree had an unemployment-to-job vacancy ratio of 3 in Q4 2025, while positions requiring a bachelor’s degree or higher experienced a much higher ratio of 5.2.
Currently, there is little evidence that declining labour demand is due to AI adoption (OECD 2025). From Q4 2022 to Q3 2025, job vacancies in occupations potentially more exposed to and less complementary with AI declined at a rate similar to occupations less exposed to AI (Mehdi and Frenette 2026). Canadian businesses continue to report limited expectations for AI-related employment impacts. In the third quarter of 2025, nearly 70 percent of businesses planning to implement AI over the next 12 months expected no change in employment levels (Bryan, Sood and Johnston 2025). Even among businesses already using AI in the previous quarter, the vast majority (89.4 percent) reported no change in employment levels (Bryan, Sood and Johnston 2025).
However, AI is already changing how Canadian workers perform their jobs and what skills they require. As digitalization, automation, and AI increasingly take on routine tasks, entry-level roles now demand higher skills, raising the baseline qualifications for many jobs. Workers will need to acquire new skills or deepen existing ones to keep up with the pace of technological change. Training and career guidance systems, as a result, need to be improved to meet these changing needs.
Immigration
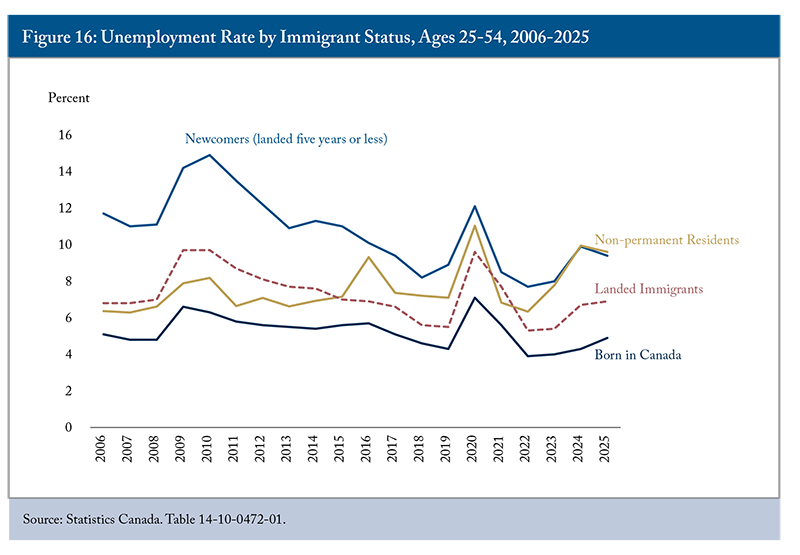
Core-aged recent immigrants and non-permanent residents also experienced high unemployment rates in 2025, at 9.4 percent and 9.6 percent, respectively – nearly twice the rate for Canadian-born workers (Figure 16). For non-permanent residents, this was the highest unemployment rate recorded compared to any pre-pandemic period between 2006 and 2019. Recent immigrants and non-permanent residents are generally more vulnerable to economic downturns and tend to experience greater employment difficulties than more established immigrants when labour market conditions weaken.
Immigrant overqualification remains a persistent concern. In September 2025, over a third (34.7 percent) of recent immigrants with postsecondary education reported being overqualified for their jobs, an increase of 4.2 percentage points from a year earlier.2726 Statistics Canada. “Labour Force Survey, September 2025.” https://www150.statcan.gc.ca/n1/daily-quotidien/251010/dq251010a-eng.htm. By contrast, the share fell slightly among Canadian-born workers (down 1.2 percentage points to 18.5 percent) and remained largely unchanged at 21.6 percent for established immigrants admitted more than 10 years earlier. Many factors drive these gaps: foreign credential recognition, education quality, language proficiency, Canadian work experience, and country of origin (Mahboubi and Zhang 2024).
Credential recognition poses a particular barrier. Canada’s system relies on provincial regulatory bodies with varying requirements, creating a fragmented process. According to Hardy (2026), fewer than half of working-age immigrants who applied to practice in regulated occupations had obtained full recognition of their foreign credentials and experience by the third quarter of 2024. This is especially concerning for skilled immigrants trained in healthcare, where labour shortages remain chronic. To address these barriers, several provinces have taken steps to accelerate credential recognition for foreign-trained immigrants, especially medical professionals trained in the US. However, skilled immigrants educated in many non-Western countries continue to face high rates of overqualification and lengthy, complex recertification processes. Improving the labour market integration of newcomers is critical to reducing overqualification, mitigating the short-term effects of population ageing, and supporting productivity growth.
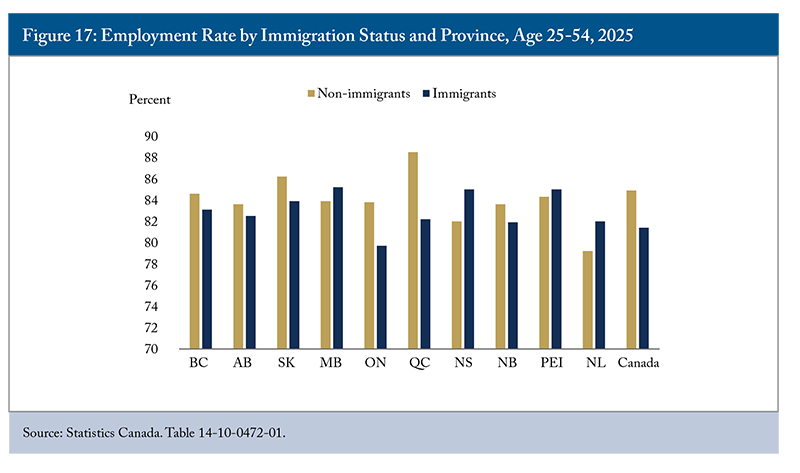
Provincial data also reveal important differences in employment outcomes. Among all provinces, only Ontario had an employment rate for prime-aged immigrants below the national average (Figure 17). In Ontario, unemployment rates for both immigrants and non-immigrants exceed the national average, reflecting generally weaker labour market conditions. However, immigrants in Manitoba and most Atlantic provinces (except New Brunswick) have a higher employment rate than non-immigrants. By contrast, the employment gap between immigrants and non-immigrants is most pronounced in Quebec, where the employment rate among non-immigrants is the highest in Canada. This gap persisted from last year (Mahboubi and Zhang 2025) and can be partly explained by the fact that the unemployment rate among immigrants in Quebec is almost twice that of non-immigrants, a gap of 3.1 percentage points. Besides the importance of French-language proficiency (Grenier and Nadeau 2011), differences in credential recognition, job matching, and the concentration of immigrants in sectors with weaker labour demand may also contribute to this pattern. Notably, the gap is particularly pronounced among recently arrived immigrant women,2827 In 2025, the employment rate for recently arrived immigrant women in Quebec (those landed five years or less) was 69.4 percent, compared to 88.6 percent for Canadian-born women, a gap of 19.2 percentage points. By contrast, recently arrived immigrant men in Quebec had an employment rate of 86.5 percent, nearly identical to the 88.4 percent rate for Canadian-born men. Although this pattern – where the employment gap between immigrants and non-immigrants is largely driven by immigrant women – is observed across all regions of Canada, Quebec’s gap is the largest. suggesting that differences in labour force participation norms among immigrant women from certain countries of origin, as well as the composition of Quebec’s immigrant intake, may also play an independent role in explaining the provincial employment gap.
Labour market outcomes for immigrants must also be considered in the context of Canada’s recent surge in the number of NPRs. Although the federal government has introduced measures to limit temporary immigration – specifically for international students and temporary foreign workers – Statistics Canada2928 Statistics Canada. Table 17-10-0121-01. https://www150.statcan.gc.ca/t1/tbl1/en/tv.action?pid=1710012101. reported that the total non-permanent resident population reached 2.8 million in Q4 2025, representing 6.8 percent of the total population.3029 However, this figure may understate the true count given divergences between Immigration, Refugees and Citizenship Canada (IRCC) administrative data and Statistics Canada’s methodology (Skuterud 2025). This remains well above the government’s goal of reducing the share of non-permanent residents to 5 percent by the end of 2027.3130 For more information, see https://www.canada.ca/en/immigration-refugees-citizenship/corporate/mandate/corporate-initiatives/levels/supplementary-immigration-levels-2026-2028.html.
Some observers may worry that new immigration targets will significantly affect labour supply and slow the economy. Given the recent softening in labour market conditions, rising unemployment, and economic uncertainties, slower labour supply growth is unlikely to pose a major national constraint in the near term, although sectors that rely heavily on immigrants, such as healthcare, agriculture, and construction, may face pressures. Policies that improve immigrant selection, promote fuller recognition and use of newcomers’ qualifications, expand employment opportunities for recent graduates and disadvantaged groups, support training for displaced workers, and facilitate interprovincial labour mobility could help alleviate sectoral and regional labour shortages.
Policy Implications
The Canadian labour market showed notable resilience despite trade uncertainty, largely because CUSMA continues to shield much of Canadian trade from tariffs and because federal and provincial governments acted quickly with billions in support for affected workers and businesses.3231 https://www.canada.ca/en/department-finance/news/2025/03/fighting-for-canadian-workers-and-businesses.html https://budget.ontario.ca/2025/chapter-1a.html#section-0. Looking to 2026, however, the external environment has become materially more challenging. The outcome of the CUSMA review is highly uncertain and will shape the trade framework for years to come. At the same time, the conflict in Iran, which began in February 2026, has added a new and compounding layer of risk.
Enhanced federal-provincial coordination is essential to ensure that support reaches workers and businesses equitably across regions. Programs vary widely across provinces, creating uneven coverage for workers in smaller or fiscally constrained regions. A joint federal-provincial trade and labour market response council would allow governments to share best practices, set minimum standards for displaced worker support, and jointly fund regional retraining infrastructure. Real-time monitoring of labour market outcomes by sector and region, linked to program funding and evaluation requirements, would improve targeting and accountability.
Improving Labour Market Outcome
As trade uncertainty persists and business investment stalls, hiring will slow, and new job seekers will struggle to find work. Youth, recent immigrants, and non-permanent residents experienced disproportionately weaker labour market outcomes in 2025, even as employment continued to grow in several high-skill occupational categories, and they face compounding risks as conditions weaken further in 2026. Addressing these specific challenges requires targeted action on multiple fronts.
To help youth, governments should strengthen and expand labour market programs, such as career counselling and job search assistance, to improve their employability (Mahboubi and Higazy 2022). These services can shorten unemployment spells and reduce the risk of repeated joblessness. Increasing labour market flexibility and mobility (both occupational and geographic) can also reduce skill mismatches and help youth secure jobs that better fit their qualifications. Governments have already invested significantly in work-integrated learning programs, co-op placements, apprenticeships, and employer incentive programs, but these programs should be regularly evaluated to ensure they improve long-term employment outcomes rather than simply increasing program participation.3332 An evaluation of the Student Work Placement Program found that while such programs improved work-ready skills and generated high employer and student satisfaction, their effectiveness was constrained by employer onboarding burdens, administrative requirements, and limited program awareness, suggesting that expansion must be paired with design improvements (Employment and Social Development Canada 2021). As the analysis above shows, job vacancies accessible to entry-level workers have declined sharply across most occupational groups, suggesting that barriers to labour market entry have become more challenging for some youth. Policy efforts should therefore focus on strengthening school-to-work transitions through better-targeted work-integrated learning opportunities, stronger apprenticeship pathways,3433 Ontario has established apprenticeship pathways that have created structured labour market entry, and the province is actively exploring mechanisms to increase both the number and quality of apprentices. and fewer administrative and workplace barriers that may discourage employers from hiring and training young workers.3534 For example, some employers’ reluctance to hire youth in the trades is linked to the challenges of supervising young workers in high-risk job site environments; complementary supports such as safety training, mentorship frameworks, and liability guidance may therefore be as important as financial incentives.
Identifying which workers have transferable skills and where the gaps lie is itself a policy challenge. Al-Akkad (2025) develops a Matching Skills model that maps occupational compatibility based on skills, knowledge, and educational requirements to address mismatches and guide reskilling during major economic transitions. The same framework can help identify transition pathways for workers displaced by trade policy shocks since 2025. Policies that use real-time labour market intelligence to match displaced workers with compatible adjacent occupations, and then fund targeted training to close specific skill gaps, would be more cost-effective and faster to deliver than broad retraining programs.
For immigrants, a persistent challenge is high rates of overqualification and underemployment rather than unemployment alone. Although immigrants and non-permanent residents are more likely than Canadian-born workers to have a university education, many work in jobs requiring only a high school diploma. Canada’s productivity will increasingly depend on how effectively it leverages and develops newcomers’ skills. Better credential recognition and career support services can help skilled migrants, including non-permanent residents, find jobs that match their qualifications and fully utilize their skills.
Better immigrant selection also matters. Although immigrants with prior Canadian education and work experience generally achieve stronger labour market outcomes, the quality and labour market relevance of those credentials and experiences vary considerably. The Express Entry selection system could, therefore, benefit from refinements to better predict labour market integration and reduce overqualification. Potential changes include incorporating pre-immigration earnings as a selection factor, strengthening language proficiency standards, and adding educational criteria that account for institutions, fields of study, and academic performance (Mahboubi 2024).3635 IRCC has recently launched public consultations on potential Express Entry reforms, proposing to simplify the system by consolidating the three existing skilled worker programs into one and updating the Comprehensive Ranking System to better reflect the latest evidence on predictors of economic success for newcomers.
Enhancing Labour Mobility
Geographic and occupational barriers to labour mobility continue to constrain Canada’s economic efficiency, a challenge that became more visible in 2025 as regional gaps in unemployment and job vacancy rates widened. While labour mobility does not increase aggregate labour supply, it can improve the matching of workers to regions and sectors experiencing stronger demand. The federal government’s passage of the One Canadian Economy Act – which included the Free Trade and Labour Mobility in Canada Act, effective January 1, 2026 – marked a meaningful step toward greater integration. However, the Act is limited to addressing labour mobility processes for federally regulated professions, while provinces and territories are independently working to improve labour mobility.3736 The federal, provincial, and territorial governments, through the Forum of Labour Market Ministers (FLMM), are working to deliver on the Pan-Canadian Labour Mobility Action Plan that was endorsed by the Committee on Internal Trade. Through the FLMM, jurisdictions are taking coordinated actions to advance labour mobility across Canada, while also implementing jurisdiction-specific improvements, including in Ontario. Despite ongoing reforms, workers and employers still face avoidable administrative and regulatory obstacles to moving between licensed professions.
The professional licensing and certification requirements of each province can cost billions of dollars (Tombe 2025) and hinder labour mobility. In the service sector, approximately 700 provincial regulatory bodies oversee professional licensing and certification requirements, where most of the estimated untapped gains are concentrated. According to the International Monetary Fund (IMF), “non-geographic, policy-related barriers within Canada average the equivalent of about a 9 percent tariff nationally” (Díez and Yang 2026). These costs are concentrated mainly in services, with barriers in sectors such as education and healthcare exceeding the equivalent of a 40 percent tariff. Model-based simulations suggest that fully removing non-geographic internal trade barriers could raise Canada’s real GDP by nearly 7 percent over the long run, or about $210 billion in today’s dollars (Díez and Yang 2026). The IMF’s 2025 G20 report also emphasizes that easing internal labour market frictions and strengthening interprovincial mobility are central to raising productivity and enhancing regional adjustment in Canada (IMF 2025).
While regulatory barriers are particularly important in licensed occupations, housing affordability constraints increasingly limit labour mobility across the broader workforce. Workers in regions with weaker labour demand may be unable or unwilling to relocate to areas experiencing labour shortages because high housing costs erode the financial benefits of moving. These constraints can prevent workers from accessing jobs that better match their qualifications and skills, contribute to persistent regional mismatches between labour supply and demand, and reduce the economy’s capacity to adjust to changing conditions. Improving labour mobility, therefore, requires not only reducing administrative and licensing barriers but also expanding housing supply and affordability in high-demand regions.
Realizing the promise of the One Canadian Economy Act will require coordinated action and a shift in regulatory culture. The default approach should move from “justification for acceptance” to “justification for refusal,” placing the onus on regulatory bodies to explain why a credential should not be recognized rather than on applicants to prove why it should. Building on this principle, we recommend the following priority actions:
- Ontario’s “As of Right” and deemed certification models – under which out-of-province workers are admitted into practice unless clearly defined exceptions apply – should be extended across Canada and for all licensed professions. Although most provinces use mutual recognition as the starting point, administrative and regulatory barriers remain.
- For professions where interprovincial standards vary significantly, governments should coordinate common baseline requirements in high-mobility, high-demand fields such as nursing, engineering, and the skilled trades. These standards should cover core elements like education, current practice, and recent work experience. Provinces could then add conditions only where they can demonstrate a genuine public safety rationale, consistent with the exceptions framework under Chapter 7 of the Canadian Free Trade Agreement.
- Credential assessment should be streamlined and harmonized across jurisdictions through a shared digital entry point where applicants can submit materials, track applications, and understand outstanding requirements.3837 While fully aligning scope of practice, training, and examination standards across regulated professions and jurisdictions is complex and not easily achieved, greater alignment in core requirements should be pursued incrementally where feasible. Legislated service-standard timelines and mandatory annual public reporting on approval outcomes, processing durations, and refusal rates would reinforce accountability.
- A pan-Canadian licensing information system should compile and publish data from provinces on application, processing times, verification steps, denial rates, and interprovincial mobility patterns to support evidence-based monitoring and reform across the country.
Enhancing Productivity
Low labour productivity remains a pressing challenge requiring urgent and coordinated action. While Canada’s productivity gap predates current trade tensions, ongoing uncertainty has worsened the problem by discouraging business investment, which is crucial for equipping workers with the tools needed to raise output (Robson and Bafale 2025). Without deliberate policy intervention, productivity growth is likely to stagnate further, limiting both competitiveness and living standards.
Strengthening business investment in productivity-enhancing assets, including information and communication technology, machinery, equipment, and intellectual property, needs to be a policy priority. Canadian investment in these areas lags the United States and many OECD peers, constraining both output and wages. Streamlined regulations, reduced red tape, and fiscal incentives that align personal and corporate taxation with investment goals are essential to reverse this trend (Robson and Bafale 2025).
Equally important is preparing the workforce for the digital age. To fully leverage AI’s productivity potential, Canada needs a coordinated strategy, aligned with the Pan-Canadian Artificial Intelligence Strategy and broader digital economy initiatives, to equip workers with the skills required in an AI-driven economy. Educational institutions, industry, and governments should work together to expand experiential learning, on-the-job training, and flexible upskilling opportunities that help workers adapt to rapidly evolving technologies. Small- and medium-sized enterprises, which represent most of Canada’s employers, also need additional support to evaluate current and future skill needs as they often lack the financial and human resources to recruit and retain skilled employees (Mahboubi and Zhang 2023).
Building institutional capacity to anticipate skill needs is also important. Al-Akkad (2025) recommends that Employment and Social Development Canada enhance its Occupational and Skills Information System (OaSIS) to incorporate emerging occupations driven by decarbonization, digitization, and AI. The system could evolve into a centralized labour market intelligence platform that maps skills adjacencies, links to training providers, and forecasts sector-specific demand. Without a reliable, forward-looking skills database, training programs risk misaligning with occupations that are actually growing – a particularly costly gap during periods of rapid structural change such as the one Canada is navigating in 2025 and 2026.
Ultimately, addressing Canada’s productivity shortfall requires simultaneous action on investment, regulation, taxation, and workforce development. By equipping both businesses and workers with the skills they need, Canada can translate technological adoption into productivity gains and sustained economic growth.
Conclusion
Overall, Canada’s labour market in 2025 reflects a broad-based but uneven cooling. Employment growth slowed, unemployment rose, and the exceptional tightness of the post-pandemic recovery gave way to a more cautious environment shaped by trade uncertainty, weaker business investment, and slowing labour force growth. For most of the economy, the adjustment has been gradual rather than severe – reflecting, in part, the continued protection afforded by CUSMA and the rapid government response to tariff-related disruptions.
Yet beneath the aggregate figures, pressures are more acute for specific groups and sectors. Youth, recent immigrants, and non-permanent residents bore a disproportionate share of the slowdown, facing higher unemployment, rising long-term joblessness, and increased overqualification. Trade-exposed sectors – particularly manufacturing, transportation, and automotive – experienced significant employment losses, only partially offset by gains in domestically oriented sectors. And Canada’s productivity gap with the United States, already a long-standing concern, risks widening further as trade uncertainty suppresses the business investment needed to raise wages and living standards.
Looking ahead, the challenges are intensifying. The CUSMA review scheduled for July 2026 introduces fundamental uncertainty about the trade framework underpinning nearly 2.6 million Canadian jobs linked to US demand. The Iran conflict has added a new layer of global economic disruption – driving up oil prices, straining supply chains, and clouding the investment outlook at precisely the moment Canada needs firms to hire and expand. Against this backdrop, the emergency measures deployed in 2025, while effective in limiting immediate damage, are only a stopgap.
Addressing Canada’s labour market challenges over the medium and long term requires sustained action on four structural fronts:
- Strengthening the policy response to trade and geopolitical uncertainty, including enhanced federal-provincial coordination;
- Improving labour market outcomes for youth and immigrants by ensuring existing employment and work-integrated learning programs are well targeted and regularly evaluated, strengthening credential recognition, and reforming immigrant selection to better predict labour market integration;
- Enhancing labour mobility by removing occupational licensing barriers that prevent workers from moving to where demand is strongest; and,
- Restoring productivity growth by closing Canada’s investment gap with the United States through tax reform, regulatory improvement, and a coordinated strategy to equip workers with the skills required in a digital economy.
Together, these priorities form an agenda not just for weathering the current period of uncertainty, but for building a labour market capable of supporting broad-based prosperity in the years ahead.
The authors extend gratitude to Mawakina Bafale, Daniel Schwanen, Mikal Skuterud, Steven Tobin, Rosalie Wyonch, and several anonymous referees for valuable comments and suggestions. The authors retain responsibility for any errors and the views expressed.
REFERENCES
Al-Akkad, Lin. 2025. “Future-Ready Workforce Strategies and Matching Skills Model: The Energy Transition Case.” Working Paper. Toronto: C.D. Howe Institute. September 9.
Almeida, Elaine, Zak Cutler, Greg Kudar, Richard Luft, and Rob Palter. 2025. “Addressing Canada’s Productivity Gap: A Journey Towards Global Leadership.” McKinsey & Company. May.
Bank of Canada. 2026. “Providing Stability Through Uncertainty.” Speech Summary. March.
____________. 2025. “Business Outlook Survey—Third Quarter of 2025.” October.
Bounajm, Fares, and Tessa Devakos. 2025. “Benchmarks for Assessing Labour Market Health: 2025 Update.” Bank of Canada Staff Analytical Note No. 2025-17.
Bryan, Valerie, Shivani Sood and Chris Johnston. 2025. “Analysis on expected use of artificial intelligence by businesses in Canada, third quarter of 2025.” Statistics Canada. Analysis in Brief, 11621M.
Cette, Gilbert, Jimmy Lopez, Giuseppe Nicoletti, and Océane Vernerey. 2026. “The Potential Impact of Pro competitive Regulatory Reforms on Productivity and Growth in Canada.” International Productivity Monitor 49. Commissioned by the Competition Bureau Canada.
Clarke, Sean, and Andrew Fields. 2025. “Recent Employment Trends in Industries Dependent on U.S. Demand.” Statistics Canada. Catalogue no. 36-28-0001. December.
Clarke, Sean, Craig Stewart, and Antoine Trifonov. 2026. “Value Added and Job Creation Associated with Canadian Manufacturing Exports to the United States: An Update from the 2024 Value Added in Exports Data.” Statistics Canada. Catalogue no. 13-605-X. May.
Employment and Social Development Canada. 2021. “Evaluation of the Student Work Placement Program.” November.
Faryaar, Hassan, Carlos Rosell, and Nina Stegnjaic. 2026. “The Impact of Competition Intensity on Labour Productivity Growth in Canada.” Analytical Studies Branch Research Paper Series, 490. Statistics Canada.
Frenette, Marc, and Tahsin Mehdi. 2025. “Socioeconomic Characteristics of Workers in Industries Dependent on United States Demand for Canadian Exports.” Statistics Canada. July 23.
Gellatly, Guy, and Carter McCormack. 2025. “Recent developments in the Canadian economy: Fall 2025.” Statistics Canada. October 22.
Gu, Wulong, and Michael Willox. 2023. “The post-2001 productivity growth divergence between Canada and the United States: The role of the information and cultural services industry.” Economic and Social Reports. Ottawa: Statistics Canada.
Hardy, Vincent. 2026. “Labour Market Experiences of Recent Working-Age Immigrants and Non-Permanent Residents, 2019 to 2024.” Statistics Canada. April 7.
Harrison, Peter, and Andrew Sharpe. 2024. Productivity in the Public Service: A Review of the Literature. CSLS Research Report 2024-06. Centre for the Study of Living Standards.
International Monetary Fund. 2025. G20 Report on Strong, Sustainable, Balanced, and Inclusive Growth. Washington, DC: International Monetary Fund.
Lovei, Marton. 2026. “Job Mismatch Among Core Working Age Immigrants with Postsecondary Education.” Statistics Canada. April 7.
Mahboubi, Parisa, and Amira Higazy. 2022. Lives on Hold: The Impact of the COVID-19 Pandemic on Canada’s Youth. Commentary 624. Toronto: C.D. Howe Institute.
Mahboubi, Parisa, and Tingting Zhang. 2023. Empty Seats: Why Labour Shortages Plague Small and Medium-Sized Businesses and What to Do About It. Commentary 648. Toronto: C.D. Howe Institute. November.
___________. 2024. Harnessing Immigrant Talent: Reducing Overqualification and Strengthening the Immigration System. Toronto: C.D. Howe Institute.
___________. 2025. Labour Market Review 2024: Challenges, Trends, and Policy Solutions for Canada. Toronto: C.D. Howe Institute.
Mahboubi, Parisa. 2025. “More Work Needed on Immigration Reform.” Intelligence Memo. Toronto: C.D. Howe Institute. December 23.
___________. 2024. Quality Over Quantity: How Canada’s Immigration System Can Catch Up With Its Competitors. Commentary 654. Toronto: C.D. Howe Institute. February.
Mehdi, Tahsin, and Marc Frenette. 2026. “Canadian Employment Trends in the Era of Generative Artificial Intelligence: Early Evidence.” Statistics Canada. https://doi.org/10.25318/36280001202600100003 eng.
OECD. 2024. “Adult skills and productivity: New evidence from PIAAC 2023.” OECD Policy Briefs 11. Paris: OECD Publishing.
______. 2025. OECD Economic Survey of Canada 2025. Paris: OECD Publishing.
Robson, William B.P., and Mawakina Bafale. 2025. Canada’s Investment Crisis: Shrinking Capital Undermines Competitiveness and Wages. Toronto: C.D. Howe Institute.
Sargent, Timothy. 2024. “How Has the Recent Surge in Population Growth in Canada Affected Productivity.” CSLS Research Report 2024-07. Centre for the Study of Living Standards.
Skuterud, Mikal. 2025. “The Growing Data Gap on Canada’s Temporary Resident Workforce.” E-Brief. Toronto: C.D. Howe Institute. February.
Tombe, Trevor. 2025. “One Canadian economy? Not quite yet.” The Hub.
Villeneuve, Mitch, John Fanjoy, and Neha Sarraf. 2026. “Duty Calls: Monthly Report on Canada & US Trade, December 2025.” Scotiabank.
Watt, Jenny, Wulong Gu, and Aled ab Iorwerth. 2026. “Firm Size and Labour Productivity Growth in Canadian Residential Construction.” Statistics Canada.
Vincent, Nicholas. 2025. “Toward a virtuous circle for productivity.” Bank of Canada. November 19.
Wang, Weimin. 2021. “Impacts of the COVID-19 Pandemic on Productivity Growth in Canada.” Economic and Social Reports. Catalogue no. 36-28-0001. Statistics Canada.