


by Pierre-Carl Michaud and David Boisclair
- Canada’s retirement income system has generally served seniors well. Average income replacement rates remain high, poverty among seniors is low, and seniors’ median net worth has more than doubled in real terms since 1999.
- But cracks are emerging. Public and private pensions now replace 10 percentage points less of pre-retirement income than two decades ago, low replacement rates are becoming more common among lower-middle earners, private-sector pension coverage is declining, and OAS is steadily losing ground as a source of income replacement.
- The authors argue that Canada should rethink how the system delivers income replacement and poverty protection. They propose exploring a targeted “Canadian seniors benefit” combining OAS and GIS, shifting OAS’s income-replacement role to an expanded CPP/QPP, and strengthening employer-based retirement savings for workers without workplace pensions.
The authors wish to thank Xavier Dufour-Simard and Francois Laliberté-Auger for their assistance in carrying out some of the analyses contained in this paper. The authors also extend their gratitude to Sebastien Betermier, Colin Busby, David Dodge, Malcolm Hamilton, Sarah Hobbs, Abid Kazmi, Sébastien LaRochelle-Côté, Alexandre Laurin, Bernard Morency, James Pierlot, William B.P. Robson, Allan Shapira, Richard Shillington, John Stapleton, Michael Veall, and several anonymous referees for valuable comments and suggestions. The analyses contained in this paper were carried out at the Quebec Inter-university Centre for Social Statistics (QICSS), a member of the Canadian Research Data Centre Network (CRDCN). The activities of QICSS are made possible by the financial support of the Social Sciences and Humanities Research Council (SSHRC), the Canadian Institutes of Health Research (CIHR), the Canada Foundation for Innovation (CFI), Statistics Canada, the Fonds de recherche du Québec and all the Quebec universities that contribute to their funding. Conclusions, interpretations, and possible errors remain our own.
Introduction
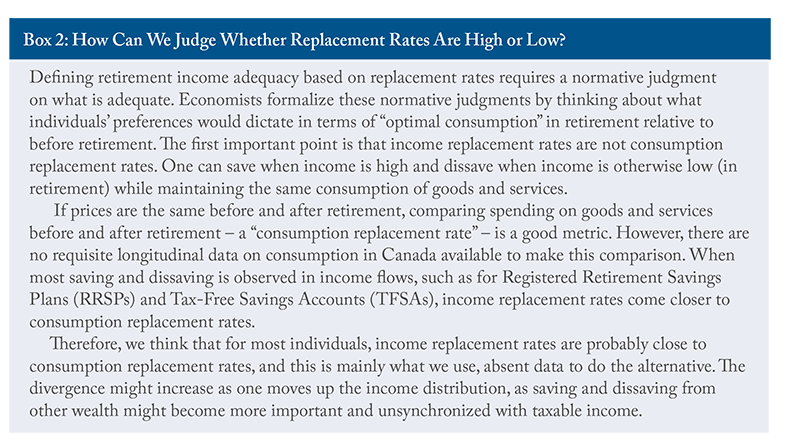
Over the past decade, there has been little investigation into how seniors are faring with respect to the retirement system’s two key objectives: helping individuals sustain their standard of living in retirement (income replacement) and protecting them from financial hardship at older ages (poverty alleviation).
This stands in contrast to the rich policy discussion that led to the 2016 federal-provincial agreement to enhance the Canada (and Quebec) Pension Plan (CPP/QPP). Discussions focused on several major developments. The arrival of the first cohorts with full CPP/QPP earnings histories had helped lower poverty among seniors (Milligan 2008). Increased generosity in the Guaranteed Income Supplement (GIS) and CPP/QPP also contributed significantly to declining poverty rates (Schirle 2013). As Veall (2008) argued, the retirement income system was largely accomplishing its poverty alleviation objective. On income replacement, the debate leading to CPP/QPP enhancement made clear that overall rates were high in the population (LaRochelle-Côté et al. 2008; Ostrovsky and Schellenberg 2009). However, mid-earners without employer pension coverage were most at risk because public pensions offer relatively low replacement rates for them11 Throughout, “public pensions” refers to the first two pillars of the system – OAS/GIS and CPP/QPP – and not to employer pension plans for public-sector workers, which belong, like private-sector plans, to the third pillar. (Ostrovsky and Schellenberg 2010). That extensive discussion took place less than two decades after another successful CPP/QPP reform took effect in 1998 (Little 2008).
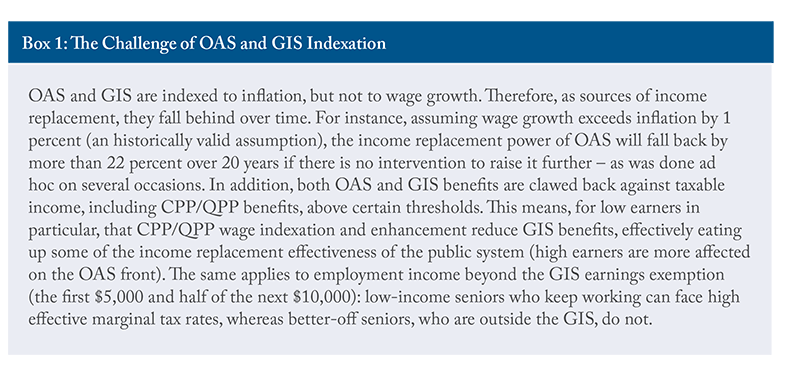
Since the discussions leading to the 2016 agreement, much has occurred, including a pandemic, a surge in inflation, and significant financial market fluctuations. Although the CPP/QPP multi-decade expansion has been rolling out effectively, retirees have faced setbacks elsewhere. The continuing decline in defined benefit (DB) plan coverage in the private sector has turned off the “automatic pilot” for many workers’ retirement savings. Meanwhile, Old Age Security (OAS) and the GIS continue to protect against poverty despite the recent inflation surge because they are indexed to prices. But they are losing ground as sources of income replacement. Unlike CPP/QPP, whose benefits at retirement reflect wage growth over a worker’s career, OAS and GIS amounts are only indexed to prices and fall behind wage growth (see Box 1). Future retirees who rely heavily on OAS/GIS will therefore see lower replacement rates than today’s retirees. These trends suggest that Canada’s retirement income system risks falling behind.
Because of the importance of the retirement income system and the growing size of the senior population, public claims abound that seniors cannot make ends meet, live in poverty, or struggle with the cost of living. These sentiments are often behind proposals to further expand pension coverage and to increase benefits for older Canadians, such as OAS. There are also those advocating the opposite; namely, that retired babyboomers fare much better than prior generations of retirees and that, as a result, OAS should be curtailed for higher-income earners and left to play only a poverty alleviation role, potentially freeing up financial resources for other uses.
This Commentary, drawing heavily on Boisclair et al. (2025a), has two aims.
- First, it investigates the financial outcomes of seniors over two decades (2002 to 2022), comparing their retirement incomes to prior earnings and taking a look at household balance sheet data. It finds that seniors have, on average, fared rather well financially, both in terms of flows (income/consumption) and of stocks (net wealth).
- Second, the paper illustrates and acknowledges the changes in income composition and income replacement at older ages in recent decades – in particular, decreasing private sector pension coverage and a retreating role of the first pillar (OAS/GIS) of the retirement income system. It then discusses some options to reform the system and refocus it on its objectives.
Data Sources to Assess Seniors’ Financial Situation
To evaluate whether the retirement income system met its objectives in the past 20 years, we mainly rely on Statistics Canada’s Longitudinal Administrative Databank (LAD). The LAD offers detailed financial information derived from the tax records of 20 percent of the Canadian population. It allows us to obtain precise income measures at multiple points over a taxpayer’s lifetime and provides information on household composition. As a complement, we use Statistics Canada’s Survey of Financial Security for balance-sheet analysis. Both datasets are subject to substantial lags: LAD data are available through 2022 and SFS data through 2023. Readers should keep these lags in mind when interpreting our findings.
When inflation peaked in 2022, interest rates rose sharply, and housing prices fell from their peak in some major markets, while financial markets rose strongly. Because public pensions are indexed to prices, seniors’ income from OAS, GIS, and CPP/QPP was largely protected; financial and pension assets have generally grown; housing wealth, by contrast, may be somewhat overstated for owners in the most affected markets.
Poverty alleviation: With respect to poverty alleviation, we use key measures of poverty that can be constructed with tax data. As is clear from the literature, there is no single perfect measure of poverty (Government of Canada 2018). We mainly use the low-income cut-offs, after tax (LICO-AT) measure, created by Statistics Canada. The LICO-AT has not been updated since 1992 and relies on meeting expenditures on housing, food, and clothing but does not account for the growing share of expenditures on transportation and communications (Noël 2017).22 An alternative measure is the low-income measure, after tax (LIM-AT). With the LIM-AT, an individual is income-poor if their after-tax income is below 50 percent of the median after-tax income in the population. In some sense, it is a synthetic relative poverty measure, comparing the income of some groups to the median income of the entire population at one point in time. Mechanically, poverty rates with the LIM-AT will increase with age as income follows an inverted-U pattern over the life cycle for most individuals. Because it is a relative measure that answers a different question (see note 10), we report the LICO-AT results in the main text. Another measure, the market-based measure (MBM), is a potentially superior alternative to LICO but data from the LAD is insufficient to compute the income concept necessary to apply that threshold (we are missing, for example, non-discretionary spending such as child support, childcare, medically prescribed health expenses, and the tenure-type adjustment for housing). Hence, we only compute LIM-AT and LICO-AT-based statistics. But it is easily computable from LAD data.
Income replacement: To evaluate the retirement income system in terms of income replacement, we calculate replacement with a measure of pre- and post-retirement income at some given ages. For this analysis, we define pre-retirement income as the average income in the age range 50 to 54, so as not to rely on a single year of income in the denominator of the replacement rate.33 This likely corresponds for most taxpayers to the peak of the income trajectory over their life cycle. The window is also early enough in the life cycle not to pick up too many early retirees. We define the post-retirement window as the tax year in which the taxpayer turns 70.44 The ages are picked to maximize the number of cohorts we can look at. The LAD starts off in 1982; therefore, the older cohort of 70-year-olds for whom we observe pre-retirement income at ages 50-54 was born in 1932 and reached age 70 in 2002. The youngest cohort was born in 1952 and reached age 70 in 2022. Our sample includes 980,000 taxpayers, roughly 34,000 of whom turned 70 in 2002 and 66,000 in 2022. Looking at later ages does not really change the picture but cuts the number of years we can look at. Conversely, looking at earlier ages increases the likelihood we catch non-retirees. Because our sample requires tax records at ages 50 to 54, it excludes immigrants who arrived in Canada after their early fifties. Such late-arriving immigrants typically receive partial OAS, have few years of CPP/QPP contributions, and rely more heavily on the GIS; our results therefore do not speak to their situation. Immigrants who arrived earlier are included, but we do not distinguish them in this analysis.
Income Replacement in Retirement
Family replacement rates (RR) on average are high, ranging from 80 percent to 90 percent (Figure 1).55 We also document individual replacement rates, not reported here. Although medians are above averages in that case, i.e., the inverse of what is found for families, the patterns are very similar to those at the family level. They increased by almost 10 percentage points (pp) between the 2002 and 2014 cohorts, before declining to roughly their levels at the beginning of the period. That hump-shaped pattern is mostly the result of changes in the denominator: pre-retirement earnings (at ages 50-54) declined slightly in real terms for cohorts turning 70 up to 2012, then rose by about 10 percent between the 2016 and 2022 cohorts (Boisclair et al. 2025a).
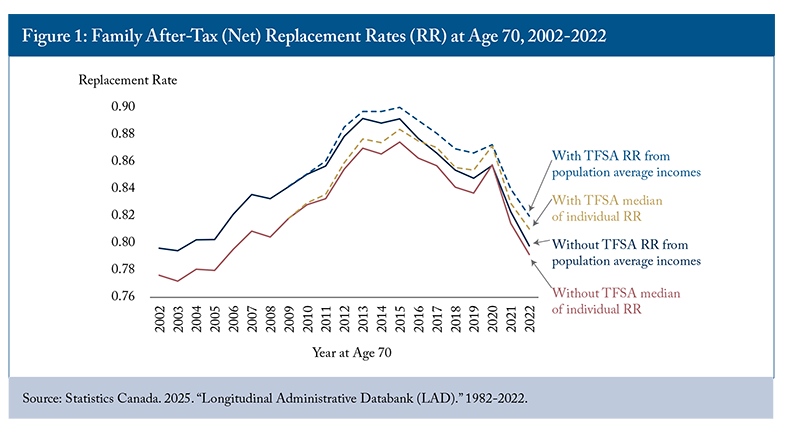
Retirement incomes, by contrast, increased steadily over the period. Including TFSA net withdrawals as income increases the RR by only 2 to 3 percentage points, with little effect on replacement rates, although this could change as TFSA use increases. Replacement rates are higher on an after-tax basis, since tax rates are lower at older ages due to several tax measures and to the progressivity of the income tax schedule.66 Our calculations lead to much higher values for average replacement rates than, say, the number published by the Organisation for Economic Co-operation and Development (OECD) in their “Pensions at a Glance” publication in 2023. In that report, the total gross replacement rate for the average earner is 57 percent, while the after-tax replacement rate is 66 percent. The main reason for this difference is that the OECD models the pension entitlements of a hypothetical full-career worker, whereas we measure realized income from all sources. In our data, public and private pensions alone replace about 48 percent of pre-retirement income in 2022 (Figure 2), not far from the OECD figure. The gap comes from sources the OECD does not model – employment and self-employment income at older ages, dividends and other investment income, and RRSP withdrawals. Differences in the denominator do not explain the gap: our pre-retirement window (ages 50-54) is close to peak earnings, which if anything lowers our replacement rates relative to a lifetime-average base.
Figure 2 shows that despite similar gross replacement rates, individual incomes at age 70 have changed composition over the past decades.77 We use gross incomes here because taxes are levied on total income and cannot be meaningfully attributed to individual income sources. Elsewhere – in Figures 1 and 3 and in the poverty analysis – we use after-tax income, which better reflects consumption possibilities. We break down income at age 70 into its different components and look at their evolution by cohort. We express the population average value of each component as a fraction of the population average total income (before tax, excluding capital gains) in the pre-retirement window. Public pensions, defined as the sum of OAS/GIS and CPP/QPP, are a very important source of income for seniors on average, but the share of pre-retirement income they replace has been declining from 31 percent of total pre-retirement income in 2002 to 27 percent in 2022. We observe a similar declining trend for private pension income (27 percent to 21 percent).88 In the LAD, private pension income includes RPP but also RRIF and taxable annuity income. RRIFs are important as RRSP balances need to be folded into a RRIF upon reaching age 71, and minimum annual withdrawals from RRIFs are mandatory. The “Pensions” variable combines these sources of income. What may seem surprising is that private pension income is declining for these cohorts, but changes to Registered Retirement Income Funds (RRIFs) over time could explain at least part of this phenomenon. Overall, public and private pension incomes have gone down from representing 58 percent of pre-retirement income to 48 percent, a drop of 10 percentage points in less than 20 years. This is a large drop coming from the three pillars of the retirement income system.
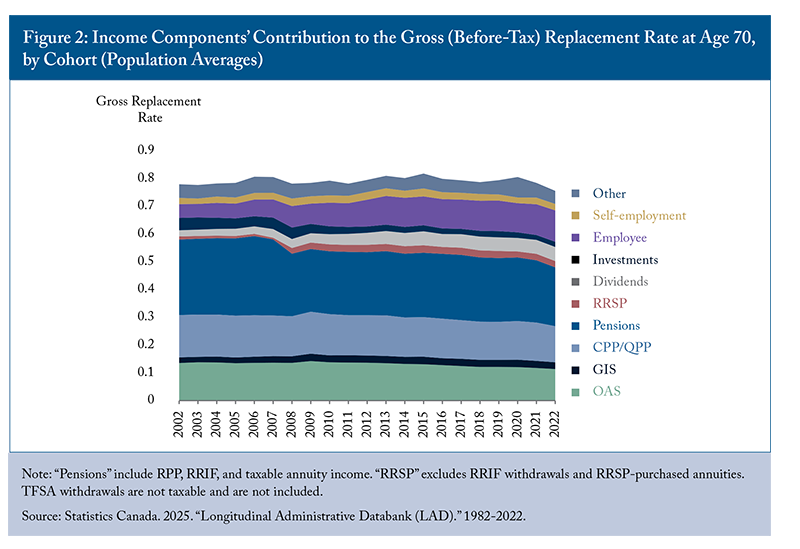
If the contribution of these sources to replacement is falling, what is keeping gross replacement rates constant? A closer look reveals that gross replacement rates do not decline accordingly because of an increase in several other income sources, notably employment (+6 pp), dividend (+3 pp), and RRSP (+1 pp; excluding RRIFs and RRSP-purchased annuities) income. Employment income at 70 is not concentrated among the better off: relative to pre-retirement income, it contributes more to replacement in lower deciles (14 pp in the third decile versus 9 pp in the eighth in 2022), although it forms a larger share of retirement income in the top decile (Boisclair et al. 2025a, Table 3).99 Employment income is not an annuity and cannot be relied upon at older ages in the way pension income can. The capacity to keep working is also unequally distributed – notably by occupation and health – which the LAD does not allow us to examine. We also observe a decline in investment income (-3 pp), which could reflect the growing importance of tax-favoured savings vehicles (RRSPs and TFSAs) over time. One can conclude that there is more diversity in income sources at age 70 than there was 20 years ago and that traditional retirement income, coming from public and private pensions, has eroded substantially as a percentage of pre-retirement income.
Income Replacement Across Income Groups
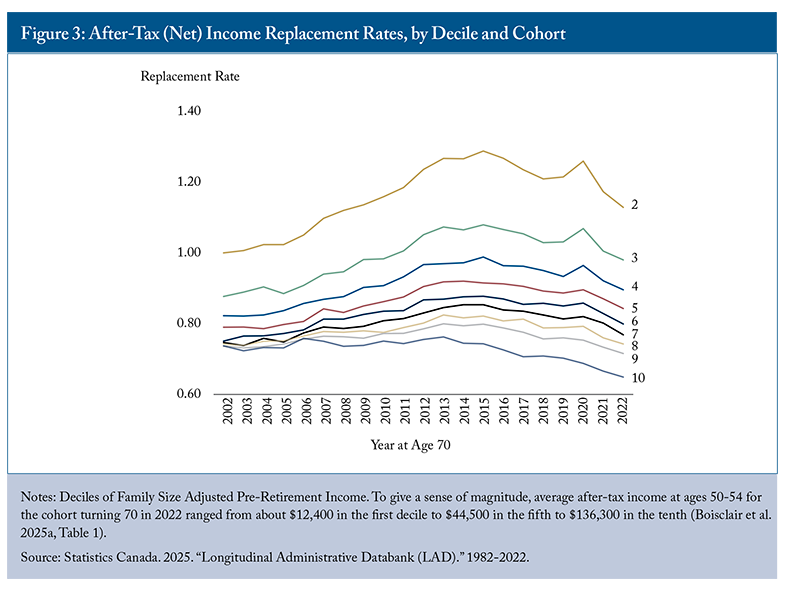
Replacement rates from public pensions decline as income rises, a well-known feature of Canada’s retirement income system. To examine how this relationship is evolving, we divide the income distribution into cohort-specific deciles of pre-retirement after-tax income and compute the RR for each decile over time. The RR for the first decile hovers around 2 and is omitted to enhance readability (Figure 3). This means that someone in the first decile sees their real after-tax income double at age 70 relative to ages 50-54. Replacement rates are thus very high at the bottom of the income distribution.
The RRs generally decrease as pre-retirement income increases. At the very top (10th decile), the replacement rate remains above 60 percent. Because saving and dissaving outside registered accounts matters more at higher incomes, income replacement rates are a less reliable guide to consumption replacement in the upper deciles, and relatively low rates there are not necessarily a sign of inadequacy. Most deciles increase until 2014 to 2016, followed by a decrease of a similar magnitude. Deciles 2 and 3 exhibit no net variation from 2002 to 2022, whereas higher deciles have positive net variations, ranging from 3 percentage points (decile 4) to 6 percentage points (decile 7) over the entire period. The only decile that sees a net negative variation is the 10th (highest earners), whose RR drops by almost 6 percentage points over the period. The decrease for this decile again reflects faster growth in pre-retirement income from 2016 onward, suggesting that this group is faring increasingly well before retirement and is therefore of less concern from a retirement-income policy perspective.
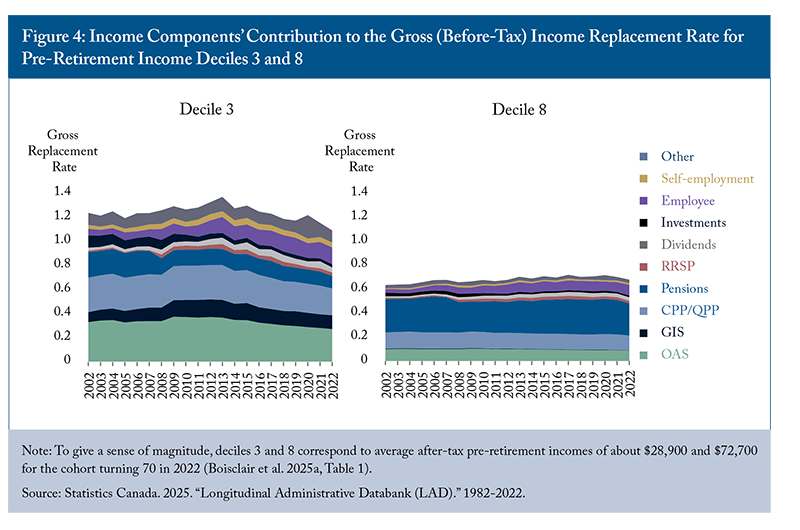
Figure 4 illustrates the difference in gross RR magnitude between the ends of the income distribution. The graph shows how lower deciles depend on public pensions (OAS, GIS, and CPP/QPP), which replaced almost 80 percent of their gross income in the early 2010s. On the other hand, the upper deciles rely a lot more on private pensions (including RRIFs). We observe in the decile 3 that public pensions have not followed the increase in pre-retirement income, resulting in a decreased contribution to the gross RR by more than 19 percentage points over the 2013-2022 period (from 80 percent to 61 percent). This trend is much less pronounced for the 8th decile, where the decline is 2 percentage points (23 percent to 21 percent) over the same period. This suggests that the deteriorating income replacement function of the public pension system is disproportionately affecting lower-income taxpayers. Overall, this leaves the bottom of the distribution most vulnerable to the erosion of public pensions and the top to the retreat of Registered Pension Plans (RPP).
Averages also mask dispersion within deciles. The share of taxpayers with replacement rates below 60 percent – a level that is hard to reconcile with standard consumption-smoothing preferences – rose by 7 to 13 percentage points across cohorts in deciles 3 to 5, and up to a third of seniors below the median have low replacement rates (Boisclair et al. 2025a). Earlier work with the same data shows that low replacement rates are concentrated among middle earners without employer pension coverage (Ostrovsky and Schellenberg 2010).
Poverty Protection in Retirement
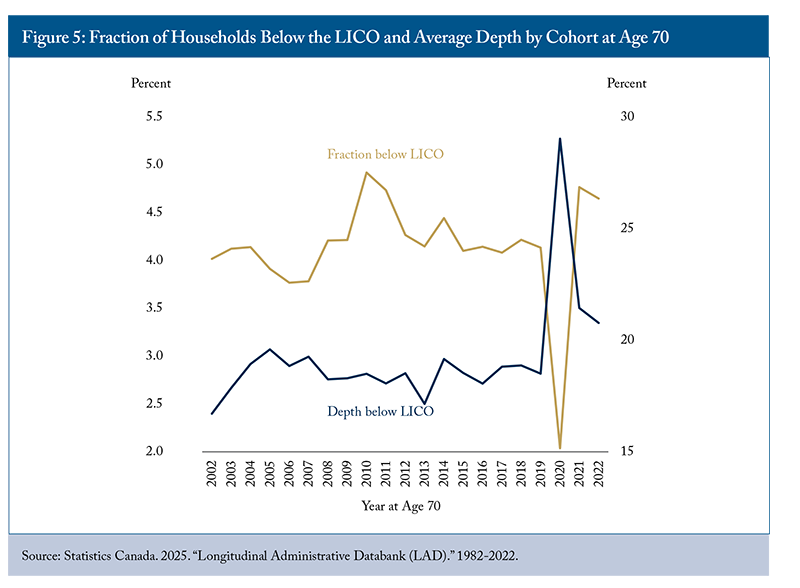
We find that the fraction of retired seniors below the LICO-AT is low (about 4 percent) and has remained very stable over cohorts, abstracting from the effect of the pandemic. The average depth, or shortfall, below the LICO over the period is also stable at around 18 percent (Figure 5). Thus, very few seniors fall below an absolute low-income threshold such as the LICO: Canada has been highly successful in protecting seniors from very low incomes. The same cannot be said for all Canadians, namely youth and working-age adults, however.
By comparison, in 2024, 5.4 percent of seniors lived below Canada’s official poverty line (the Market Basket Measure), compared with 11.5 percent of children and 12.6 percent of adults aged 18 to 64 (Statistics Canada, Table 11-10-0135-01). The dip in the low-income rate for 2020 is probably a reflection of larger transfers to households, such as the Canada Emergency Response Benefit (CERB). Overall, poverty rates are low among seniors because of the combined effect of OAS and GIS.1010 For completeness, we also compute the same statistics using Statistics Canada’s low-income measure, after-tax (LIM-AT). As explained above, this measure defines the threshold as half of the median income adjusted for household size. A key difference between this measure and the LICO-AT – which was simply indexed to inflation over time – is that real wage growth increases the LIM threshold over time. We find that over the period, the low-income fraction computed using the LIM-AT increased from 7 percent to 19 percent, and that depth increased somewhat after the pandemic, from 15 percent to 18 percent. The two measures answer different questions. The LICO captures absolute precarity, which has remained stable; the LIM captures the gap between seniors’ incomes and those of the working-age population. Its increase is therefore less a sign of rising deprivation than another manifestation of the eroding income replacement role of price-indexed OAS and GIS discussed above. Official data for the 65+ population show that the Market Basket Measure, Canada’s official poverty line, has tracked the LICO rather than the LIM (Boisclair et al. 2025a). Consistent with this interpretation, seniors have a higher LIM-AT rate (14.4 percent in 2024) than children or working-age adults, while their MBM and LICO-AT rates are much lower. In this light, it is notable that so much of the policy discussion revolves around poverty alleviation, when the erosion of the income replacement role of OAS is well underway and should be a cause for concern.
The Balance Sheet of Seniors
Income flows can be different from spending flows. When income flows include withdrawals from RRSPs and TFSAs, one also captures spending coming from the decumulation of these accounts (unless these monies are then transferred to taxable savings or to another investment use). This is therefore a good proxy, as argued above, but this will not include decumulation from other accounts and, more generally, consumption out of wealth. This can be important since a wealthy individual or household with a modest income may be better off financially, and spend more, than a counterpart with a high income but no wealth.
The most comprehensive source of data currently available on wealth holdings is Statistics Canada’s cross-sectional Survey of Financial Security (SFS).1111 The survey was fielded six times from 1999 to 2023 inclusively, with varying sample sizes. Public-use data are also available for those under age 65, but those aged 65-69 and those aged 70 and older are lumped together. Since this is not longitudinal data, Table 1 shows cross-sectional statistics over time in constant 2023 dollars for households aged 65 and older. Specifically, the table reports both the proportion of households holding various types of assets and debts as well as the median value among households with positive balances. Median total assets and median net worth are also included and are calculated across all senior households, including those with zero or negative net worth. Conditional medians for individual assets cannot be added up to obtain the totals.
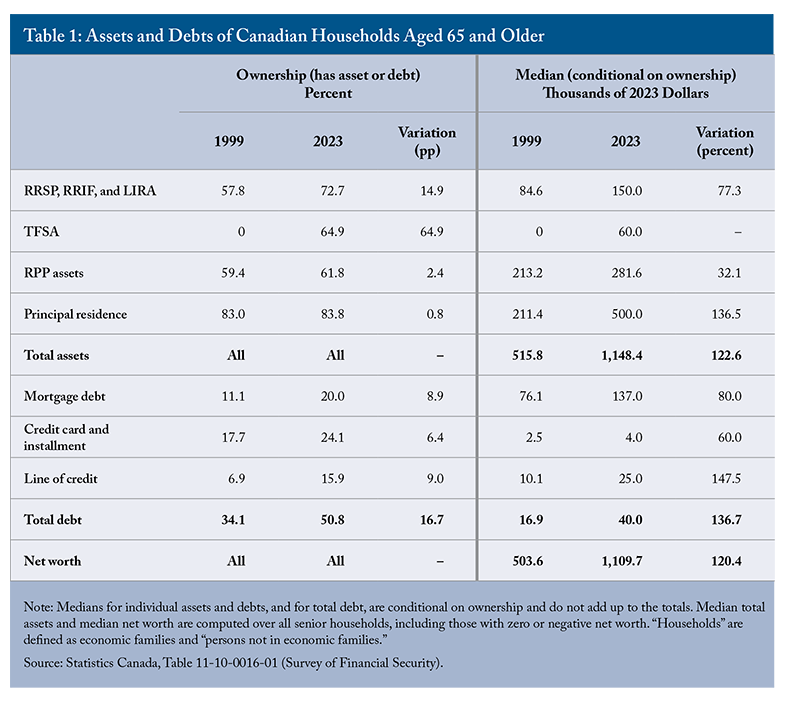
The median household net worth (assets minus debt) of those age 65+ has risen from $503,600 in 1999 to $1.1 million in 2023, or by 120 percent. This doubling over 24 years is a significant increase in the potential living standards of seniors. Of course, there is considerable dispersion, but the median senior household has a very high net worth. The share of seniors with RRSP assets rose from 57.8 percent to 72.7 percent, while the median value of those assets increased substantially, by more than 77 percent in real terms. TFSAs were introduced in 2009, and by 2023, 65 percent of households with at least one member aged 65 or older held TFSA assets, with a median value of $60,000. Importantly, while the share of households with RPP assets increased slightly over the period, the median value of those assets increased by 32 percent on average. Overall, traditional retirement savings, through pension plans and tax-favoured saving vehicles, increased substantially over time. Principal residences, held by 83 percent of senior households, also increased substantially in value: the median value among homeowners rose by 136 percent in constant dollars.1212 Translating housing wealth into consumption possibilities is complicated because selling a principal residence generally requires securing alternative housing. For individuals selling their home to become renters, the present value of future rents must be deducted from the proceeds of the sale. For those purchasing another home, only the net gain – for example, from downsizing or moving to a less expensive location – represents additional resources available for consumption. To the best of our knowledge, no Canadian studies explicitly estimate the net present value of the additional consumption that housing equity provides seniors, although some account for imputed rents or the disposition of home equity (Wolfson 2011).
Median debt increased as well by 136.7 percent over the period. But since debt is low relative to assets, its evolution does not significantly impact net worth. A few interesting changes occurred – for example, lines of credit, in particular home equity lines of credit, have more than doubled in prevalence and in median value – but traditional mortgage debt still accounted for the lion’s share of senior debt in 2023. Over the period, the share of households with mortgage debt nearly doubled to one in five (20 percent); households may have been able to borrow more on account of larger assets and rising income, but also lower interest rates (Bédard and Michaud 2021).
On average, seniors now have much higher net worth and financial equity, from which to finance consumption in retirement if they wish to do so. Even though counting home equity probably overstates the increase in net consumption opportunities coming from wealth, the overall portrait is quite positive for many in terms of non-government savings for retirement. However, this may not be available to some who have very few assets (Baldwin 2022). Notably, there is an important divide between homeowners and renters. The divide is stark: among families whose main earner was 55 to 64 in 2023, homeowners with an employer pension had a median net worth of $1.4 million, compared with $11,900 for renters without one (Statistics Canada 2024). Household type matters as well: seniors living alone, many of them widowed, had a median net worth of $475,900 in 2023, less than half that of senior families. Further complicating the interpretation of wealth differences is the increase in the average length of the retirement period, implying that one needs more financial wealth to sustain a given regular flow of consumption expenditures in retirement.
The Policy Challenges Ahead
To summarize the findings for policy, we must first note that the bottom income deciles rely on the public system (OAS, GIS, and CPP/QPP), while above the median, RPPs and other private retirement savings account for a much larger share. Hence, two issues warrant attention: 1) the future evolution of public pensions and its impact on the bottom deciles (and, perhaps less importantly, higher deciles due to CPP/QPP enhancement); and 2) the evolution of RPPs and other retirement savings arrangements and their impact on the replacement rates of individuals above the median. We discuss each in turn.
The Eroding Income-Replacement Role of OAS/GIS
With price indexation instead of wage indexation, the income replacement role of OAS/GIS has been slowly eroding, as indicated by Figure 2 – especially so for lower deciles, as shown in Figure 4. The 10 percent increase in OAS for those aged 75 and over introduced in 2022 partly offset this erosion for older seniors, but did not change the underlying indexation mechanism. And without further intervention, this will continue in the future, reducing OAS’s income replacement value by more than 22 percent over 20 years if real wage growth is 1 percent above inflation. The CPP/QPP expansion already underway will barely offset this decline in aggregate – roughly offsetting it for workers with earnings close to the Year’s Maximum Pensionable Earnings (YMPE), but not for lower earners, whose gains are smaller and partly clawed back through the GIS, while higher earners see a net gain (Boisclair et al. 2025a).
There are several possible options to adapt OAS, including a few known proposals. One would see OAS increase in generosity; another would see it curtailed; and a third would see it reshaped entirely. We review these proposals below as potential options or starting points for further policy discussions.
Option 1: Expand OAS for Those Aged 65-74
This idea was originally put forward in 2021 in a private member’s bill, Bill C-319, which died when the previous Parliament was dissolved. The content of the bill has moved to Bill C-261, which was first read in Parliament on February 9, 2026.1313 Parliament of Canada. 2026. “Bill C-261: An Act to Amend the Old Age Security Act (Amount of Full Pension).” 45th Parliament, 1st Session. A 2022 enhancement increased OAS by 10 percent for Canadians aged 75 and over; the current proposal would extend the same increase to Canadians aged 65-74.
We do not think this is the right approach for two reasons. First, an across-the-board increase is poorly targeted: poverty among seniors is now low relative to other age groups, and most of the cost would go to seniors who are not at risk of poverty. Second, it would not solve the underlying problem: a one-time increase restores some income replacement today, but with price indexation the erosion simply resumes, inviting further ad hoc increases. Relying on such raises on top of legislated inflation indexing leaves this important program – perhaps more than others due to its size and salience, as well as its single-government nature – at the mercy of political and public finance pressures.
Option 2: Start OAS Clawbacks at $100,000 of Family Income
A proposal from Generation Squeeze would cut OAS for better-off seniors – effectively lowering the clawback threshold by combining family incomes rather than treating them individually and/or increasing the rate compared to the current situation.1414 Generation Squeeze. n.d. “Fix Old Age Security.” https://www.gensqueeze.ca/fix_oas. Using the “family income” concept, contrary to individual income, which is currently the case for OAS clawback, would ensure that single or widowed individuals are not disadvantaged (the current 15 percent clawback starts at an individual income of $93,454 in 2025).
We share the premise of this proposal: any reform that refocuses OAS will, and should, ask more of better-off seniors. Our concern is rather with its design. While this would ease financial pressures on the program while protecting the poverty alleviation function for lower-income seniors, we believe this would come down to turning OAS into a “taxable GIS.” Indeed, the GIS’s very function is to ensure that seniors with little or no income other than OAS are lifted to just above some low-income threshold. It is unclear to us that duplicating this function is the best way forward. While a family-income test avoids disadvantaging single or widowed seniors, it would also end the individual character of OAS. Since its introduction as a universal benefit in 1952, OAS has provided lower-earning spouses – mostly women – with an independent source of income and could discourage couple formation later in life. Moreover, this proposal in itself is incomplete, as it does not address the erosion of income replacement above the median.
Option 3: Create a Canadian Seniors Benefit and Expand CPP/QPP
This proposal was made by one author of this paper in the Financial Post in late 2024 and in L’actualité.1515 Michaud, Pierre-Carl. 2024. “Instead of Enriching OAS, Consider Folding It into CPP/QPP.” Financial Post. October 30; Michaud, Pierre-Carl. 2026. “Revenus de retraite : le RRQ peut faire plus.” L’actualité. May 6. It would combine OAS and GIS – the OAS supplement – into a more streamlined “Canadian seniors benefit,” aimed solely at poverty alleviation, while only using CPP/QPP to achieve income replacement objectives. Canada has taken a similar approach elsewhere, for example with the Canada child benefit (CCB). This option has two distinct components: (a) replacing OAS and GIS with a targeted, federally funded “Canadian seniors benefit”; and (b) expanding CPP/QPP benefits, financed by higher contributions from workers and employers, to take over the income replacement function currently played by OAS. The two components fall under different jurisdictions – the first is federal, while the second requires federal-provincial agreement – but they are designed to go together: implementing the first without the second would amount to a cut in retirement income for middle-income workers.
More specifically, the idea consists in closing OAS as it currently exists, stripping it of its income replacement function – which has been in constant decline in recent and future decades – and moving its poverty alleviation function to an expanded GIS. The latter, which would become a targeted “Canadian seniors benefit,” would ensure that all seniors have an income at least equal to the low-income threshold. This is similar to what OAS and GIS currently accomplish together for lower-income seniors.
Consider an illustrative design for a single senior. The new benefit could guarantee the current combined maximum of OAS and GIS – about $22,800 a year in late 2026 – and be reduced by 40 cents for each dollar of other income. It would then be fully phased out at about $57,000 of other income between the current GIS cut-off ($23,112) and the OAS recovery threshold ($93,454). The reduction rate would thus be higher than the 15 percent OAS recovery tax but lower than the 50 percent to 75 percent GIS reduction rates, which would also improve work and saving incentives for low-income seniors. An earnings exemption similar to the current GIS one should also be preserved. Parameters for couples would need to be set separately. The first pillar would thus become a pure anti-poverty transfer program.
Such a redesign would have important distributional consequences, which hinge on a key difference between the two programs: OAS and GIS benefits depend on residence and current income, whereas CPP/QPP benefits depend on lifetime earnings. Keeping the new benefit tied to residence and current income is what protects seniors with low incomes, whatever their work history – including many with interrupted employment histories, caregivers, persons with disabilities, low lifetime earners, and immigrants with incomplete Canadian residence – since it would guarantee an income at least equal to the low-income threshold. By contrast, the income replacement function moved to CPP/QPP would accrue in proportion to lifetime earnings. Seniors whose current income places them above the range of the new benefit, but whose lifetime earnings were modest, would therefore lose OAS without an equivalent CPP/QPP gain. This is notably the case of lower-earning spouses in middle-income couples, often women, for whom OAS is currently an individual source of income; income testing on a family basis would remove it, unless the design preserves some individual entitlement.1616 A full microsimulation of these effects would be needed prior to implementation.
In any case, substantial savings would ensue for the federal government since OAS payments (excluding GIS) are planned to total nearly $68 billion in 2026/27. The actual size of the savings will depend on the specific parameter values for the redesigned “Canadian seniors benefit” and on the transition (see below), but would eventually amount to tens of billions of dollars a year. Then, a parallel increase in contributions would enhance CPP/QPP benefits to take over the income-replacement function of OAS. As a purely illustrative order of magnitude, replacing the maximum OAS pension for a worker with career earnings at the YMPE would require about 3 percentage points of additional contributions, split between employees and employers, on a fully funded basis.1717 This is a purely illustrative calculation, by analogy with the CPP enhancement introduced in 2019, which raises the replacement rate on earnings up to the YMPE by 8.33 percentage points (from 25 percent to 33.33 percent) for 2 points of combined contributions (1 percent each for employees and employers) on a fully funded basis. The maximum OAS pension at 65 (about $9,000 in 2026) represents about 12 percent of the YMPE, hence roughly 12/8.33 × 2 ≈ 3 points. The calculation applies at maturity, after some 40 years of contributions; assumes the same funding basis and actuarial assumptions as the 2019 enhancement; and ignores differences in QPP parameters. Because CPP/QPP benefits are proportional to earnings, workers with lower lifetime earnings would recover proportionately less of the OAS they lose, while workers above the YMPE would recover no more unless the enhancement extends above it. It also ignores behavioural responses, such as the effect of higher payroll contributions on wages and employment.This would effectively move the income replacement function of OAS “off-budget,” within a plan with strong governance, and bring it together with the rest of earnings-related income replacement in CPP/QPP. How this expansion is financed matters as much as its size. A fully funded expansion, like the one introduced in 2019, is fair across generations but takes about 40 years to mature, which, if OAS were closed at the same time, would leave middle-income workers retiring in the interim with neither OAS nor much additional CPP/QPP. A partially funded (pay-as-you-go) component would allow benefits to be paid sooner at the cost of transfers from future contributors.
Transition is the main challenge. Many workers have planned their retirement around OAS, and closing it abruptly would impose large and unforeseen losses on those who have already retired or are close to retirement – a retiree with $41,000 in income from a defined benefit pension and full CPP would lose about 15 percent of income – while a fully funded CPP/QPP enhancement would take decades to mature. The two must therefore move in step: OAS would remain in place for current retirees and cohorts close to retirement and be phased out gradually for younger cohorts as their CPP/QPP entitlements build up, with long advance notice. The CPP/QPP phase-in could also be accelerated, through two sources that can be combined: drawing on part of the assets accumulated in the base CPP and QPP and using part of the federal savings from closing OAS, for instance, to finance a partially pay-as-you-go component. Both involve transfers across generations to be weighed against the higher contributions they would imply later, and the latter would make federal savings correspondingly smaller in the short run. Beyond the transition, governments could decide whether to use the savings to lower taxes, reduce debt, or fund other priorities.
Clearly, such a major change would require careful and demanding coordination between the federal and provincial governments, at least with respect to the CPP/QPP part. Although such coordination is always a challenge in Canada, it is not unheard of. This is evidenced by the two important rounds of changes to CPP achieved in the past 30 years: in particular, the 1998 reform and the 2016 agreement to enhance the CPP; and by the contribution rate cuts announced in the federal Spring Economic Update.1818 A similar change was made in 2025 in the QPP. Cancelling those rate cuts could indeed be part of a broader remodelling under this option.
The Retreat of Private-Sector Pension Coverage
The landscape is changing rapidly for RPPs. Coverage in the private sector has eroded from an already low level, despite high hopes when Canada’s retirement system was established: 35 percent of private sector workers were covered in 1980, compared with fewer than one in four today (Boisclair et al. 2025a) – and only about 17 percent of core-age private-sector workers after correcting for double counting in official statistics (Dostie and Morris 2025). The quality of coverage has declined as well: in 1980, 90 percent of covered private-sector workers had a defined benefit plan, compared with 41 percent in 2023, so that fewer than one in 10 private-sector workers now has access to a DB pension (Boisclair et al. 2025a).1919 These rates are computed among employees and exclude the self-employed, who by definition have no RPP coverage; the share of all private-sector workers covered is therefore lower still. Recent membership growth in some jurisdictions – for instance, more than 200,000 new plan members in Ontario in 2025, mostly in DB plans (FSRA 2026) – reflects membership counts rather than coverage rates and includes public-sector plans; it has not yet translated into a reversal of the national private-sector coverage rate. As discussed, this is particularly concerning for above-median earners.
Although the primary goal of the CPP/QPP expansion currently underway was to cover workers without RPPs, this may translate into higher replacement rates for those with DB RPP coverage. Indeed, many public sector DB plans do have a so-called “integrated” structure with CPP/QPP2020 Higher RPP benefits are provided early in retirement and, when CPP/QPP benefits theoretically kick in, usually at age 65, RPP benefits are decreased with – in principle – no net effect on the combined replacement rate. – but it is too early to tell how many DB plans will have accounted for the CPP/QPP enhancement in the medium- to long-term.
However, middle- and higher-income earners without pension coverage have long been the group most at risk of inadequate income replacement. While solutions may exist to increase pension or retirement savings coverage for this target group, most are difficult or costly to implement or politically unpopular. For instance, a recent proposal in a C.D. Howe Institute Commentary (Ambachtsheer and Mazer 2026) suggests subsidizing small businesses to offer employee pensions. While this may help since cost is often a major concern for employers considering a pension plan, administrative burdens remain, and the subsidy could provide windfall gains to employers that would have offered a plan anyway. Furthermore, the very low take-up of Pooled Registered Pension Plans (PRPPs) illustrates that a stronger approach is required.
Quebec’s approach under its law on Voluntary Retirement Savings Plans (VRSPs), which requires employers to offer a basic savings plan with auto-enrolment, seems to be going in the right direction. Indeed, we have recently found that the law has resulted in increased savings in VRSPs but also in RRSPs and TFSAs (Boisclair et al. 2025b). However, enforcement is currently limited, and employer contributions remain voluntary, hampering more significant progress. Moreover, all workers are enrolled in the plans, even lower-income workers who might not benefit much or for whom an RRSP-type plan might even reduce future GIS benefits. In its most recent budget, the Quebec government has announced that it would study options to strengthen VRSPs, including a possible public VRSP managed by an independent organization, similar to the National Employment Savings Trust (NEST) in the UK.
If we are to address the income replacement gap for the target group, strengthening employer-based solutions will be needed to avoid an even larger CPP/QPP expansion than the one already underway and the one following the folding of OAS, based on option 3 above.
Conclusion
The evidence presented in this paper and elsewhere suggests that, on average, Canadian seniors have fared relatively well in recent decades and that the retirement income system has so far met its objectives in aggregate, both in overall income replacement and poverty protection. While some seniors continue to face hardship, this conclusion may surprise many and contrasts with the broader narrative of widespread financial difficulty among seniors.
Against this backdrop, the evidence also points to weaknesses that are already visible and likely to deepen:
- public and private pensions now replace 10 percentage points less of pre-retirement income than they did two decades ago;
- low income-replacement rates are becoming more frequent among lower-middle earners;
- private-sector RPP coverage keeps declining; and
- the income replacement function of OAS continues to erode and is not fully offset by the CPP/QPP expansion underway.
To date, other income sources – notably employment – have filled the gap, but they cannot be relied upon in the same way as pensions. One way forward, which we do not favour, would be to keep adjusting OAS on an ad hoc basis. Or Canada could, as we suggest, reshape OAS by folding its limited income replacement function into the CPP/QPP and merging the rest with GIS to create a “Canadian seniors benefit” that focuses solely on poverty reduction.
For income replacement above the median, private-sector RPPs and other employer-sponsored retirement savings arrangements could help bridge the growing gap, given their apparent value to workers (Dostie and Morris 2025). The enhanced CPP/QPP may also prove sufficient for this group following the current expansion and any changes that may come with the remodelling of OAS/GIS. If not, Canada could complement this approach with an “improved VRSP-like” system in which employers are encouraged or mandated to play a stronger role – as was always intended in the design of Canada’s retirement income system – or expand CPP/QPP even further still, this time above a certain level of earnings. In all scenarios, it is time to revisit Canada’s retirement income system.
References
Ambachtsheer, K., and A. Mazer. 2026. Spreading the Benefits: A Targeted Tax Credit Is Needed to Expand Retirement Plan Coverage in Canada’s Private Sector. Commentary 704. Toronto: C.D. Howe Institute. https://cdhowe.org/publication/spreading-the-benefits-a-targeted-tax-credit-is-needed-to-expand-retirement-plan-coverage-in-canadas-private-sector/.
Baldwin, B. 2022. “The Evolving Wealth of Canadians: Who Is Better Fixed for Retirement? Who Is Not?” E-Brief. Toronto: C.D. Howe Institute. https://cdhowe.org/publication/evolving-wealth-canadians-who-better-fixed-retirement-who-not/.
Bédard, N., and P.-C. Michaud. 2021. “Playing with Fire? Household Debt near Retirement in Canada.” Canadian Public Policy / Analyse de politiques 47(1): 56–71. https://www.jstor.org/stable/27034142.
Boisclair, D., X. Dufour-Simard, and P.-C. Michaud. 2025a. “Retirement Incomes in Canada: Past, Present and Future.” Retirement and Savings Institute (RSI) Working Paper 19. September. https://ire.hec.ca/en/19-retirement-incomes-in-canada-past-present-and-future/.
______________. “La Loi RVER a-t-elle augmenté l’épargne des travailleurs au Québec?” Jacques-Parizeau Research Chair in Economic Policy Working Paper 5. October. https://cjp.hec.ca/en/5-la-loi-rver-a-t-elle-augmente-lepargne-des-travailleurs-au-quebec/.
Dostie, B., and T. Morris. 2025. “The Labour Market Impacts of Employer-Pension Plans.” Retirement and Savings Institute (RSI) Working Paper 18. August. https://ire.hec.ca/en/18-the-labour-market-impacts-of-employer-pension-plans/.
Financial Services Regulatory Authority of Ontario (FSRA). 2026. “Workplace Pension Membership Increases in Ontario, but Many Could Benefit from Additional Planning Steps.” News release. March. https://www.fsrao.ca/announcements/workplace-pension-membership-increases-ontario-many-could-benefit-additional-planning-steps.
Government of Canada. 2018. Canadian Poverty Reduction Strategy: What We Heard about Poverty So Far. Ottawa: Employment and Social Development Canada. https://www.canada.ca/en/employment-social-development/programs/poverty-reduction/reports/what-we-heard.html.
LaRochelle-Côté, S., J. Myles, and G. Picot. 2008. Income Security and Stability during Retirement in Canada. Analytical Studies Branch Research Paper Series 306. Statistics Canada.
Little, Bruce. 2008. Fixing the Future: How Canada’s Usually Fractious Governments Worked Together to Rescue the Canada Pension Plan. Toronto: University of Toronto Press. October.
Milligan, K. 2008. “The Evolution of Elderly Poverty in Canada.” Canadian Public Policy / Analyse de politiques 34(Supplement 1): S79–S94. https://doi.org/10.3138/CPP.34.4.S79.
Noël, Alain. 2017. “How Do We Measure Poverty?” Policy Options. November 9. https://policyoptions.irpp.org/2017/11/how-do-we-measure-poverty/.
Ostrovsky, Y., and G. Schellenberg. 2009. Pension Coverage, Retirement Status, and Earnings Replacement Rates among a Cohort of Canadian Seniors. Analytical Studies Branch Research Paper Series 321. Statistics Canada. https://www150.statcan.gc.ca/n1/en/catalogue/11F0019M2009321.
______________. 2010. A Note on Pension Coverage and Earnings Replacement Rates of Retired Men: A Closer Look at Distributions.
Schirle, T. 2013. “Senior Poverty in Canada: A Decomposition Analysis.” Canadian Public Policy / Analyse de politiques 39(4): 517–540. https://doi.org/10.3138/CPP.39.4.517.
Statistics Canada. 2024. “Survey of Financial Security, 2023.” The Daily. October 29. https://www150.statcan.gc.ca/n1/daily-quotidien/241029/dq241029a-eng.htm.
Veall, M. R. 2008. “Canadian Seniors and the Low Income Measure.” Canadian Public Policy / Analyse de politiques 34(Supplement 1): S47–S58. https://doi.org/10.3138/CPP.34.SUPPLEMENT.S47.
Wolfson, M. 2011. Projecting the Adequacy of Canadians’ Retirement Incomes. Institute for Research on Public Policy. https://irpp.org/research-studies/projecting-the-adequacy-of-canadians-retirement-incomes/.