


From: Don Drummond and Nicholas Dahir
To: Labour force watchers
Date: November 3, 2026
Re: Latest Survey Reveals the Labour Market Weakness Lurking Under the Surface
Coverage of Statistics Canada’s Labour Force Survey focuses on the unemployment rate and the change in employment. The unemployment rate suggests a robust labour market. Other data from the survey such as the labour force participation rate, hours worked and wages reveal considerable weakness.
First, a look at these familiar measures. The unemployment rate is reasonably low. Since 1976 Canada’s unemployment rate has averaged a little over 8 percent. In September 2025 the unemployment rate stood at 7.1 percent, one year later it is down to 6.5 percent. But this decline was not driven by strong job growth. Employment increased just 0.5 percent from September 2025 to September 2026, averaging 7,900 gains per month. Recent employment growth shows a sharp downward trend when compared to the 1.6 percent growth between September 2023 and September 2024 and the 1 percent growth between September 2024 and September 2025.
While employment grew modestly, total hours worked declined 0.1 percent year-over-year in September 2026. Growth in hours worked, like employment, has experienced a sharp decline in recent years. Hours worked increased 2.9 percent from September 2022 to September 2023, 1.6 percent from September 2023 to September 2024 and 0.7 percent between September 2024 and September 2025. With a decline in average hours worked offsetting the modest employment gain, the total volume of work done in the Canadian economy has stagnated over the past year.
When the labour force fails to keep pace with employment growth, the unemployment rate declines. In September 2026, the labour force shrank by 0.1 percent year-over-year (an average monthly loss of more than 2,000), compared with 12-month growth of 2.7 percent in September 2024 and 1.7 percent in September 2025.
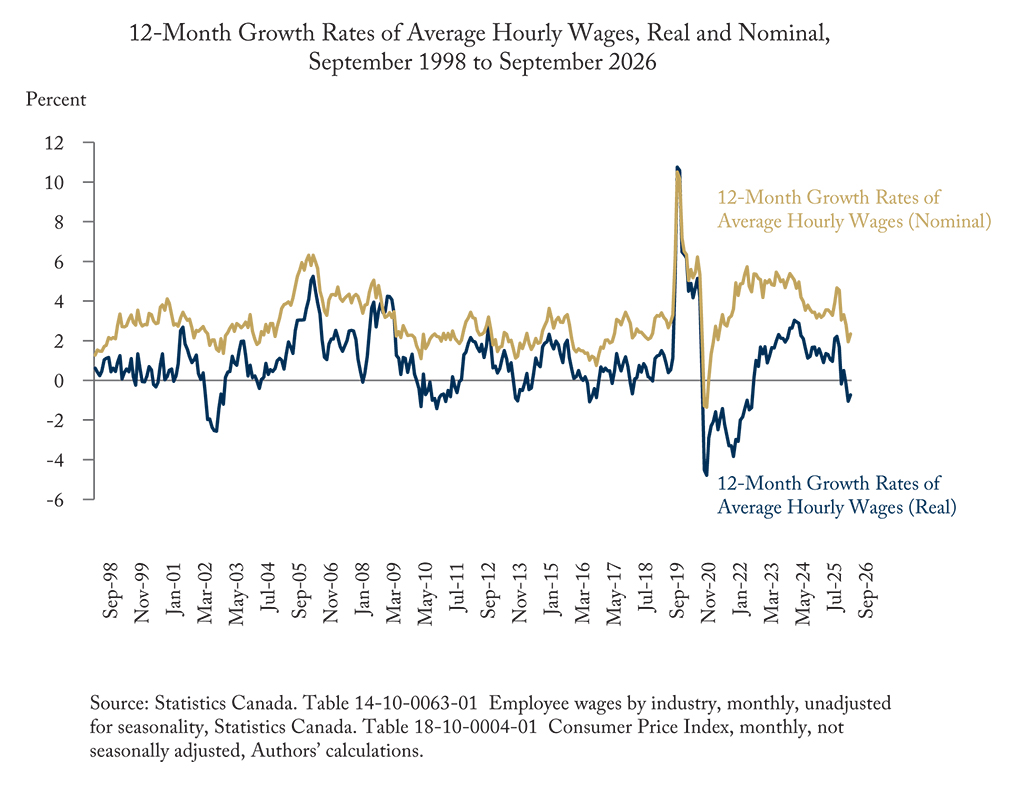
The Labour Force Survey reports that average hourly wage growth has slowed, increasing only 2.3 percent year-over-year in September 2026, compared with 4.6 percent from September 2023
to September 2024 and 3.3 percent from September 2024 to September 2025.
Worse, with the latest CPI inflation reading at 3.1 percent, wages are falling in real, or after-inflation terms. The 0.7 percent year-over-year decline in real wages in September 2026 compares unfavourably with 12-month growth of 3 percent in 2024 and 0.9 percent in 2025. This squeeze on purchasing power is putting pressure on households and making essentials less affordable. So how did we get here and what is to be done?
The shift in population growth is behind some of the labour market weakness.
The surge and then sharp pullback in immigration has contributed to the lackluster growth in the population aged 15 and over. Growth has slowed from 3.6 percent between September 2023 and September 2024, 1.7 percent between September 2024 and September 2025, to 0.5 percent between September 2025 and September 2026. Drummond and Mahboubi (2026) described how slower population growth would weaken changes in employment and the labour force. Indeed, the 0.5-percent increase in employment over the past 12 months was sufficient to keep the employment-to-population ratio unchanged.
Not all of the weakness is due to immigration-induced population shifts. Even with modest growth in the labour force population, the labour force has fallen, drawing down the participation rate from 65.2 percent in September 2025 to 64.8 percent in September 2026. This is the lowest participation rate outside the 2020 pandemic year since 1997.
Part of the reason for recent declines in the participation rate is the aging of the population with more people moving into older cohorts where there is less labour market participation. But the participation rate also fell for the working age cohorts aged 15-19, 25-54 and 55 plus. Declines in the participation rate for these cohorts likely reflect abandonment of job searches over discouragement over prospects.
The job vacancy rate (reported in a different Statistics Canada survey) fell slightly over the past 12 months because the drop in the unemployment rate to a level significantly below the historical average was driven by weakness in the labour force rather than strong employment gains which might have suggested rising demand for workers. Of late there have been almost three unemployed workers for every job vacancy, compared to only 1.3 at the beginning of 2023.
The unemployment rate can be a misleading indicator of the overall health of the labour market because, as has happened over the past 12 months, it can decline due to people getting discouraged over job prospects and dropping out of the labour market. Employment is a better indicator, but it is better still to examine the breadth of information provided through the Labour Force Survey. That broader perspective illustrates a labour market struggling from weakening supply-side factors due to sharply lower immigration and softening labour demand.
When the October 2026 LFS is released on Friday, the wide array of data it provides should be examined to assess the health of Canada’s labour market. That assessment should go beyond any change in the unemployment rate and look at changes in both employment and the labour force. Average hours worked should be examined so that in combination with employment the total amount of work in the economy can be calculated. Important insights into household finances and future cost pressures can be gleaned from the LFS wage data. It may again be the case that the broader array of data gives a very different sense of the labour market than the unemployment rate.
Don Drummond is the Stauffer-Dunning Fellow and an adjunct professor at the School of Policy Studies at Queen’s University, and fellow-in-residence at the C.D. Howe Institute where Nicholas Dahir is a research officer.
To send a comment or leave feedback, email us at blog@cdhowe.org.
The views expressed here are those of the authors. The C.D. Howe Institute does not take corporate positions on policy matters.