





Study in Brief
- This paper studies the link in Canada between monetary policy, income inequality, and inflation. What are the effects of monetary policy on income inequality? and why and how does inflation play a role?
- Income inequality largely increased from the time the Bank of Canada began targeting inflation, through the late 1990s to the early 2000s, and flattened or decreased after the 2008 financial crisis. On the whole, income inequality today is greater than it was when the Bank of Canada became an inflation-targeting central bank.
- Against this backdrop, our analysis shows that expansionary monetary policy shocks, triggered by a lower than expected bank rate, lead to increasing income inequality, while contractionary monetary policy shocks reduce income inequality.
- We then show that these effects are asymmetric with expansionary shocks having a greater impact on income inequality than contractionary shocks.
- Expansionary monetary policy shocks result in a higher share of national income shifting to higher income households, who consume less as a percentage of their income, dampening the increase in aggregate demand, and, therefore, inflation.
- Our results lead to one particularly important conclusion for monetary policy: namely, that the Bank of Canada needs to account for the impact of income inequality when modeling how inflation will respond to a change in the overnight rate.
Introduction
Inflation targeting has been a relative success in many countries around the globe since its popularity rose in the early 1990s (see Parkin 2016).
Leading up to this period, high inflation as well as high interest rates, were widespread, including in Canada. However, with the adoption of inflation targeting, Canada, and many of its peers, saw both inflation and interest rates come down, accompanied by more stable economic activity.
In this paper, we look at an oft-overlooked area of monetary policy: its effects on income inequality, and ask what monetary policy’s impact has been on this aspect of the economy during the inflation-targeting era. Of course, income inequality as a result of monetary policy may be viewed as a secondary issue if the effects of contractionary and expansionary monetary policy shocks net out over a business cycle. However, this view assumes income inequality reacts symmetrically to expansionary and contractionary monetary policy. If these reactions are, in fact, asymmetric, then understanding the link between monetary policy, different income distributions, and inflation is imperative to understanding the impact of monetary policy over the cycle.
In a world where there is no income inequality, i.e., in which the demand-side of the economy can be represented by a single representative household, we can think of monetary policy as acting through the timing of consumption decisions. For example, lowering the overnight rate (the interest rate at which major financial institutions lend and borrow overnight funds with each other) makes borrowing cheaper so households bring consumption forward, increasing aggregate demand and inflation.
However, in the real world where there is income inequality it is not as simple, as these consumption decisions also depend on the degree to which households in different income quintiles spend different percentages of their income on consumption. Therefore, the overnight rate alone is insufficient to predict monetary policy’s impact on income inequality and inflation. In Canada, those in the highest income quintiles tend to spend less as a percentage of their income than those at the bottom (consistent with, for example, Fisher et al. 2019 for the US case). As a result, a monetary policy shock that has the effect of increasing income at the top of the distribution would dampen the response of inflation through a smaller than expected increase in aggregate demand.11 See Villarreal (2016) for more on the monetary policy – inequality link. Also, Brzoza-Brzezina et al. (2013) and Guvenen (2011) provide a review of papers introducing heterogeneous (diverse) households into monetary policy models. They find that heterogeneity is affected by the conduct of monetary policy, and optimal monetary policy changes when models move from the standard representative agent framework to one with heterogeneous agents. This line of research is also consistent with recent work around secular stagnation (see, for example, Summers 2015). Lastly, see Hohberger et al. (2019) for an analysis of conventional and unconventional monetary policy on distributional effects in the euro area using an estimated open-economy Dynamic Stochastic General Equilibrium model.
We begin our analysis by showing that income inequality in Canada has changed over the inflation targeting period from 1992 to 2015. Income inequality largely increased from the time the Bank of Canada began targeting inflation through the late 1990s to the early 2000s. Depending on how one measures income inequality, it appears to flatten or increase futher until the lead-up to the 2008 global financial crisis, and flattens or decreases during the post-financial crisis period. On the whole, income inequality today is greater than it was when the Bank of Canada became an inflation-targeting central bank.
Our results indicate that expansionary monetary policy shocks have led to increases in income inequality, while contractionary monetary policy has had the opposite effect. Importantly, we find that expansionary monetary policy has a larger impact on income inequality in absolute terms than does contractionary monetary policy; i.e., we find asymmetry.
With this result in hand, we look to explain how monetary policy affects income inequality, in other words – what is the transmission mechanism?
To account for household income inequality, we study the relationship between the two main streams of household disposable income: (i) employee wages; and (ii) so-called “capital rents,” which include returns on capital assets like securities, properties or other investments. As more resources are distributed as capital rents, income inequality increases. As more resources are distributed as wages, income inequality decreases.
Our results, consistent with Cantore et al. (2018), confirm that expansionary monetary policy shocks increase household income inequality by shifting resources away from wages and towards capital rents. Our results lead to one particularly important conclusion for monetary policy: namely that the Bank of Canada needs to account for the impact of income inequality when modeling how inflation will respond to a change in the overnight rate.
The central bank is not responsible for inequality directly, that being the job of elected officials. However, our results make clear that not accounting for the differing responses of income groups might lead to false interpretations by central bankers of the likely impact of a monetary policy shock on inflation.
Inflation and Income Distribution: Evidence of a Link
Here we present some evidence linking inflation and the income distribution in Canada. First, we show that the income distribution in Canada has changed over the inflation-targeting period and is more unequal today. Second, we show that different income quintiles/deciles are associated with different consumption baskets, and these different consumption baskets have different price sensitivities. In addition, we complement this price sensitivity story with results showing higher marginal propensities to consume at the bottom of the income distribution. These facts imply that changes to the income distribution are likely to impact inflation through differences in both the price sensitivities of the different consumption baskets, and the diverse marginal propensities to consume across different income quintiles.
Changes to the Income Distribution
There are several publicly available measures of income inequality. Canada’s statistical agency, Statistics Canada, produces different annual measures of household income inequality going back to 1976, including two we present here: adjusted total income and adjusted after-tax income.22 Total income is income from all sources before income taxes and deductions. After-tax income is total income less income taxes. According to Statistics Canada, “in order to take into account the economies of scale present in larger households, the different types of income are adjusted by dividing the household income by the square root of the household size” (Footnote 5 of Table 11-10-0134-01). A third measure, which we do not show here, adjusted market income, is total income before tax less income from government sources. It largely tells a similar story to the other two measures. As Figure 1 shows, income inequality, as measured by the Gini coefficient – a common index for income inequality – was on a steady rise throughout the 1990s and into the early 2000s, and has largely stabilized, or even dropped from its peak since. That said, these measures are above where they were when the Bank of Canada became an inflation-targeting central bank in 1991.33 Also true if we narrow the range to the post-1995 period. We raise the 1995 reference point since it was really from this year on when the Bank of Canada had a constant target of 2 percent inflation.
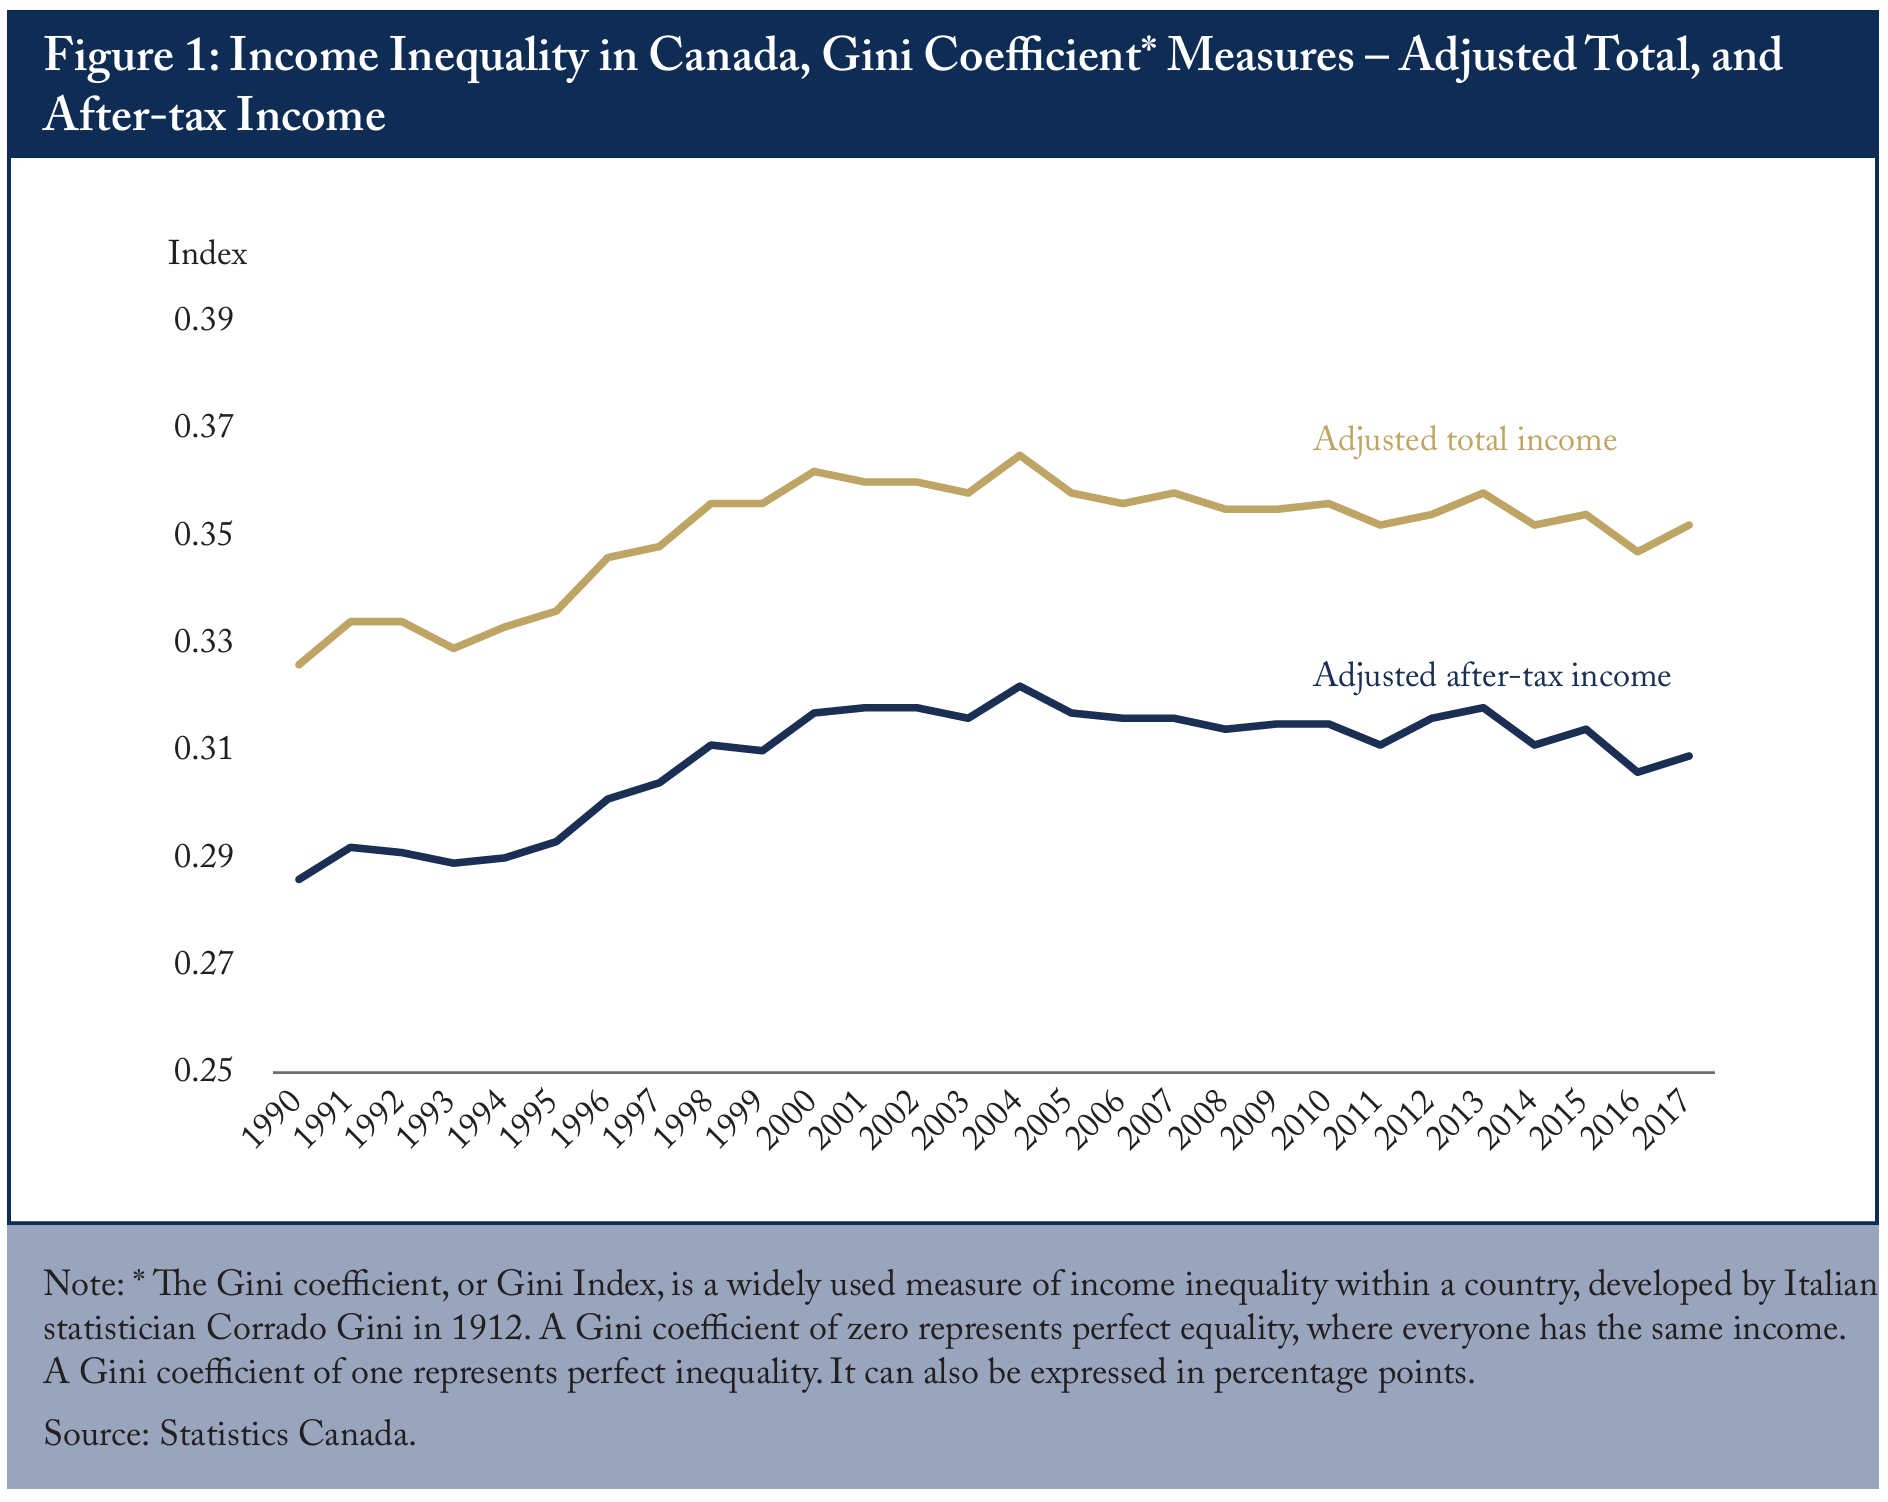
The evolution of these measures reflects changes in income inequality across households, as well as changes in key observable household characteristics, such as sex, education and age. However, we are more interested in the portion of income inequality that cannot be explained by these observable characteristics, since they are associated with a certain degree of income inequality regardless of monetary policy shocks (i.e., they are endogenous).
We generate an income inequality measure at the level of employed individuals by gathering high frequency monthly (wage) income data from Statistics Canada’s Labour Force Survey (LFS) data,44 We acknowledge that using pre-tax LFS data ignores the redistribution effects from tax and transfers. However, as we showed, Statistics Canada’s Gini coefficients change very little when we compare before versus after-tax. We also note that using micro-level LFS wage data means the unemployed are removed from the sample in a given year. This could be a concern in that by starting at a lower level of inequality (since the unemployed are removed from the sample), you underestimate the degree to which expansionary monetary policy brings people back into the labour market, and vice versa in the case of contractionary monetary policy. However, our transmission mechanism model, introduced later, uses aggregate wage data, which does not have this characteristic, and finds similar results. and extract the portion of monthly income that is unexplained by the above characteristics, and calculate the Gini coefficient for this residual across employed Canadians.55 To generate these income-based Gini residuals we follow Villarreal (2016) and run a regression with monthly income as the dependent variable, and independent variables including the square polynomial on age (a proxy for experience), a variable on whether someone has finished a post-secondary degree (a proxy for ability), and other binary variables for marital status, sex, urban area, and industry. We extract the estimated income and subtract this estimated variable from actual income, giving us a set of residuals we use to estimate the Gini coefficients.
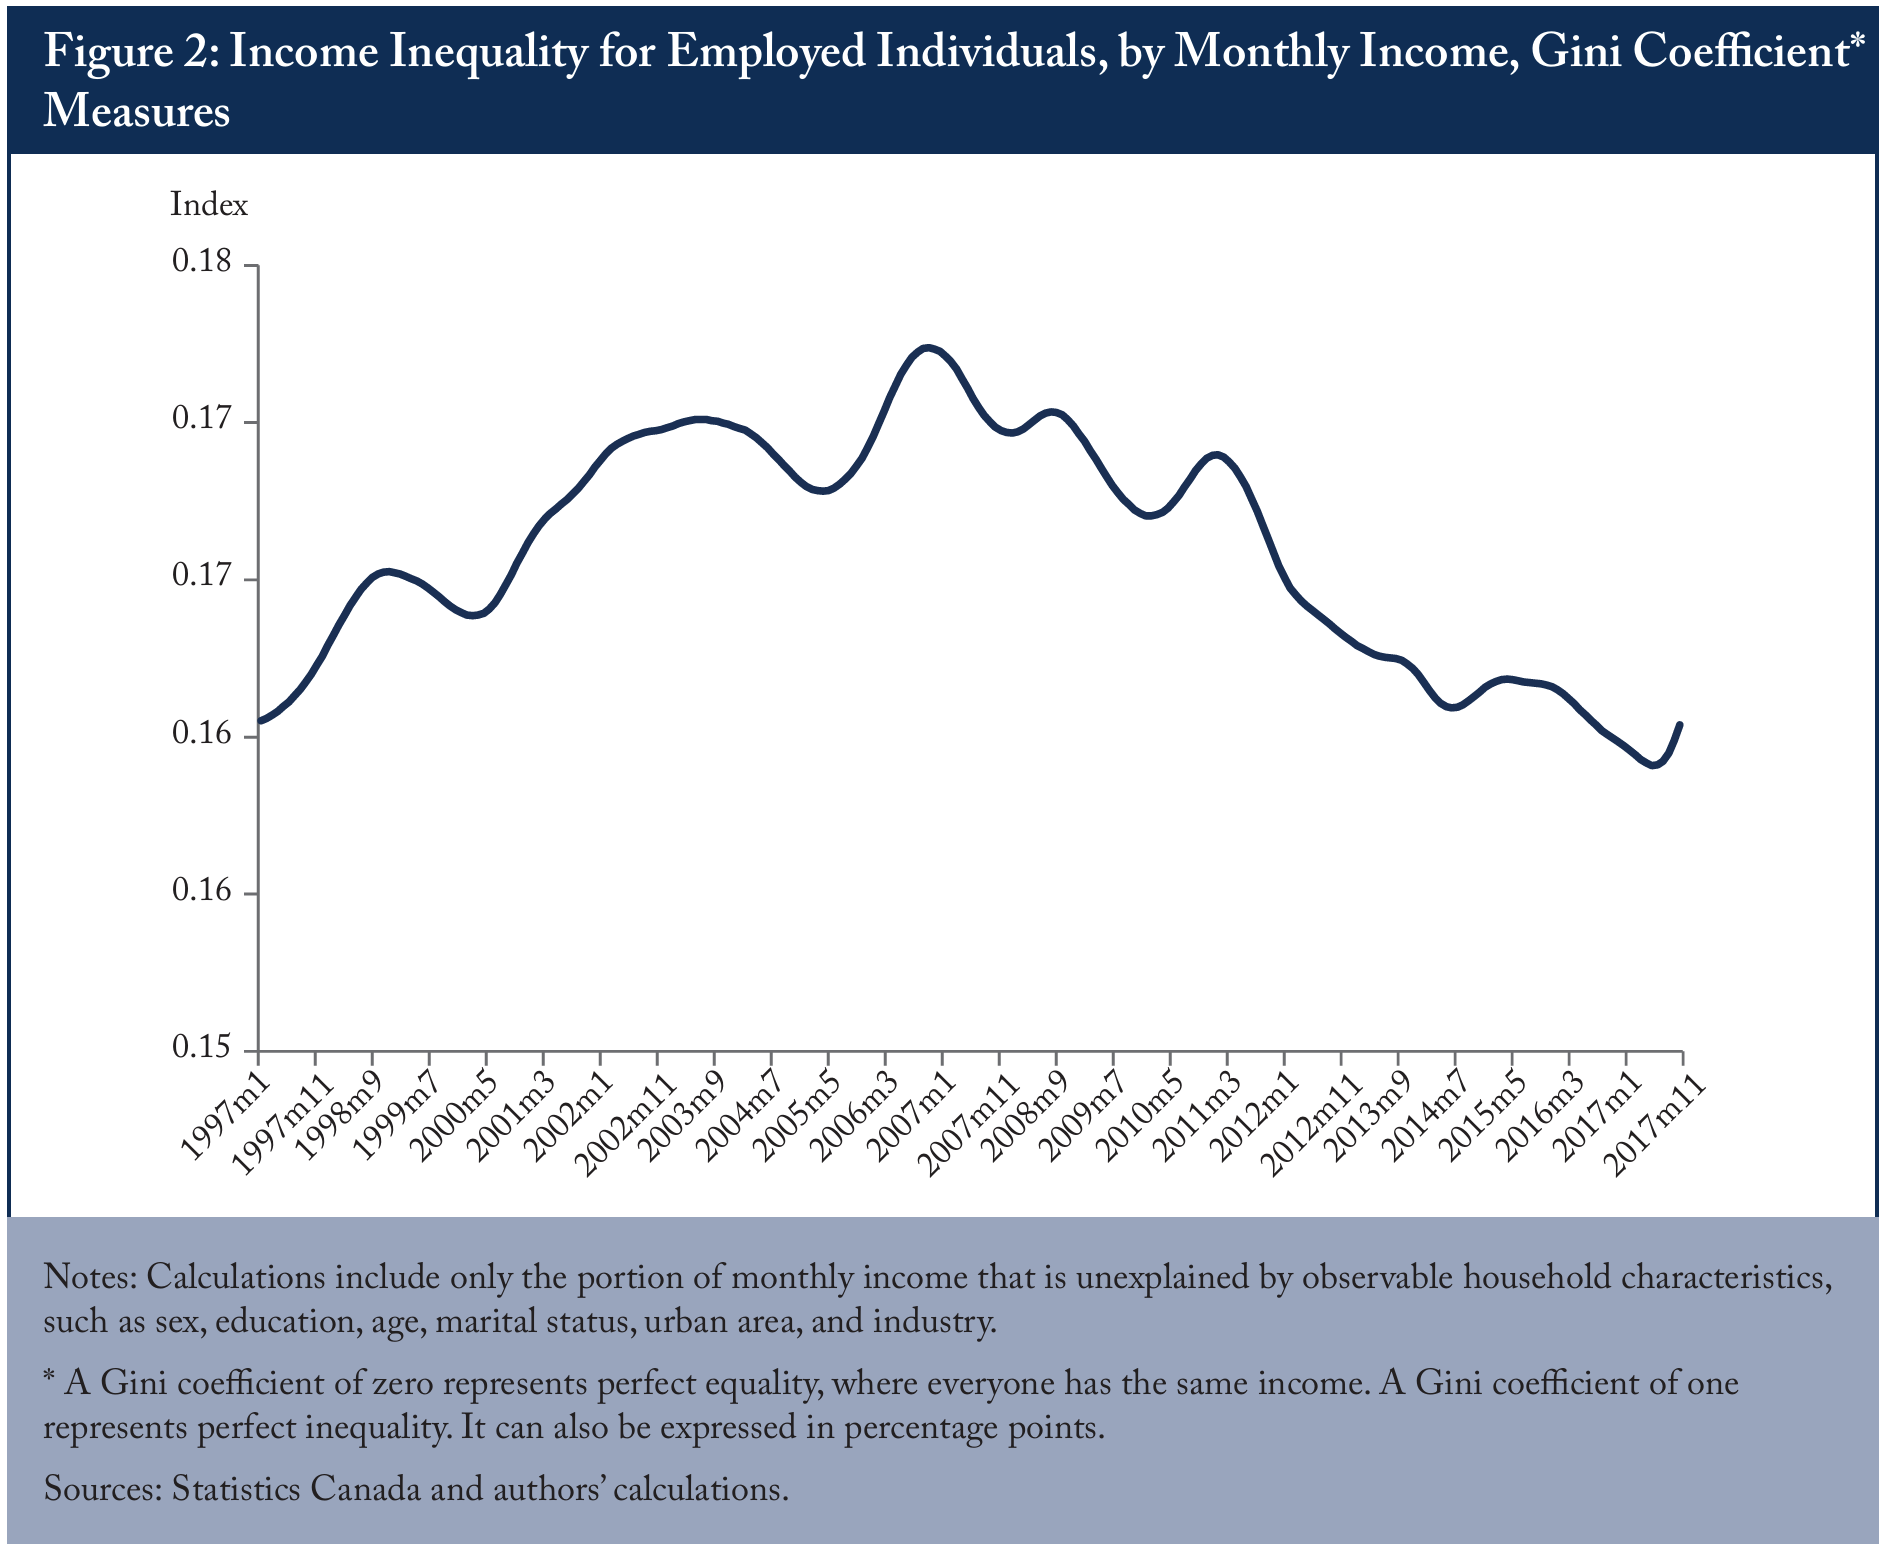
The results indicate increasing income inequality in the years leading up to the crisis (Figure 2).66 The Gini coefficient is smoothed using the LOWESS method with a bandwidth of 0.15. This means 15 percent of the data are used to smooth each point. Smaller bandwidths adhere to the data more closely. However, income inequality improves towards the end of the crisis, and thereafter. These results are qualitatively similar to what we saw with the Statistics Canada measures, although the unavailability of LFS monthly data pre-1997 prevents us from comparing where income inequality sits relative to its level when the Bank of Canada became an inflation-targeting central bank.
Consumption Baskets and Marginal Propensities to Consume across the Income Distribution
Why does understanding movements in the income distribution across time matter for monetary policy transmission? One explanation comes from Cravino et al. (2018): “If the effects of monetary shocks on prices are heterogeneous across types of goods (Boivin et al. 2009), and consumption baskets differ across the income distribution (e.g., Almas 2012), then shocks will differentially affect the prices faced by households of different incomes.”
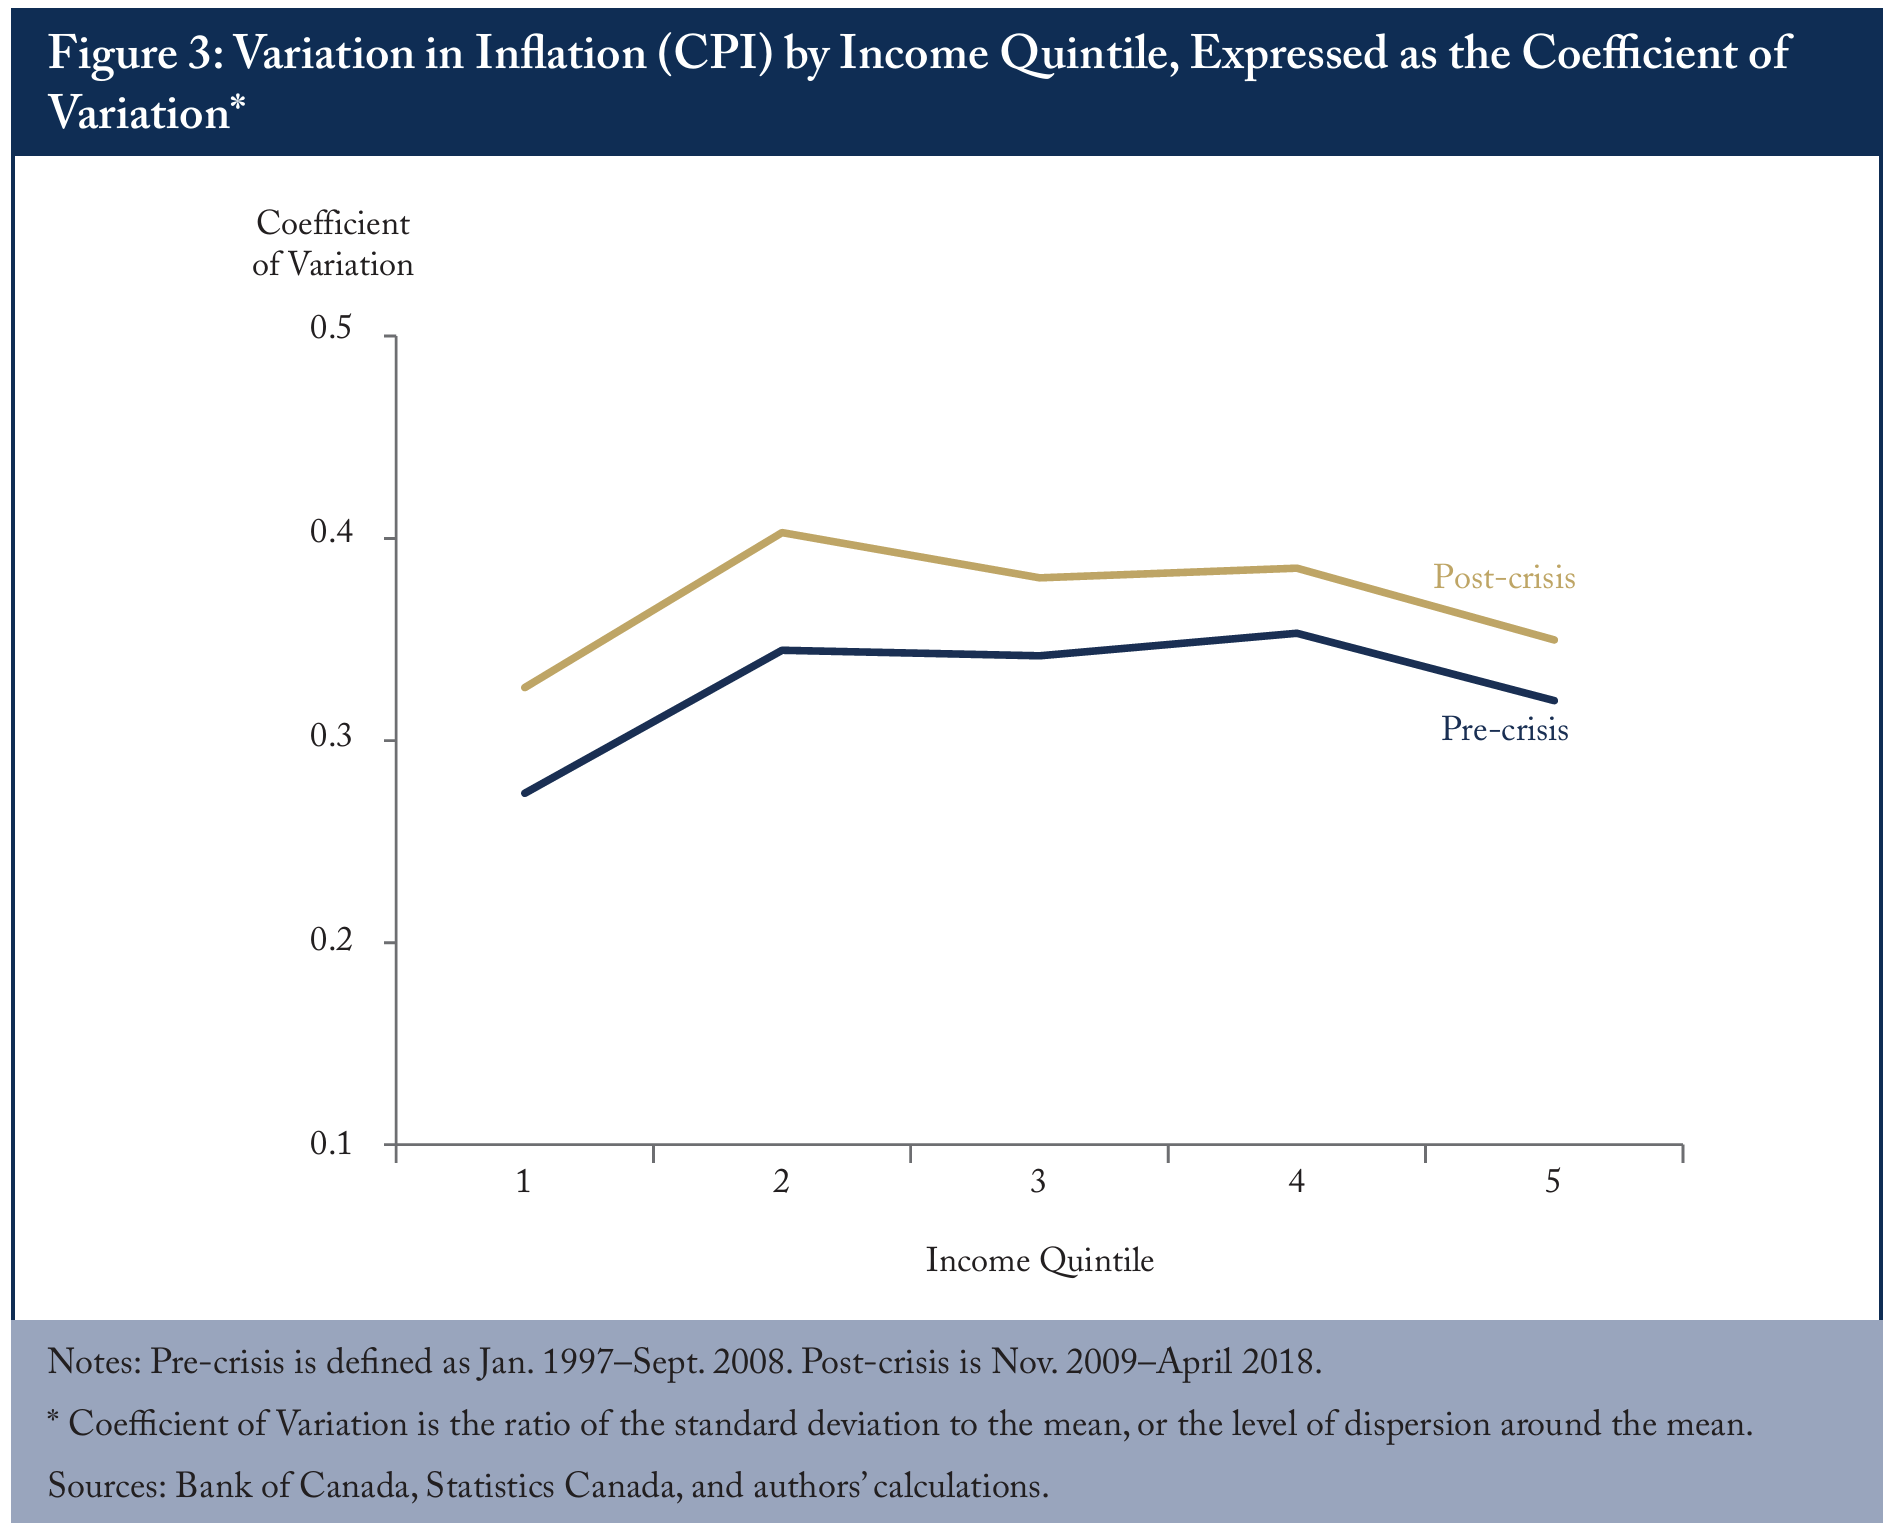
Key then, is to show for Canada that: a) different income quintiles have different consumption baskets, and b) price movements for those different baskets differ across the income distribution. To show this, we follow the methodology in Cravino et al. (2018) using Canadian data. This methodology involves calculating the percentage of money spent on a particular product group by income quintile (i.e., creating a consumption basket for different income quintiles), estimating how prices of different product groups move across time, and finally, calculating the movement of prices associated with these different consumption baskets across different income quintiles over time (see Kronick and Villarreal 2019 for more detail).77 We use Canadian data from the Survey of Household Spending (SHS) which details money spent, by income quintile, on different goods and services. While the categories for the SHS and CPI data do not match exactly, the differences are minor and in almost all instances easy to match.
Like Cravino et al. (2018) in their US analysis, we find a hump-shaped result for the variations in inflation across the consumption baskets associated with different income quintiles, with high-income households in Canada experiencing lower volatility compared with middle-income households (Figure 3).88 However, the lowest volatility occurs at the lowest income quintiles, unlike the study by Cravino et al. where highincome households experience the lowest volatility. This also reflects itself in average inflation over the post-crisis period, which was lowest for low-income households. One explanation for this difference with the US work of Cravino et al. comes from Friedrich and Gosselin (2015) who discuss evidence of increased competition in Canada’s retail sector, as a result of new and bigger retailers. The Bank itself estimated that more intense competition in these sectors subtracted around 0.3 percentage points from inflation in 2012 and 2013.
We conclude that in Canada different consumption baskets characterize different income quintiles, and the overall price sensitivities of these baskets differ based on the make-up of the associated goods and services.
Moreover, over the period 2010 to 2018, according to Statistics Canada’ data on distributions of household income and consumption, the marginal propensity to consume (change in consumption divided by change in disposable income) for the lowest income quintile was 3.2, meaning this group significantly dipped into savings or borrowed to finance additional consumption. For those at the highest income quintile, the marginal propensity to consume over this period was 0.9. The implication is the marginal propensity to consume is much higher for those at the bottom of the income distribution.
Overall, the evidence shows:
- an income distribution that has varied over the last quarter century, with greater income inequality today than at the beginning of our sample;
- consumption baskets that differ across different income quintiles with different overall price sensitivities across the goods and services that make up these baskets; and
- different marginal propensities to consume at different income levels.
This begs the question of whether monetary policy has contributed to changes in the income distribution and if it has, whether these changes are symmetric and what this means for inflation’s response to a contractionary/ expansionary shock.
Monetary Policy, Income Inequality, and Inflation: The Results
The first order of business is to establish whether monetary policy has played a role in the changing income distribution over the inflation-targeting period. To do this, we first need a method to identify exogenous monetary policy shocks, in other words, the unexplained or surprise portion of a change in the overnight rate. We follow Champagne and Sekkel’s (2018) version of this surprise change, which involves estimating the part of an intended Bank of Canada overnight rate change that cannot be predicted from the Bank of Canada’s estimated reaction function, which takes into consideration how the Bank systematically reacts to a series of indicators.
Establishing the Impact of Monetary Policy on Income Inequality
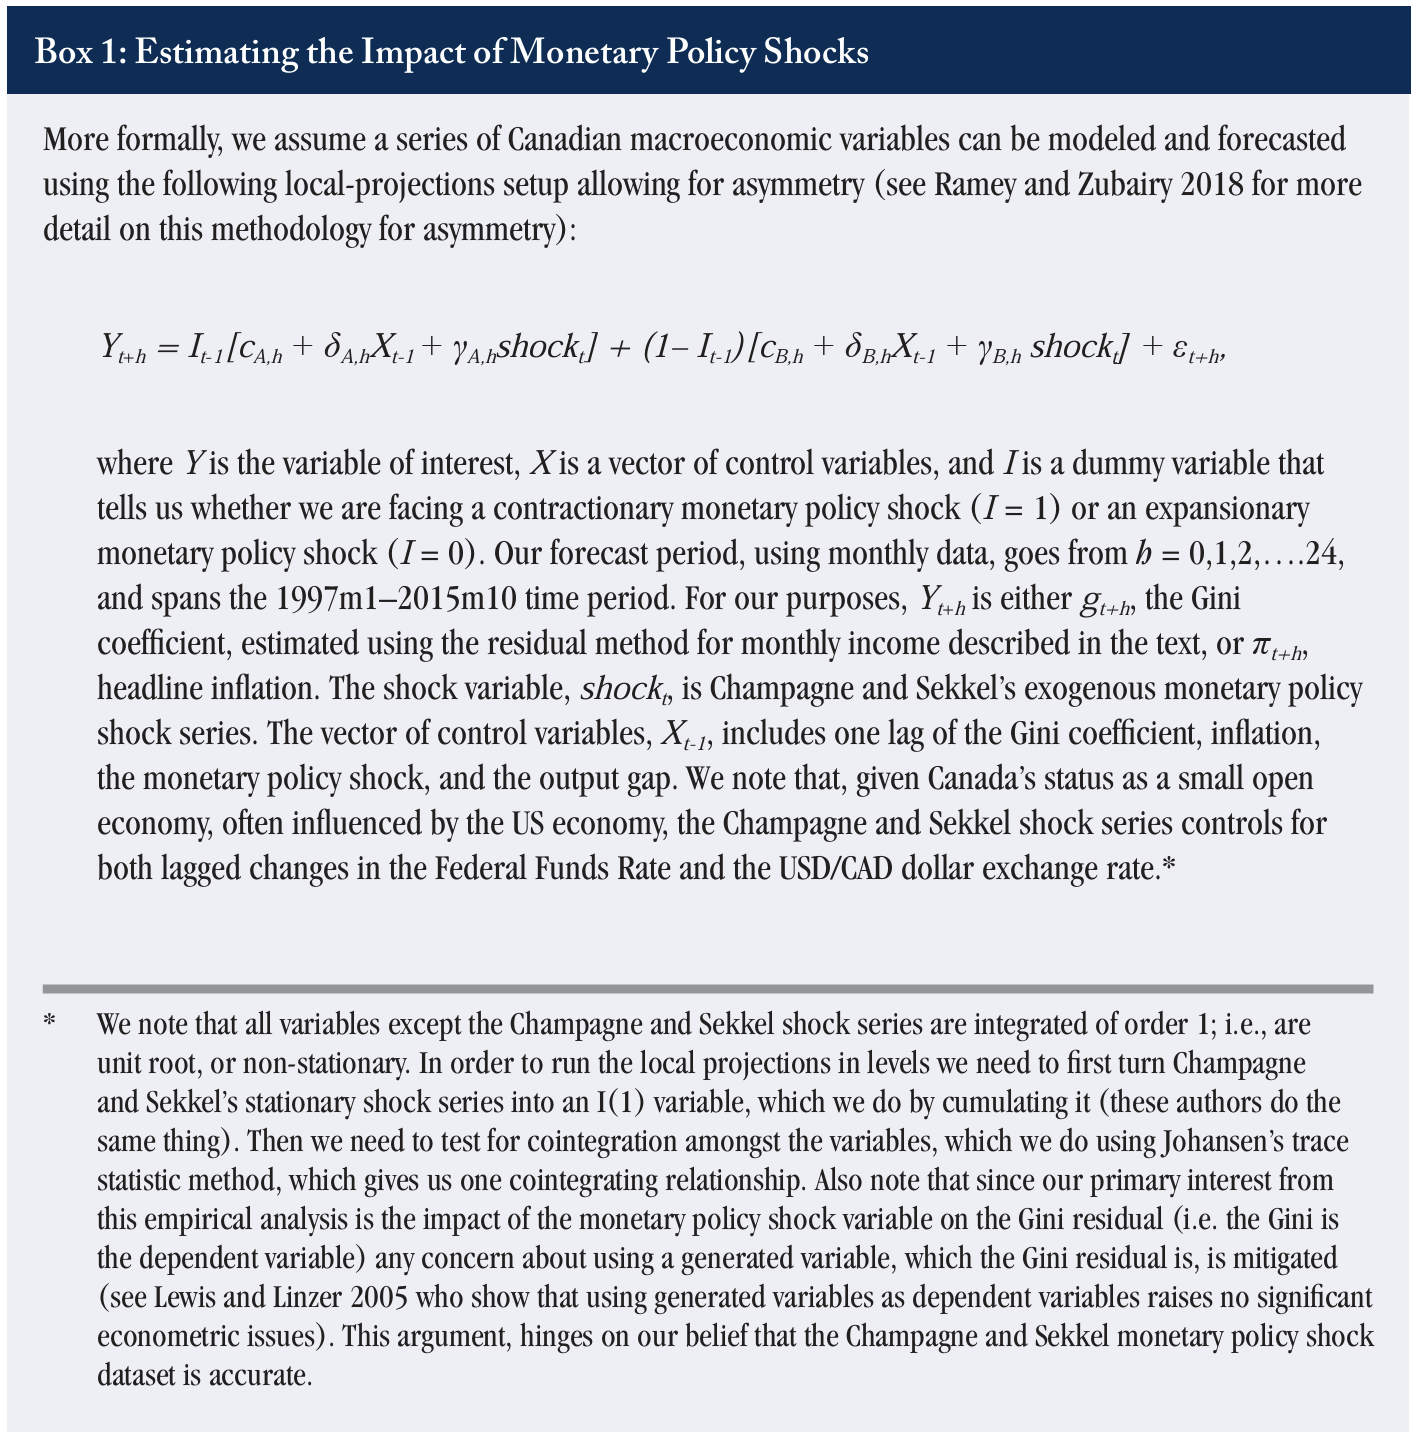
As documented by Ampudia et al. (2018), the theoretical link between how monetary policy is likely to impact inequality is ambiguous, and, therefore, requires robust empirical testing. We start with a simple local-projections setup (see Jordà 2005 for more) where we estimate the impact of both a contractionary and expansionary shock on income inequality (see Box 1 for more detail on the econometric setup). The local projections method estimates the response at each period of interest rather than extrapolating over the longer term. It is a particularly useful empirical technique when the sample period, like ours, is characterized by both expansionary and contractionary monetary policy, since it allows for asymmetry between the effects of both types of shocks.
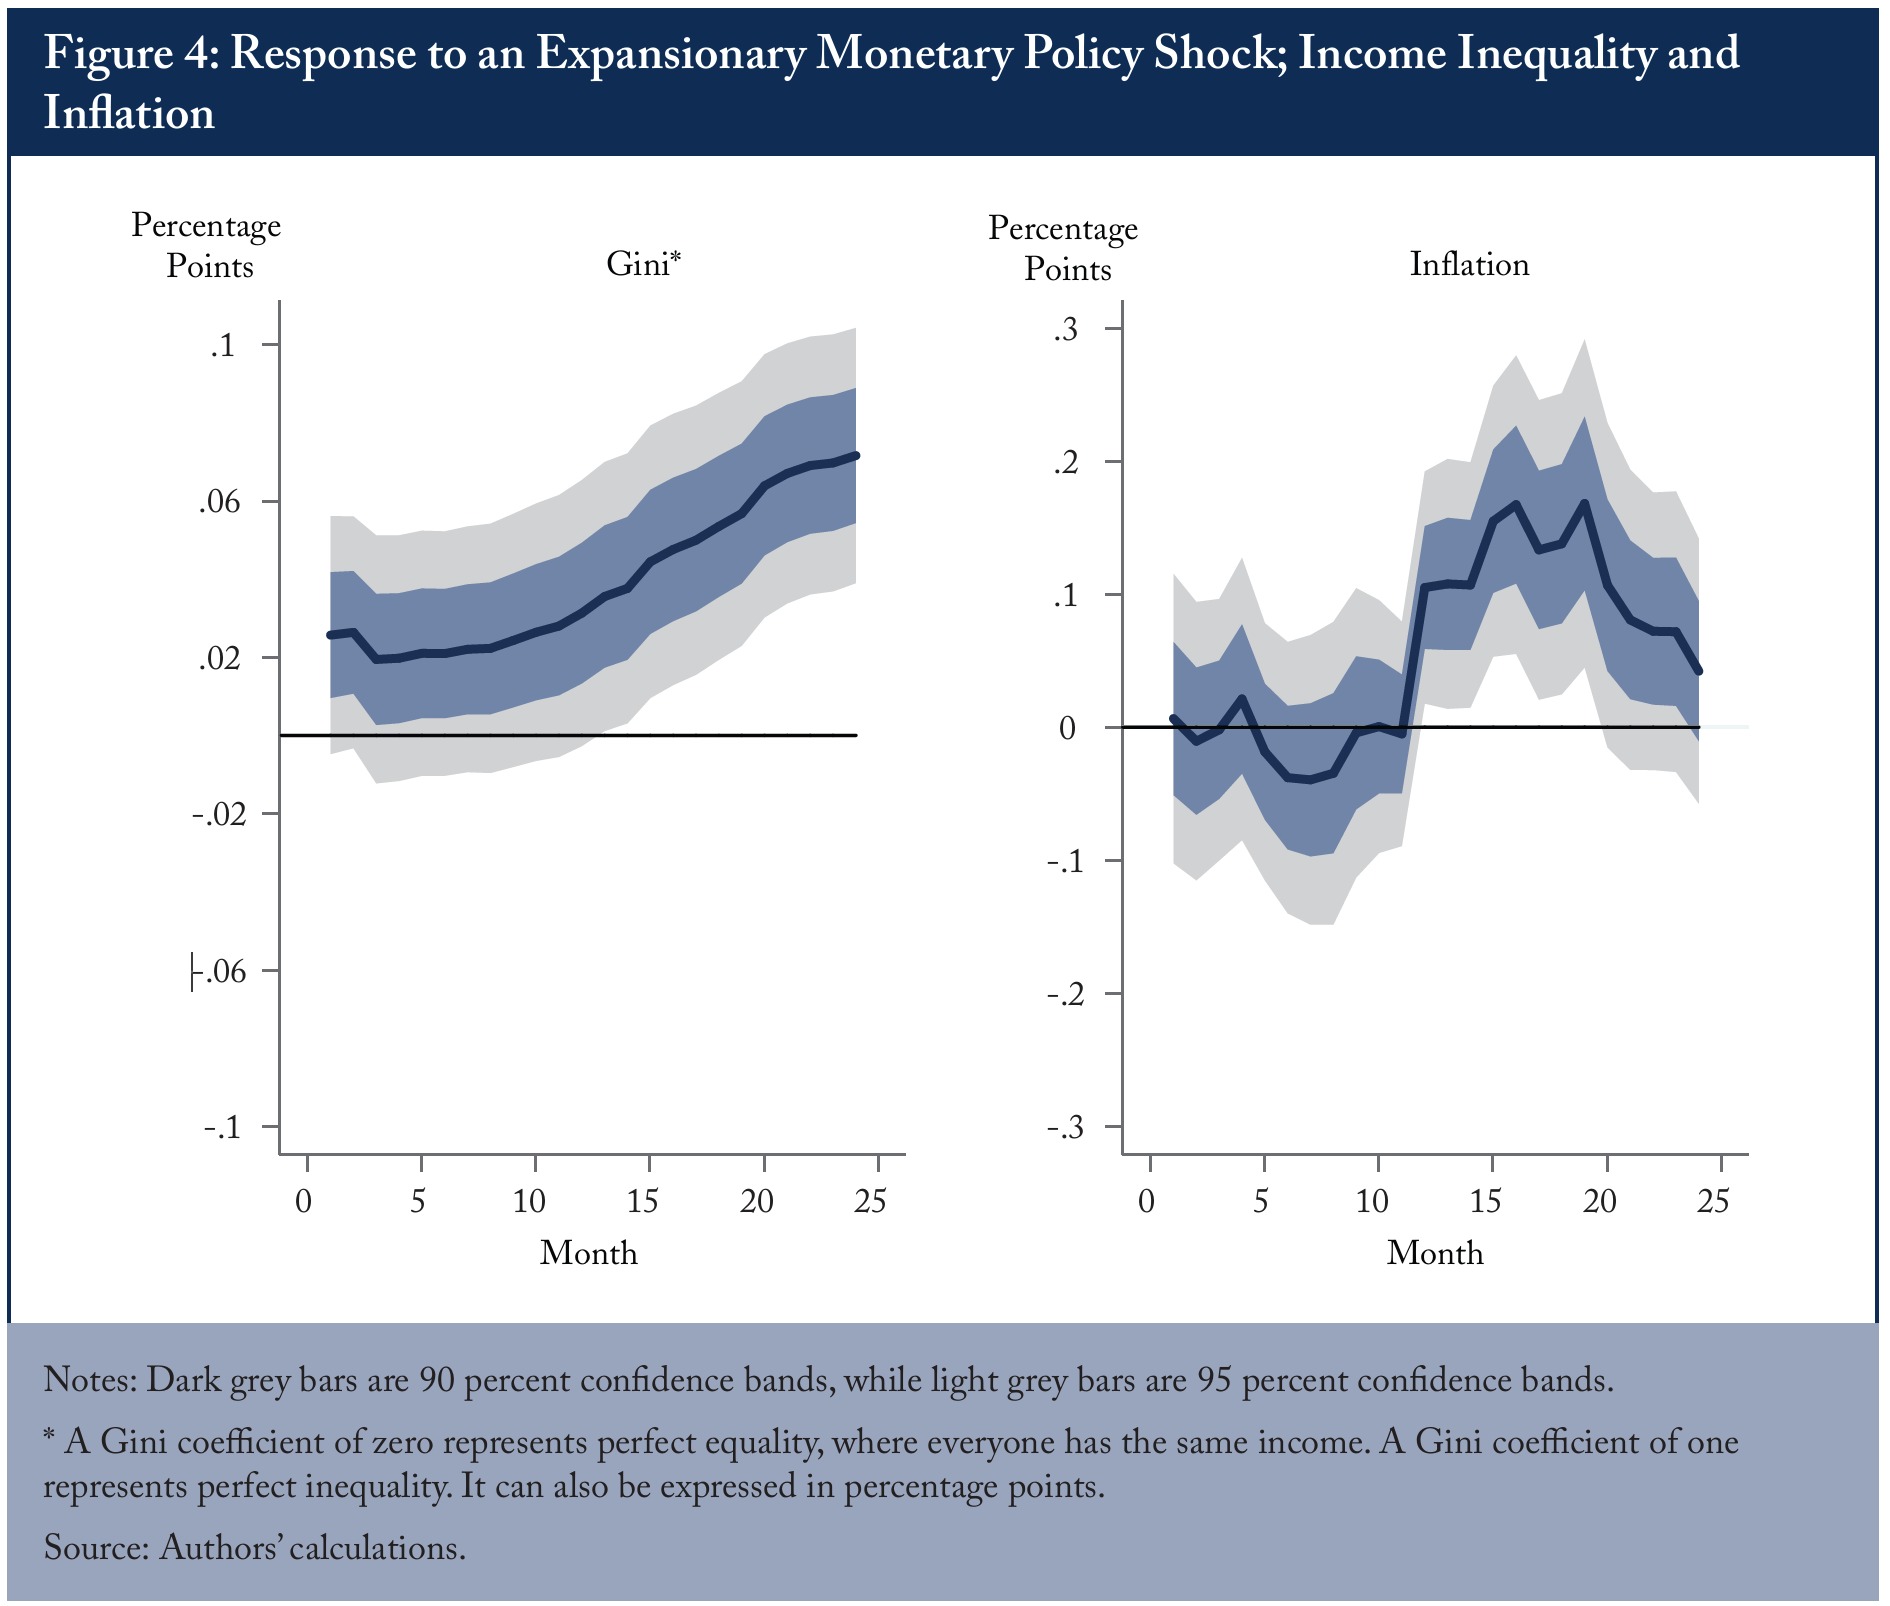
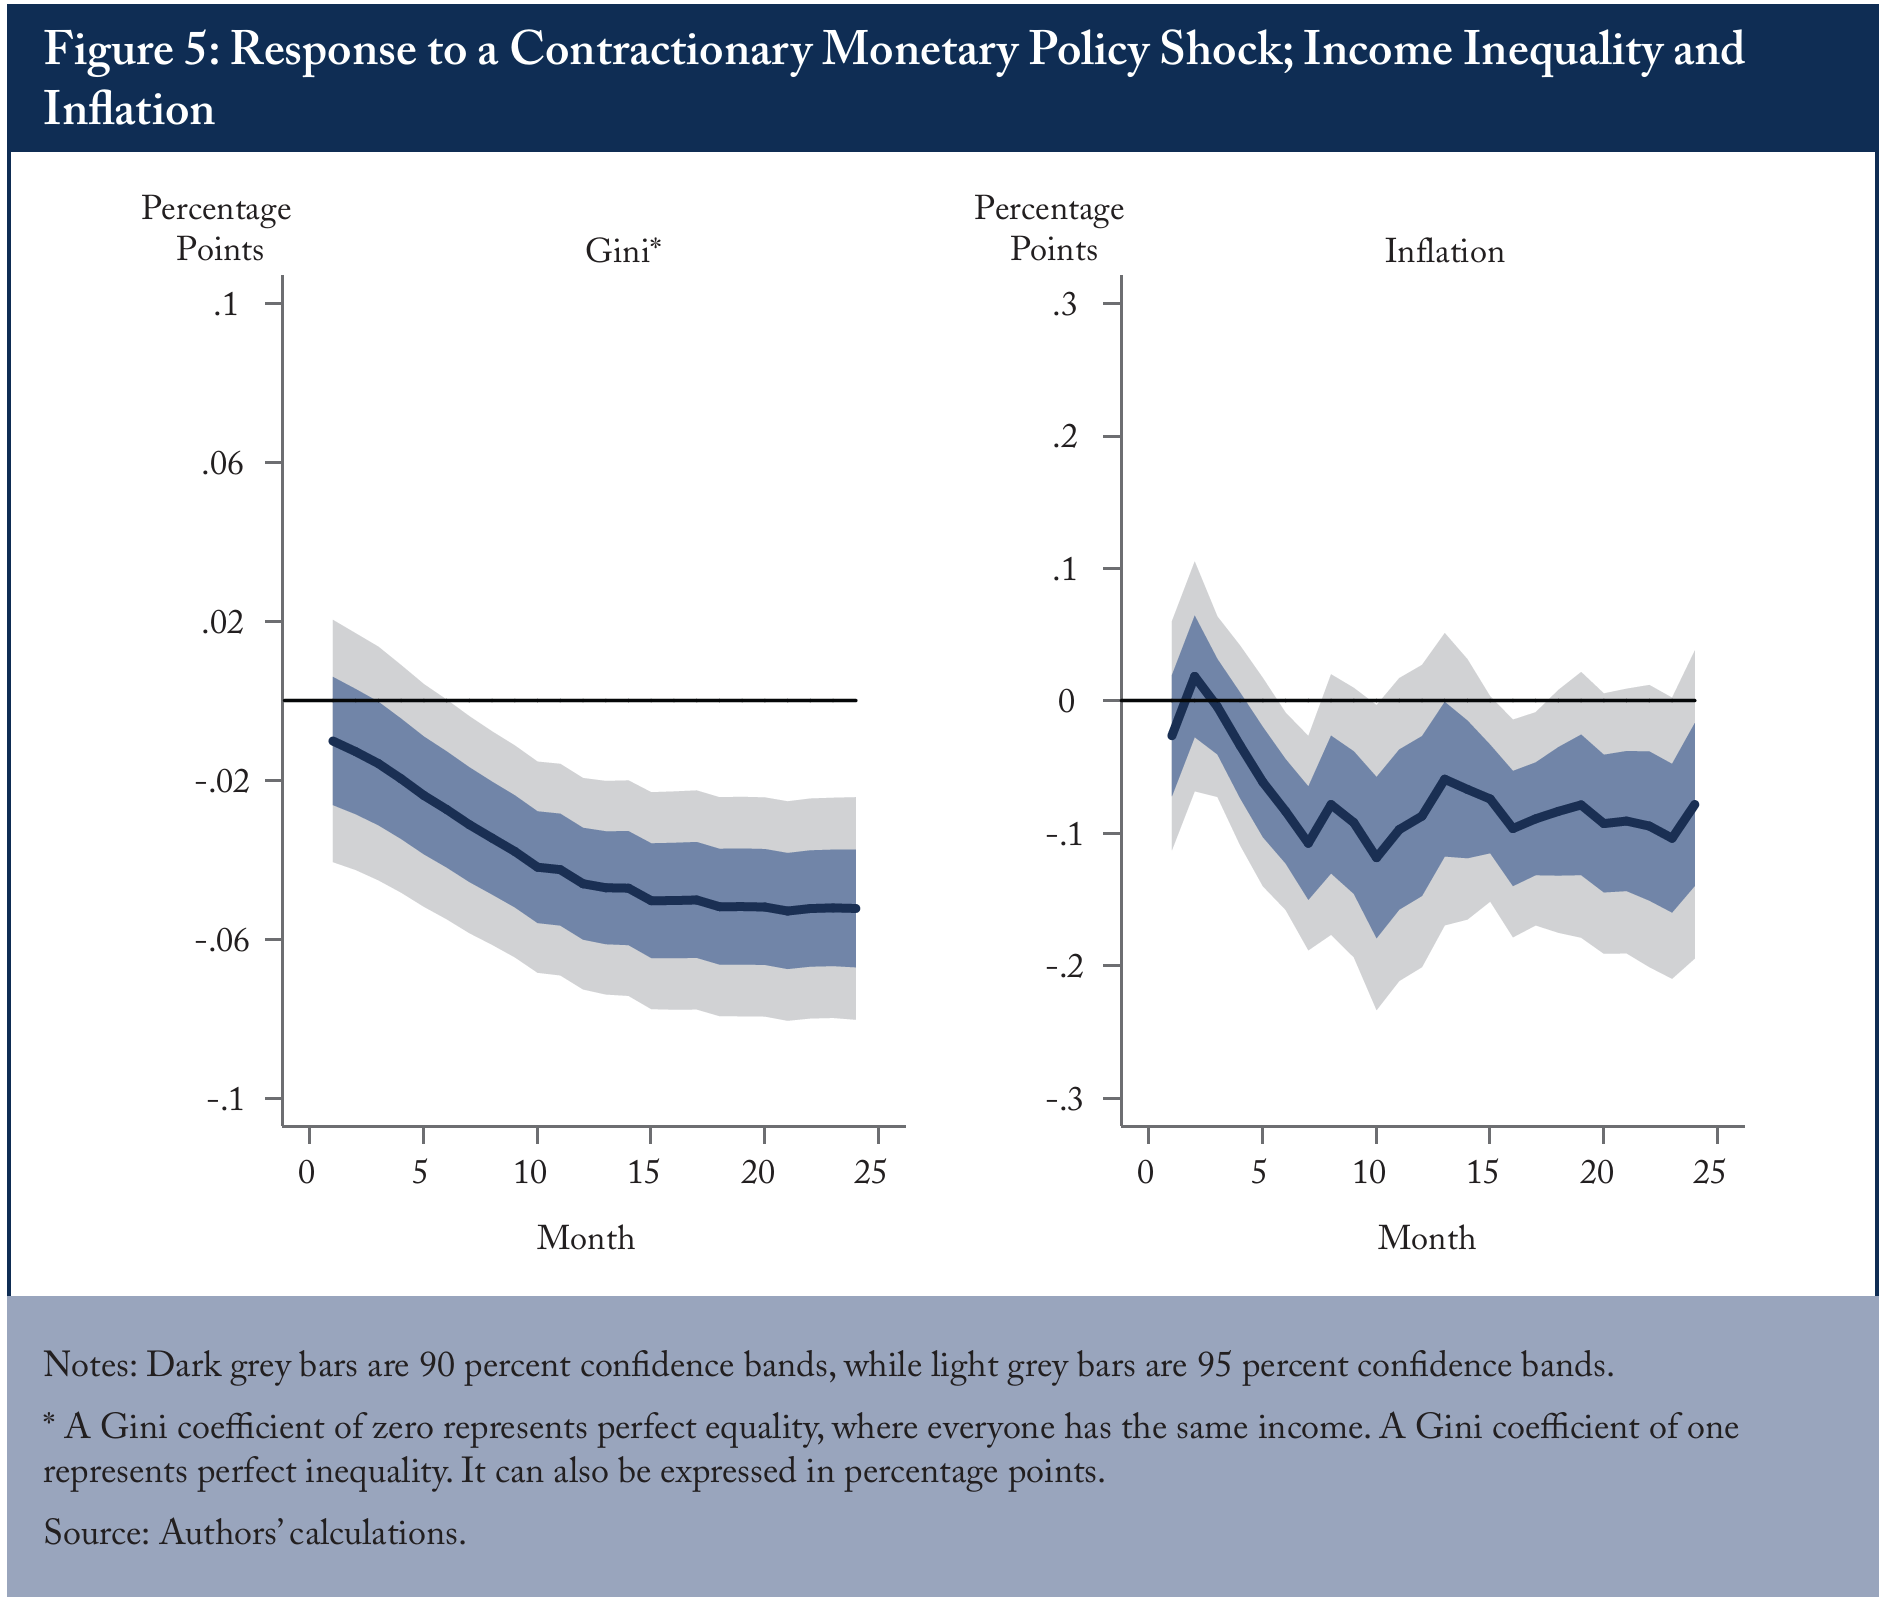
Our first set of results tells us how income inequality and inflation respond to a typical temporary 25 basis point expansionary or contractionary monetary policy shock (Figures 4 and 5, respectively).
As indicated in Figure 4, expansionary monetary policy appears to increase income inequality, while having the expected positive impact on inflation. Figure 5 tells the opposite story: a contractionary monetary policy shock appears to reduce income inequality while lowering inflation.
Interestingly, it also appears as if an expansionary monetary policy shock has a greater impact on income inequality, in absolute terms, than does a contractionary shock. This is true of the peak effect on inflation as well, though a contractionary shock seems to take effect much quicker than an expansionary shock. This asymmetry is critical as it implies that the effects of the shock will not net out over the course of the business cycle.99 We acknowledge that the point estimates for an expansionary monetary policy shock do lie within the confidence intervals of a contractionary monetary policy shock. While the point estimates do differ, and are suggestive of asymmetry, this model on its own is insufficient and requires further analysis. We perform this additional analysis in the following section.
The question of interest then becomes what is the transmission mechanism whereby monetary policy affects income inequality.1010 The findings in this section are robust to numerous specifications and timing including different starting points, different end points, including a pre-crisis end point, as well as a different time series of Gini residuals where we add additional observables to our baseline. Results available from authors upon request. To answer these questions, we turn to a more detailed local-projections setup.
Determining the Transmission Mechanism
According to the results emerging from work on heterogeneous, or diverse, agent models (Kaplan and Violante, 2018), one of the key differences between mainstream economic models featuring a representative agent, and richer specifications that allow agents to differ in noteworthy ways, is the relative magnitude of the direct and indirect macroeconomic effects following a surprise change to the central bank’s primary monetary policy tool. Salient among them: how monetary policy impacts the disposable income households use to finance their current and future consumption.
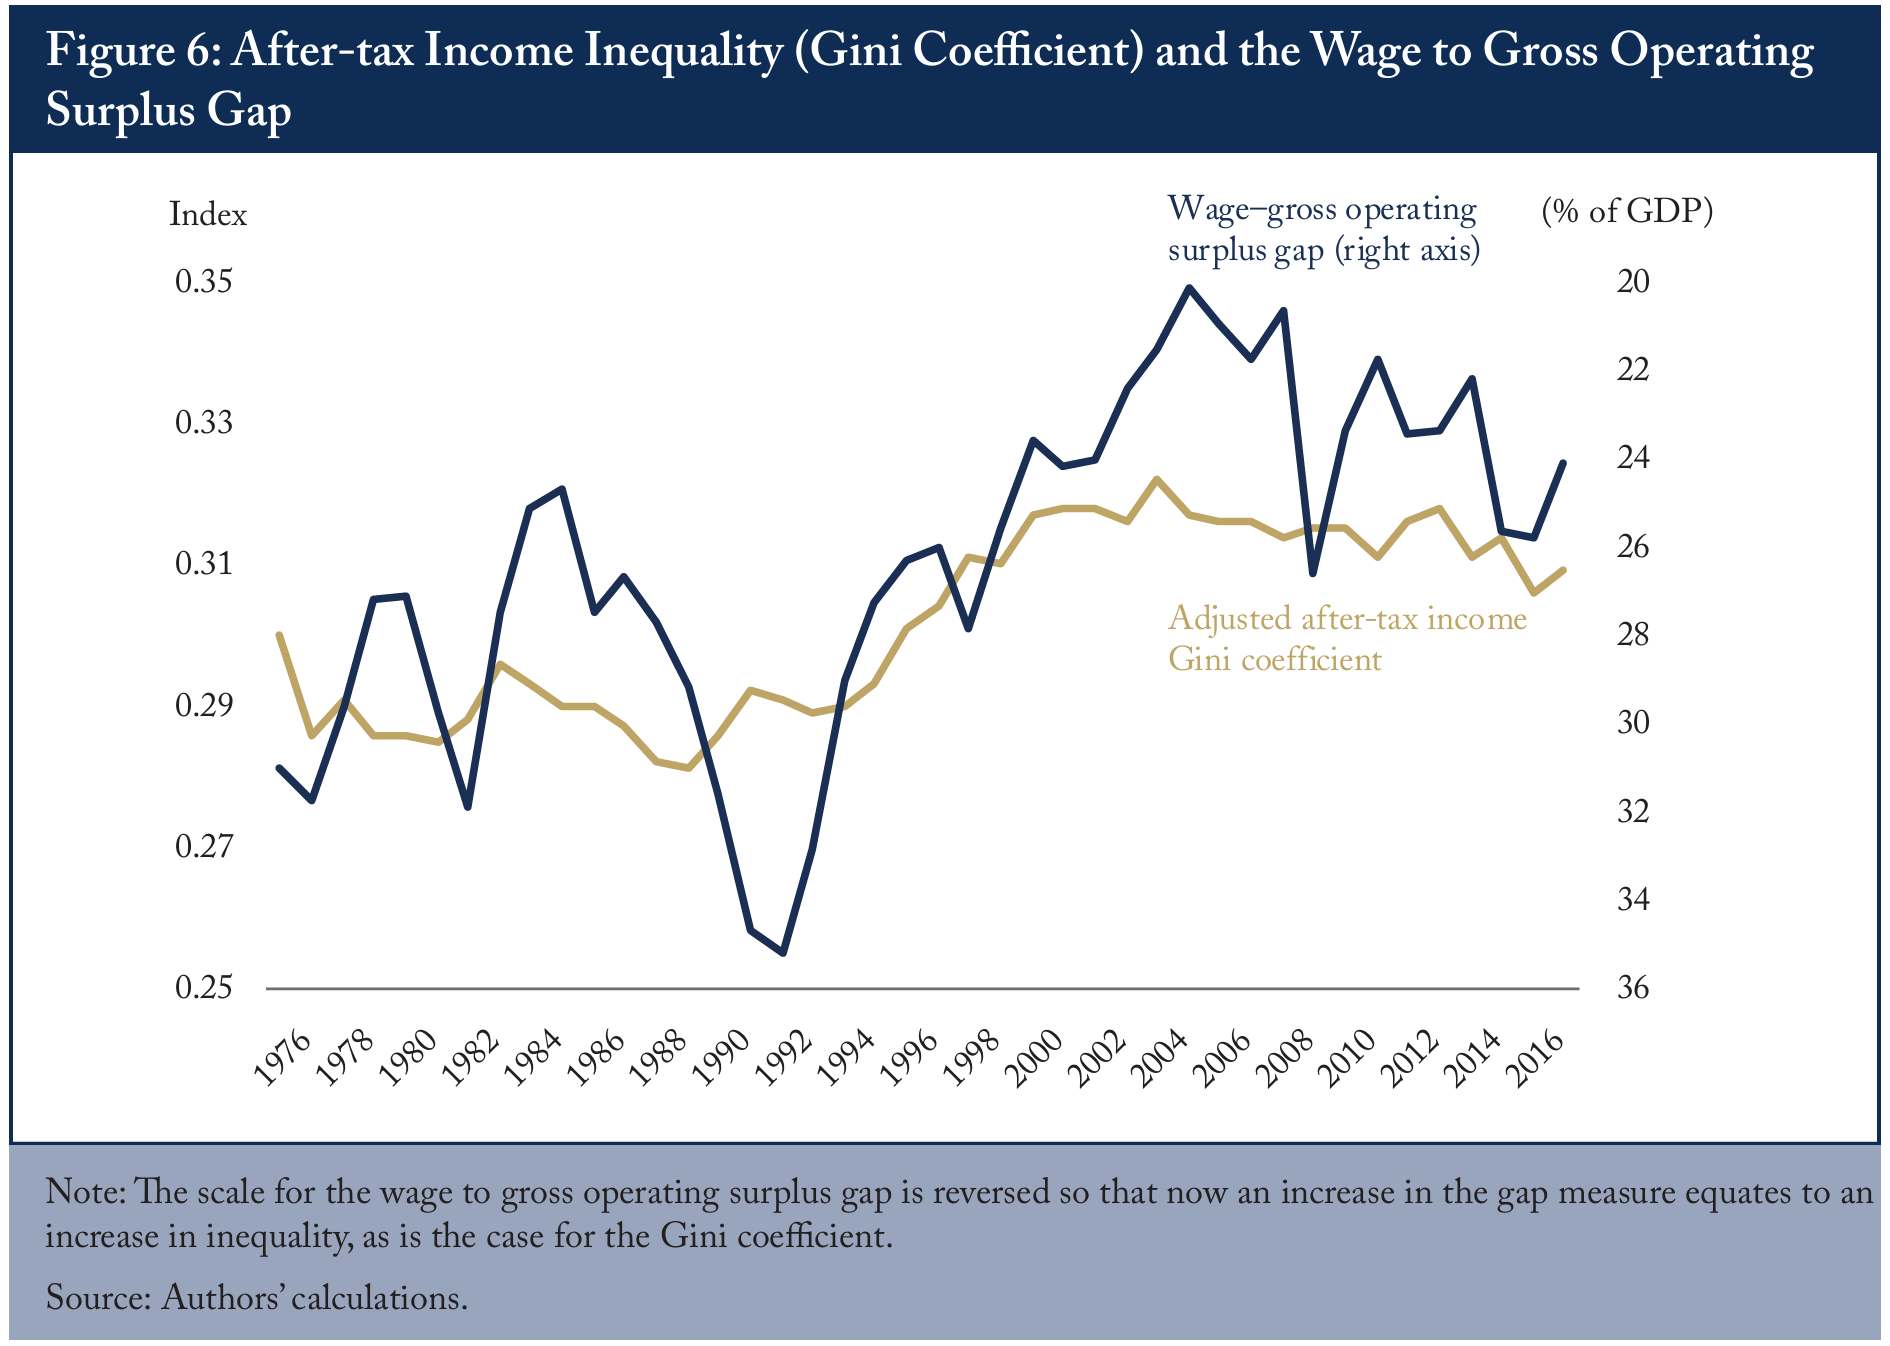
In view of this, we extend the analysis to explore the impact of monetary policy shocks on the distribution of households´ main income streams. We focus on the evolution of the gap between compensation of employees and capital owners’ gross operating surplus, which includes before-tax profits after labour costs have been paid, investment income, and more.1111 See OECD at https: //stats.oecd.org/glossary/detail.asp?ID=1178 or Statistics Canada at: https://www150.statcan.gc.ca/ n1/pub/13-017-x/2008001/themes/ch04/5213347-eng.htm. A higher value of the gap implies that more of the value added in the economy is distributed as labor compensation, whereas lower values of the gap imply a relatively higher share of value-added accruing to capital owners. Under the assumption that higher income households derive a larger proportion of their income from capital than do lower income households,1212 For example, Statistics Canada data showed that in 2017, while the top 1 percent in total income had 30.9 percent of all dividend income, the bottom 50 percent only had 4.9 percent. This dividend income, for the average filer in the top 1 percent was 13.5 percent of their total income. For the average filer in the bottom 50 percent, it was 1.1 percent. in addition to capturing the evolution of the main determinants of disposable income, the gap provides a more detailed measure of income inequality, where a lower value for the gap implies more income inequality. This alternative measure provides insight on one possible transmission of a monetary policy shock to inequality.
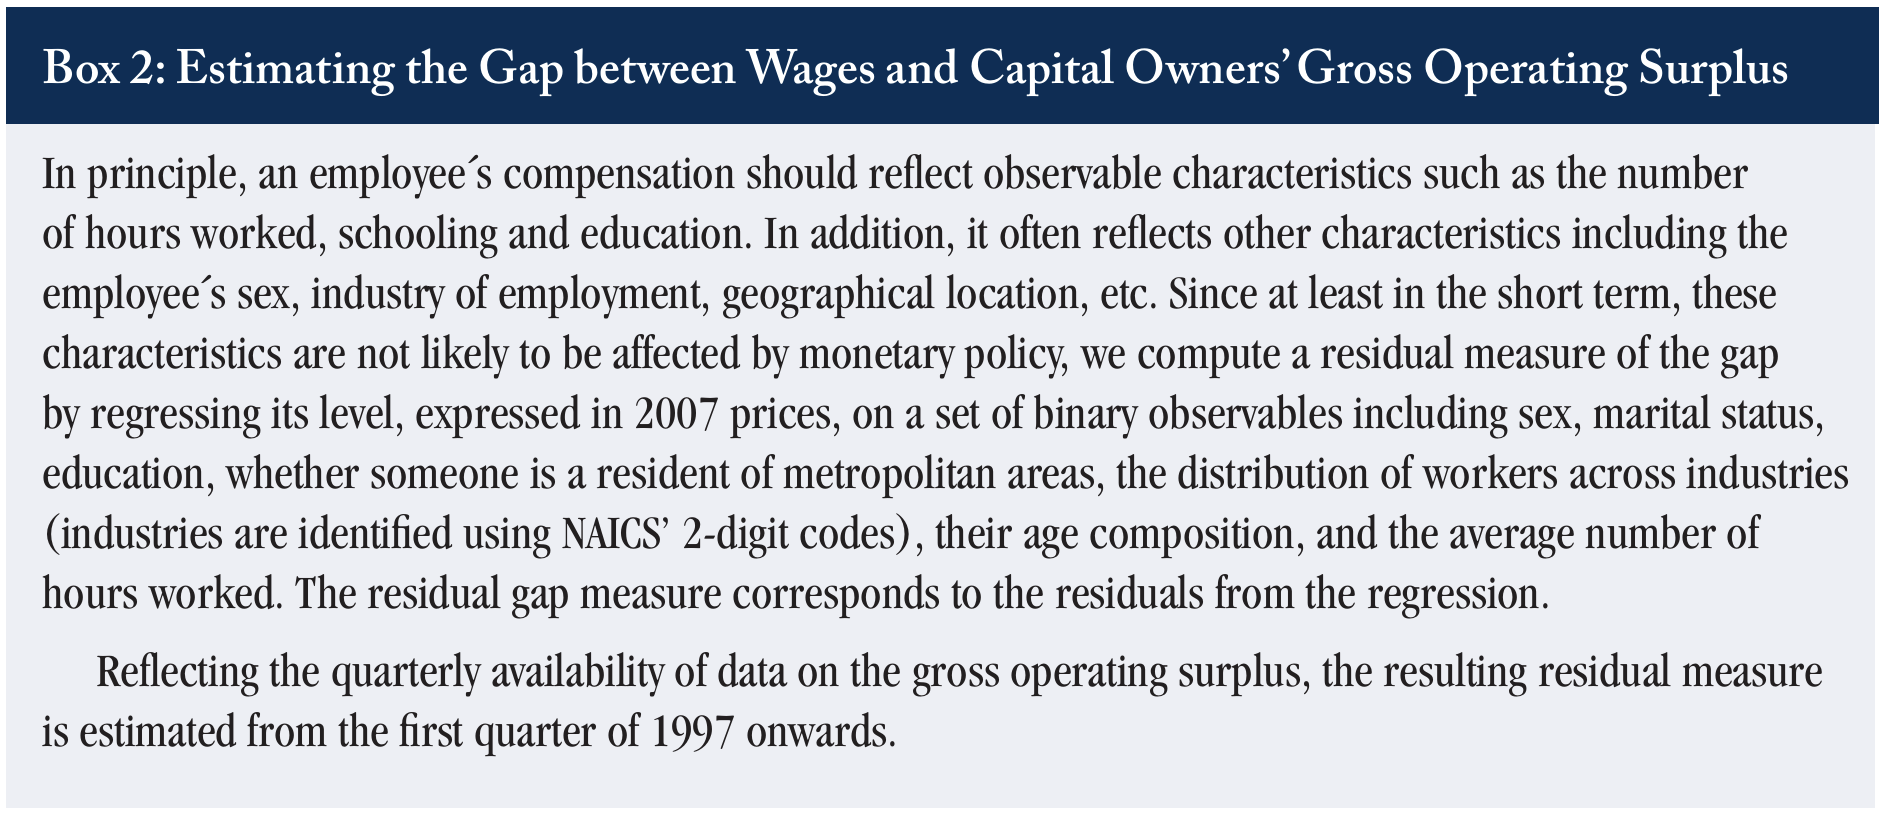
Figure 6 contrasts the evolution of the wage–gross operating surplus gap and Statistics Canada´s measure of the after-tax income Gini coefficient1313 Both measures are averaged to yield yearly estimates. over the period 1976-2017.1414 We use the after-tax Gini coefficient as it has a larger sample size than our residual-based Gini. Over the shorter period available with the residual-based measure, the similarities remain. It is clear that, despite the higher volatility of the wage–gross operating surplus gap, both measures follow similar trends.
Since the evolution of the compensation of employees, the gross operating surplus, and the difference between them responds to factors beyond monetary policy, we use a residual measure of the gap similar to what we did for the Gini coefficient (Box 2).
As before, in addition to the residual measure of inequality (wages minus gross operating surplus), the model specification includes the monetary policy shock series estimated by Champagne and Sekkel, the output gap and consumer price inflation.
Results
Figure 7 shows the cumulative responses of inflation and the residual wage to gross operating surplus gap to a contractionary and expansionary monetary policy shock,1515 The size of the shock in both cases is a 25-basis-points change in the nominal interest rate. The figures show the cumulative effect of the shocks to highlight the asymmetric nature of the responses. as well as the corresponding 95 percent confidence intervals, over a 12-quarter period.
The first feature to note is that an expansionary monetary policy shock has a significant negative effect on the wage –gross operating surplus, indicating an increase in the inequality of households´ income, and a contractionary monetary policy shock of the same magnitude has a small positive, but mostly statistically insignificant effect on households´ income inequality. These results are similar to what we saw with the Gini coefficient. They are also consistent with those of Cantore et al. (2018) who document that the labor share for several advanced countries, including Canada, increases in response to contractionary monetary policy shocks, leading to lower income inequality.
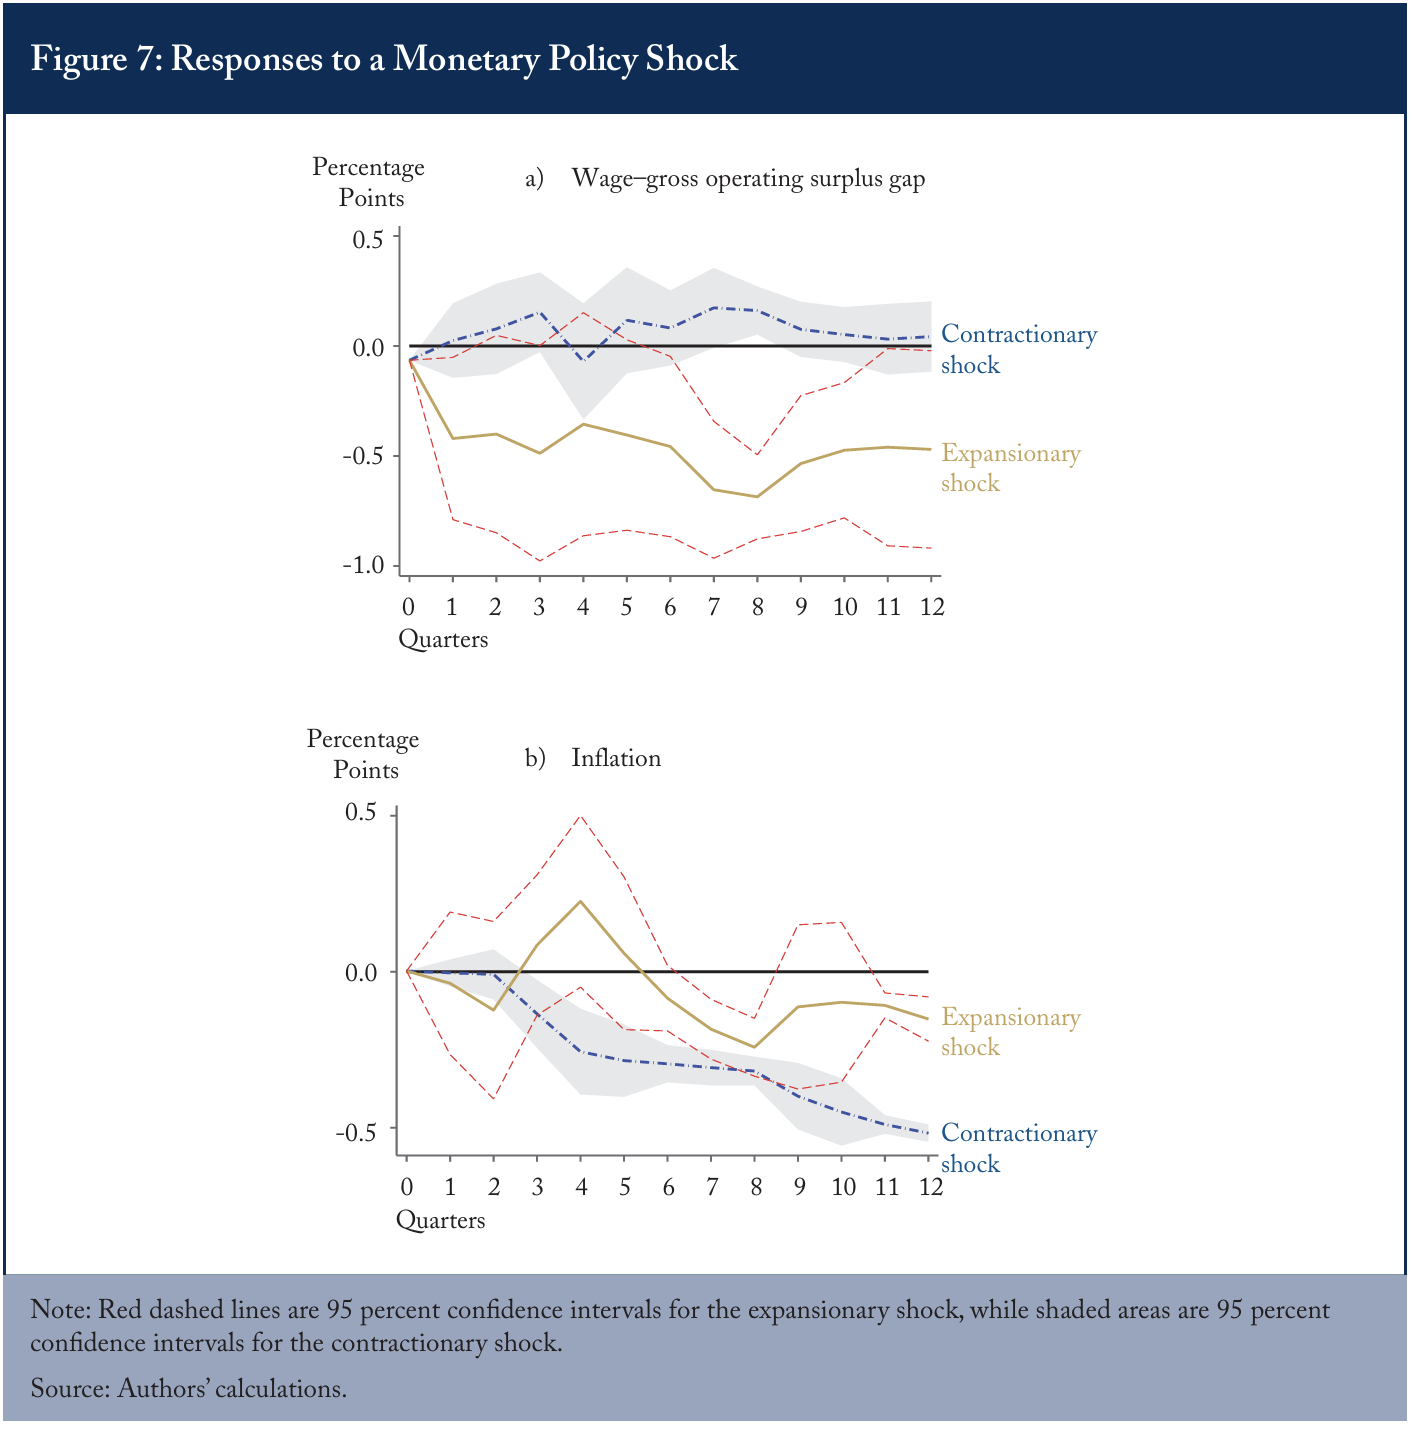
As it relates to inflation, while the effect of a contractionary monetary policy shock unambiguously reduces inflation, an expansionary shock has a mostly insignificant effect on inflation.1616 Differences between these inflation results and our earlier inflation results have to do with both the effects of now looking at quarterly data, and replacing the Gini coefficient with our wage–gross operating surplus variable.
One way to explain these inflation results is, indeed, by considering the effects of monetary policy on changes in the distribution of income. In the case of an expansionary shock, the increase in households´ income inequality (through the wage–gross operating surplus gap) implies a reallocation of disposable income from lower income households, which have a higher marginal propensity to consume, towards higher income households, which have a lower marginal propensity to consume (as we saw is true for Canada). The aggregate effect would be to dampen the effect of the monetary policy shock on inflation, as is observed in the short term, and if the increase in inequality is large enough, to potentially reduce inflation, as is observed after six quarters. These results might help explain part of the tepid response to expansionary monetary policy in the post-crisis period.
In contrast, although the point estimates indicate that a contractionary policy shock increases the gap between wages and the gross operating surplus, the magnitude of the effect is relatively small and not statistically significant. This could be due to the adverse effect of the impact of the monetary policy shock on economic activity, which could negatively affect the labor market and thus the availability of disposable income to lower income households. We would therefore get the typical reduction in inflation.
Conclusion
We have shown in this paper that income inequality matters for the transmission of monetary policy in Canada within the real economy. Our focus has been the Bank of Canada’s (continuing) inflation-targeting period, a time characterized by increasing income inequality up until the lead-up to the financial crisis, and a flattening (or even decrease) thereafter. Our results show that expansionary monetary policy shocks led to the redistribution of a greater share of resources towards higher income households, while contractionary shocks do the same for lower income households, through the impact on sources of income. Because higher (lower) income individuals are characterized as having lower (higher) marginal propensities to consume, a shift of resources towards the group results in a lower (higher) response of aggregate demand to a monetary policy shock, depressing (lifting) inflation.
These results matter for both central bankers and fiscal policymakers. Our focus, however, is on the former, and for the Bank of Canada, the mandate is to target inflation, not inequality per se. However, it is useful for the Bank’s purposes to have a complete picture of the transmission mechanism, especially when there are asymmetric effects from expansionary versus contractionary monetary policy shocks, and these could have direct links to inflation through different marginal propensities to consume. These results present an argument for factoring heterogeneity into the Bank of Canada’s forecasting models.
References
Almås, Ingvild. 2012. “International Income Inequality: Measuring PPP Bias by Estimating Engel Curves for Food.” American Economic Review 102 (2): 1093–1117.
Ambler, Steve, and Jeremy Kronick. 2018. Navigating Turbulence: Canada’s Monetary Policy since 2004. Toronto: C. D. Howe Institute.
Ampudia, Miguel, Dimitris Georgarakos, Jiri Slacalek, Oreste Tristani, Philip Vermeulen, and Giovanni L. Violante. 2018. “Monetary policy and household inequality.” European Central Bank Working Paper Series. No. 2170.
Auerbach, Alan J., and Y. Gorodnichenko. 2012. “Measuring the Output Responses to Fiscal Policy.” American Economic Journal: Economic Policy 4(2): 1-27.
Blanchard, Olivier J., and Danny Quah. 1989. “The Dynamic Effects of Aggregate Demand and Supply Disturbances.” The American Economic Review 79(4): 655–673.
Boivin, Jean, Marc P. Giannoni, and Ilian Mihov. 2009. “Sticky Prices and Monetary Policy: Evidence from Disaggregated US Data.” American Economic Review 99 (1), 350–84.
Brzoza-Brzezina, M., M. Kolasa, G. Koloch, K. Makarski, and M. Rubaszek. 2013. “Monetary policy in a non-representative agent economy: A survey.” Journal of Economic Surveys 27(4):641-669.
Butler, Leo. 1996. “A Semi-Structural Method to Estimate Potential Output: Combining Economic Theory with a Time-Series Filter. The Bank of Canada’s New Quarterly Projection Model, Part 4.” Technical Report No. 77. Ottawa: Bank of Canada.
Canova, Fabio, and Gianni De Nicoló. 2002 “Monetary disturbances matter for business fluctuations in the G-7.” Journal of Monetary Economics 49(6): 1131–1159.
Cantore, C., F. Ferroni, and M.A. León‐Ledesma. 2018. “The missing link: monetary policy and the labor share.” Centre for Macroeconomics Discussion Paper Series No. CFM-DP2018-29.
Carrillo, Julio A., and Rocío Elizondo. 2015. “Identification of a Monetary Policy Shock in a Small Open Economy.” Unpublished Manuscript.
Champagne, Julien, and Rodrigo Sekkel. 2018. “Changes in monetary regimes and the identification of monetary policy shocks: Narrative evidence from Canada.” Journal of Monetary Economics 99: 72-87.
Cochrane, John. 2015. “Whither Inflation?” The Grumpy Economist [Blog post]. Retrieved August 31 from https://johnhcochrane.blogspot.com/2015/08/whither-inflation.html.
Cravino, Javier, Ting Lan, and Andrei A. Levchenko. 2018. “Price Stickiness along the Income Distribution and the Effects of Monetary Policy.” Research Seminar in International Economics. The University of Michigan. Discussion Paper No.661.
Cushman, David O., and Tao Zha. 1997 “Identifying monetary policy in a small open economy under flexible exchange rates.” Journal of Monetary Economics 39(3): 433–448.
Faust, Jon. 1998. “The robustness of identified VAR conclusions about money.” Carnegie-Rochester Conference Series on Public Policy 49: 207–244.
Fisher, Jonathan, David Johnson, Timothy Smeeding, and Jeffrey Thompson. 2019. “Estimating the Marginal Propensity to consume Using Distributions of Income, Consumption, and Wealth.” Federal Reserve Bank of Boston, Working Paper No. 19-4.
Friedrich, Christian. 2016. “Global inflation dynamics in the post-crisis period: What explains the puzzles?” Economics Letters. Elsevier, 142(C): 31-34.
Friedrich, Christian, and Marc-Andre Gosselin. 2015. “Inflation Dynamics in the Post-Crisis Period.” Bank of Canada Review. Spring.
Guvenen, Faith. 2011. “Macroeconomics with heterogeneity: A practical guide.” The Federal Reserve Bank of Richmond Economic Quarterly 97(3): 255-326.
Haug, Alfred A., Tomasz Jędrzejowicz, and Anna Sznajderska. 2013. “Combining monetary and fiscal policy in an SVAR for a small open economy.” Working Paper No. 168, Narodowy Bank Polski.
Hendry, David, and Hans-Martin, Krolzig. 2001. Automatic Econometric Model Selection using PcGets 1.0, 4th Edition. London: Timberlake Consultants Press.
Hohberger, Stefan, Romanos Prifitis, and Lukas Vogel. 2019. “The Distributional Effects of Conventional Monetary Policy and Quantitative Easing: Evidence from an Estimated DSGE Model.” Bank of Canada, Staff Working Paper, 2019-6.
Jorda, Oscar. 2005. “Estimation and inference of impulse responses by local projections.” American Economic Review 95:161–182.
Kaplan, Greg, Benjamin Moll, and Giovanni L. Violante. 2018 “Monetary Policy According to HANK.” American Economic Review 108 (3): 697-743.
Kaplan, Greg. and Giovanni L. Violante. 2018. “Microeconomic heterogeneity and macroeconomic shocks.” Journal of Economic Perspectives 32 (3): 167-194.
Kronick, Jeremy, and Francisco Villarreal. 2019. “Distributional Impacts of Low for Long Interest Rates.” Studies and Perspectives series – ECLAC Subregional Headquarters in Mexico, No. 180, Economic Commission for Latin America and the Caribbean. https://repositorio.cepal.org/bitstream/handle/11362/44666/1/S1900509_en.pdf.
Kronick, Jeremy, and Steve Ambler. 2018. Faulty Transmissions: How Demographics Affect Monetary Policy in Canada. Commentary 506. Toronto: C.D. Howe Institute. March.
Kronick, Jeremy, and Steve Ambler. 2019 “Do Demographics Affect Monetary Policy Transmission in Canada?” International Journal of Finance and Economics. April. 24(2): 787-811.
Kronick, Jeremy and Farah Omran. 2018. “Missing Inflation – What’s the Story?” Working Paper. Toronto: C.D. Howe Institute.
Lewis, Jeffrey B., and Drew A. Linzer. 2005. “Estimating regression models in which the dependent variable is based on estimates.” Political Analysis 13: 345–364.
Lubik, Thomas A., and Frank Schorfheide. 2007. “Do central banks respond to exchange rate movements? A structural investigation.” Journal of Monetary Economics 54(4): 1069–1087.
Parkin, Michael. 2016. “Mounting Evidence: Findings from Natural Experiments in Inflation Targeting.” E-Brief 233. Toronto: C.D. Howe Institute.
Parrado, Eric. 2001. Effects of Foreign and Domestic Monetary Policy in a Small Open Economy: The Case of Chile. Working Paper No. 108, Banco Central de Chile.
Pichette, Lise, Pierre St-Amant, Ben Tomlin, and Karine Anoma. 2015. “Measuring Potential Output at the Bank of Canada: The Extended Multivariate Filter and the Integrated Framework.” Discussion Paper 2015-1. Ottawa: Bank of Canada.
Ramey, Valerie, and Sarah Zubairy. 2018. “Government Spending Multipliers in Good Times and in Bad: Evidence from US Historical Data.” Journal of Political Economy 126(2): 850-901.
Summers, Lawrence H. 2015. “Demand Side Secular Stagnation.” American Economics Review: Papers & Proceedings 105(5): 60-65.
Uhlig, Harald. 2005. “What are the effects of monetary policy on output? Results from an agnostic identification procedure.” Journal of Monetary Economics 52(2): 381–419.
Villani, Mattias, and Anders Warne. 2003. “Monetary Policy Analysis in a Small Open Economy Using Bayesian Cointegrated Structural VARs.” European Central Bank Working Paper No. 296.
Villarreal, Francisco G. 2016. “Monetary Policy and Inequality in Mexico” MPRA Paper 84588, University Library of Munich.
Williams, John, C. 2010. “Sailing into Headwinds: The Uncertain Outlook for the U.S. Economy.” Presentation to a Joint Meeting of the San Francisco and Salt Lake City Branch Boards of Directors, Salt Lake City, Utah. 8 September.