



by John Richards
- Following each Census, Indigenous Services Canada publishes the Community Well-Being Index (CWB), constructed for all First Nation and Inuit communities. The CWB combines four sub-indices: a measure of per capita income, education level, labour force activity, and housing quality. For comparative purposes, CWB scores are also calculated for nonIndigenous communities.
- From the first CWB index in 1981 to 2016, the average First Nation score has risen from 45.0 to 58.4, the Inuit score from 46.1 to 61.3, and the non-Indigenous score from 64.5 to 77.5. (Scores range from 0 – 100.) All three scores have risen, but the gaps between nonIndigenous on the one hand, and either First Nation or Inuit have remained nearly constant.
- The dispersion of Inuit and First Nation scores is much larger than for non-Indigenous communities. The lowest regional CWB scores are in the Prairies, in Manitoba and Saskatchewan in particular.
- There is a long tradition of social policy emphasizing the importance of employment in achieving community well-being. However, the design of the CWB accords little weight to the employment rate in construction of the CWB.
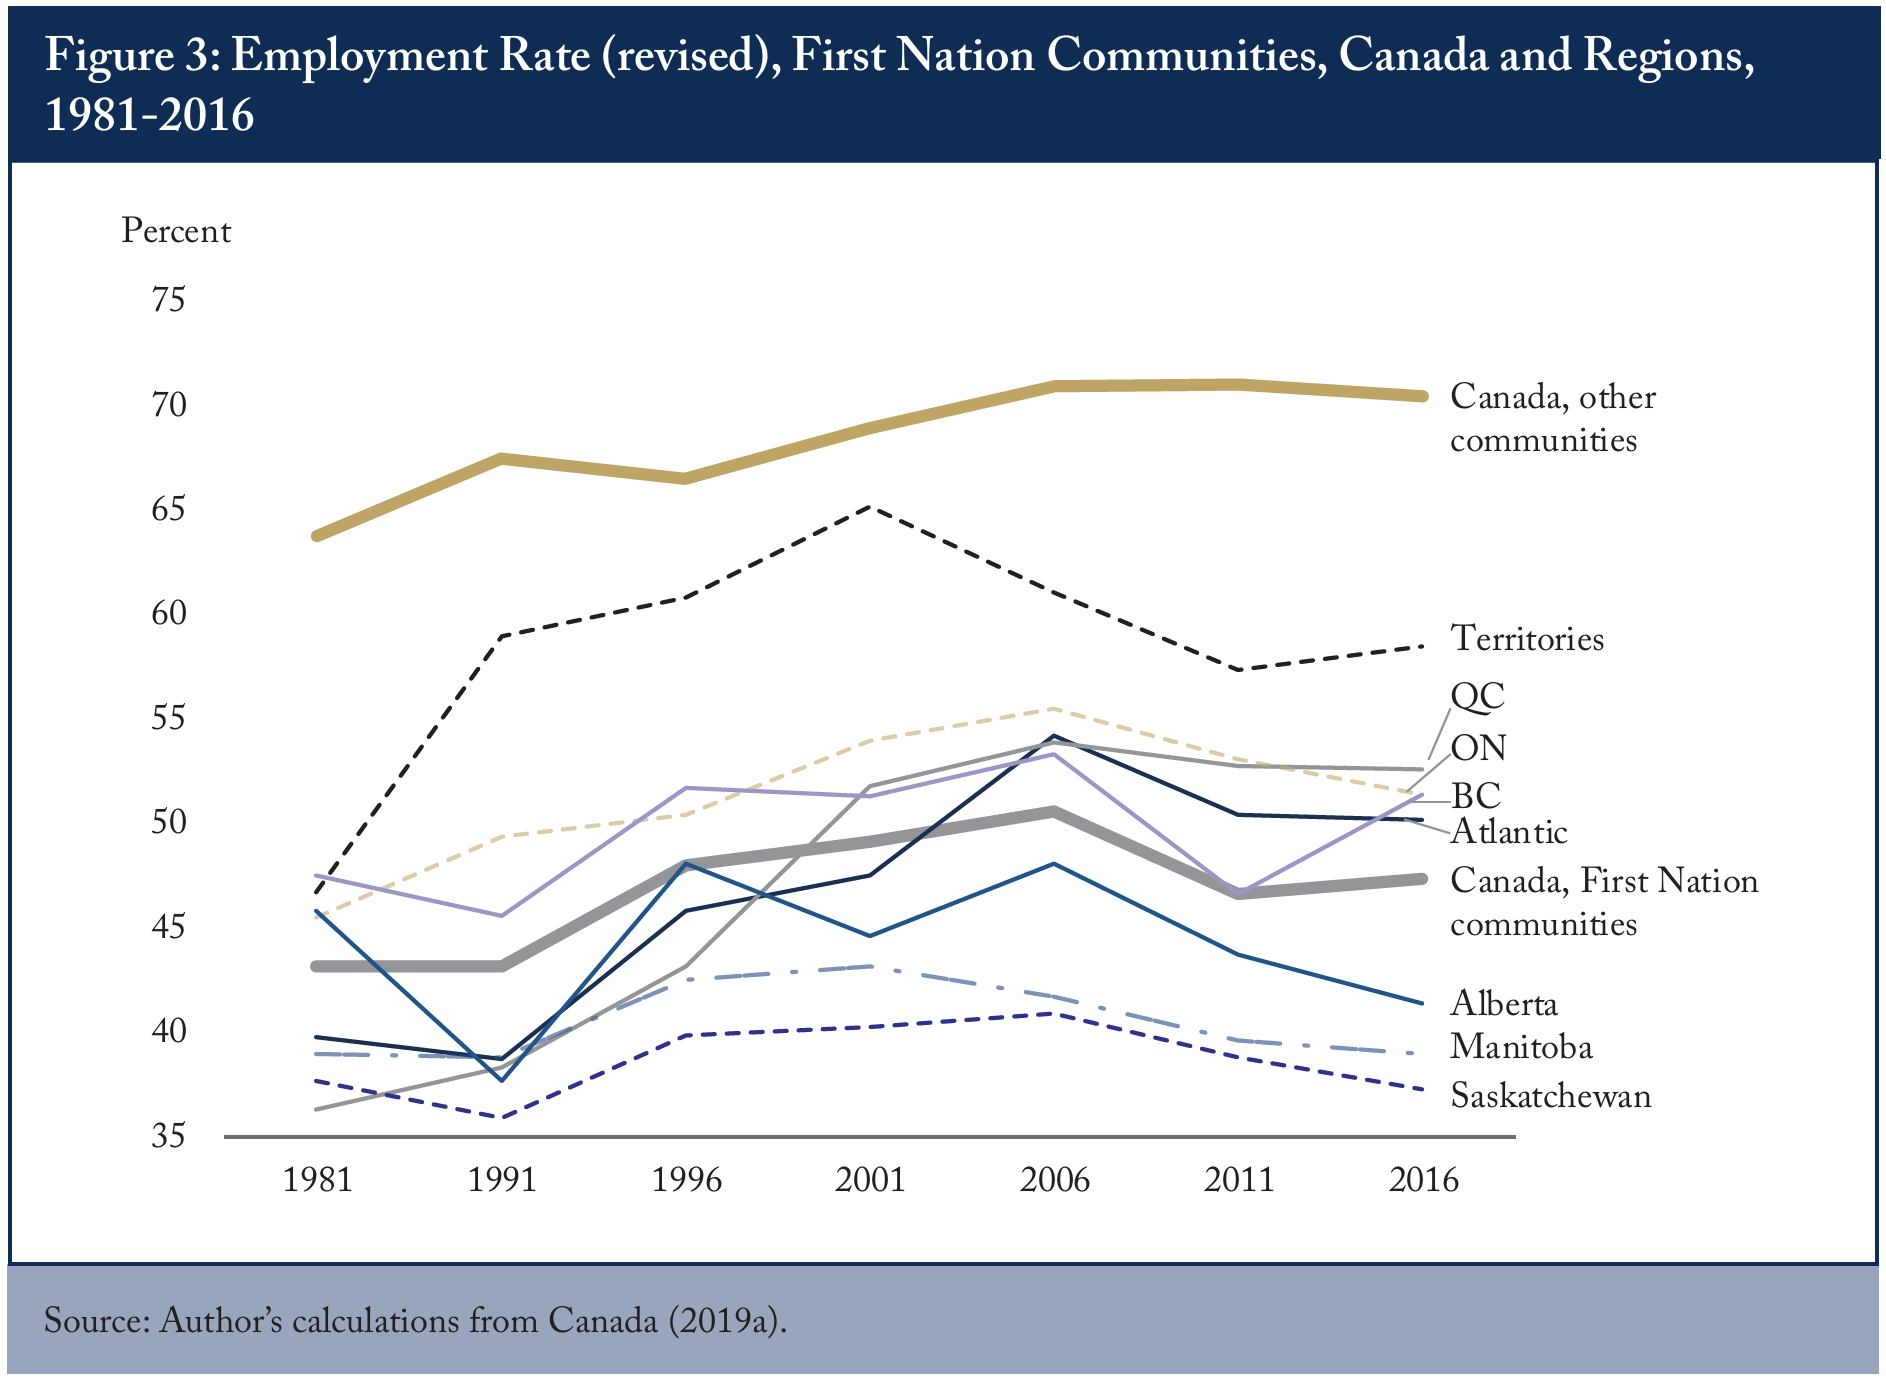
- Based on the Statistics Canada definition, the national First Nation employment rate was two-thirds the non-Indigenous rate in 1981 and in 2016. Since 1981, regional First Nation employment rates have diverged. The 1981-2016 increases in the rate are substantial (over 10 percentage points) in the Atlantic region, Quebec, and the Territories. On the other hand, rates since 1981 have stagnated in Manitoba and Saskatchewan, and declined in Alberta.
Measuring “development” or “well-being” among human societies is a challenging undertaking; assessing the underlying factors at play is even more so.
In the 1980s, several prominent development economists designed a simple index to assess dimensions of progress – or lack of progress – among developing countries. Since 1990, the United Nations (2019) has published annual Human Development Index rankings for nearly 200 countries. The HDI is a single number, constructed with equal weight accorded to three sub-indices. The first concerns per capita income ; the second is a combination of two education measures (average years of schooling for adults aged 25 years and over, and expected years of schooling for children of school age); the third is an adjusted life expectancy measure (Stanton 2007).
Since 1981, Ottawa has published the Community Well-Being Index (CWB), an exercise in rating social conditions in individual First Nation and Inuit communities, constructed from results of the most recent Census. In order to compare with mainstream Canadian communities, the CWB provides equivalent results for “other” communities across Canada. The CWB is constructed from four equally weighted sub-indices: per capita income, an education index, a labour-force participation index, and a housing index.11 Missing from the CWB is a measure of health status. It is probably not feasible to design a suitable index for individual First Nation communities. However, a measure such as life expectancy at birth or potential years of life lost could be calculated on a regional basis. The rationale for the CWB is the same as that for the HDI, and the sub-indices, from which the CWB is calculated, are similar to those underlying the HDI (see Appendix). Both indices are heroic attempts to provide an overall assessment of life chances among people living in particular low- or medium-income countries or First Nation and Inuit communities.
Use of indices, such as HDI or CWB, has prompted many legitimate questions. What does it mean if First Nation community A ranks higher than First Nation community B? Why not construct the index with different sub-indices? Why transform sub-indices (for example, defining the log of income as the per capita income sub-index)? There are no perfect answers to such questions. While reasonable people can disagree on each of such questions, an assumption underlying the HDI and CWB is that the sub-indices are measuring more-or-less universally valued socio-economic dimensions of any community, whatever be its national, cultural, or ethnic characteristics.22 In this study I take exception to one CWB sub-index that I find misleading. Scoring well on these indices is obviously not the only relevant criterion for defining wellbeing, and small index differences between nations or communities are not meaningful; large differences are meaningful.
The first goal of this E-Brief is to provide a summary of the latest CWB data, based on the 2016 Census. The second is to make the case that the low employment rate among many First Nation communities deserves far more policy attention than it currently receives. The problems arising from low employment are particularly acute in the Prairies.
At least since the 1996 report of the Royal Commission on Aboriginal Peoples, the dominant agenda among Indigenous and non-Indigenous political leaders, among academics, and among policy analysts has been rehabilitation of First Nation cultures via expansion of treaty rights. To quote the 1996 report:
Assimilation policies have done great damage, leaving a legacy of brokenness affecting Aboriginal individuals, families and communities … Yet the damage is not beyond repair. The key is to reverse the assumptions of assimilation that still shape and constrain Aboriginal life chances … To bring about this fundamental change, Canadians need to understand that Aboriginal peoples are nations [emphasis in original] … To this day, Aboriginal people’s sense of confidence and well-being remains tied to the strength of their nations. Only as members of restored nations can they reach their potential in the twenty-first century. (Canada 1996, x-xi.)
This is a legitimate and valuable agenda. However, to the extent this agenda implies that those identifying as First Nations cannot “reach their potential” as individuals living in cities, and that closing socio-economic gaps between First Nation and “other” communities can be subsumed under strategies designed to affirm treaty rights that strengthen First Nations, it is a limiting agenda. Although average CWB scores for First Nations have modestly increased since 1981, many sub-indices are not rising.33 As noted by Flanagan (2019b). Since 1981, the First Nation average score has risen from 45.0 to 58.4; the “other” communities score has risen from 64.5 to 77.5. The difference between them has remained constant at approximately 19 percentage points. In particular, I argue that we need to examine closely implications of the low employment score embedded in the CWB.
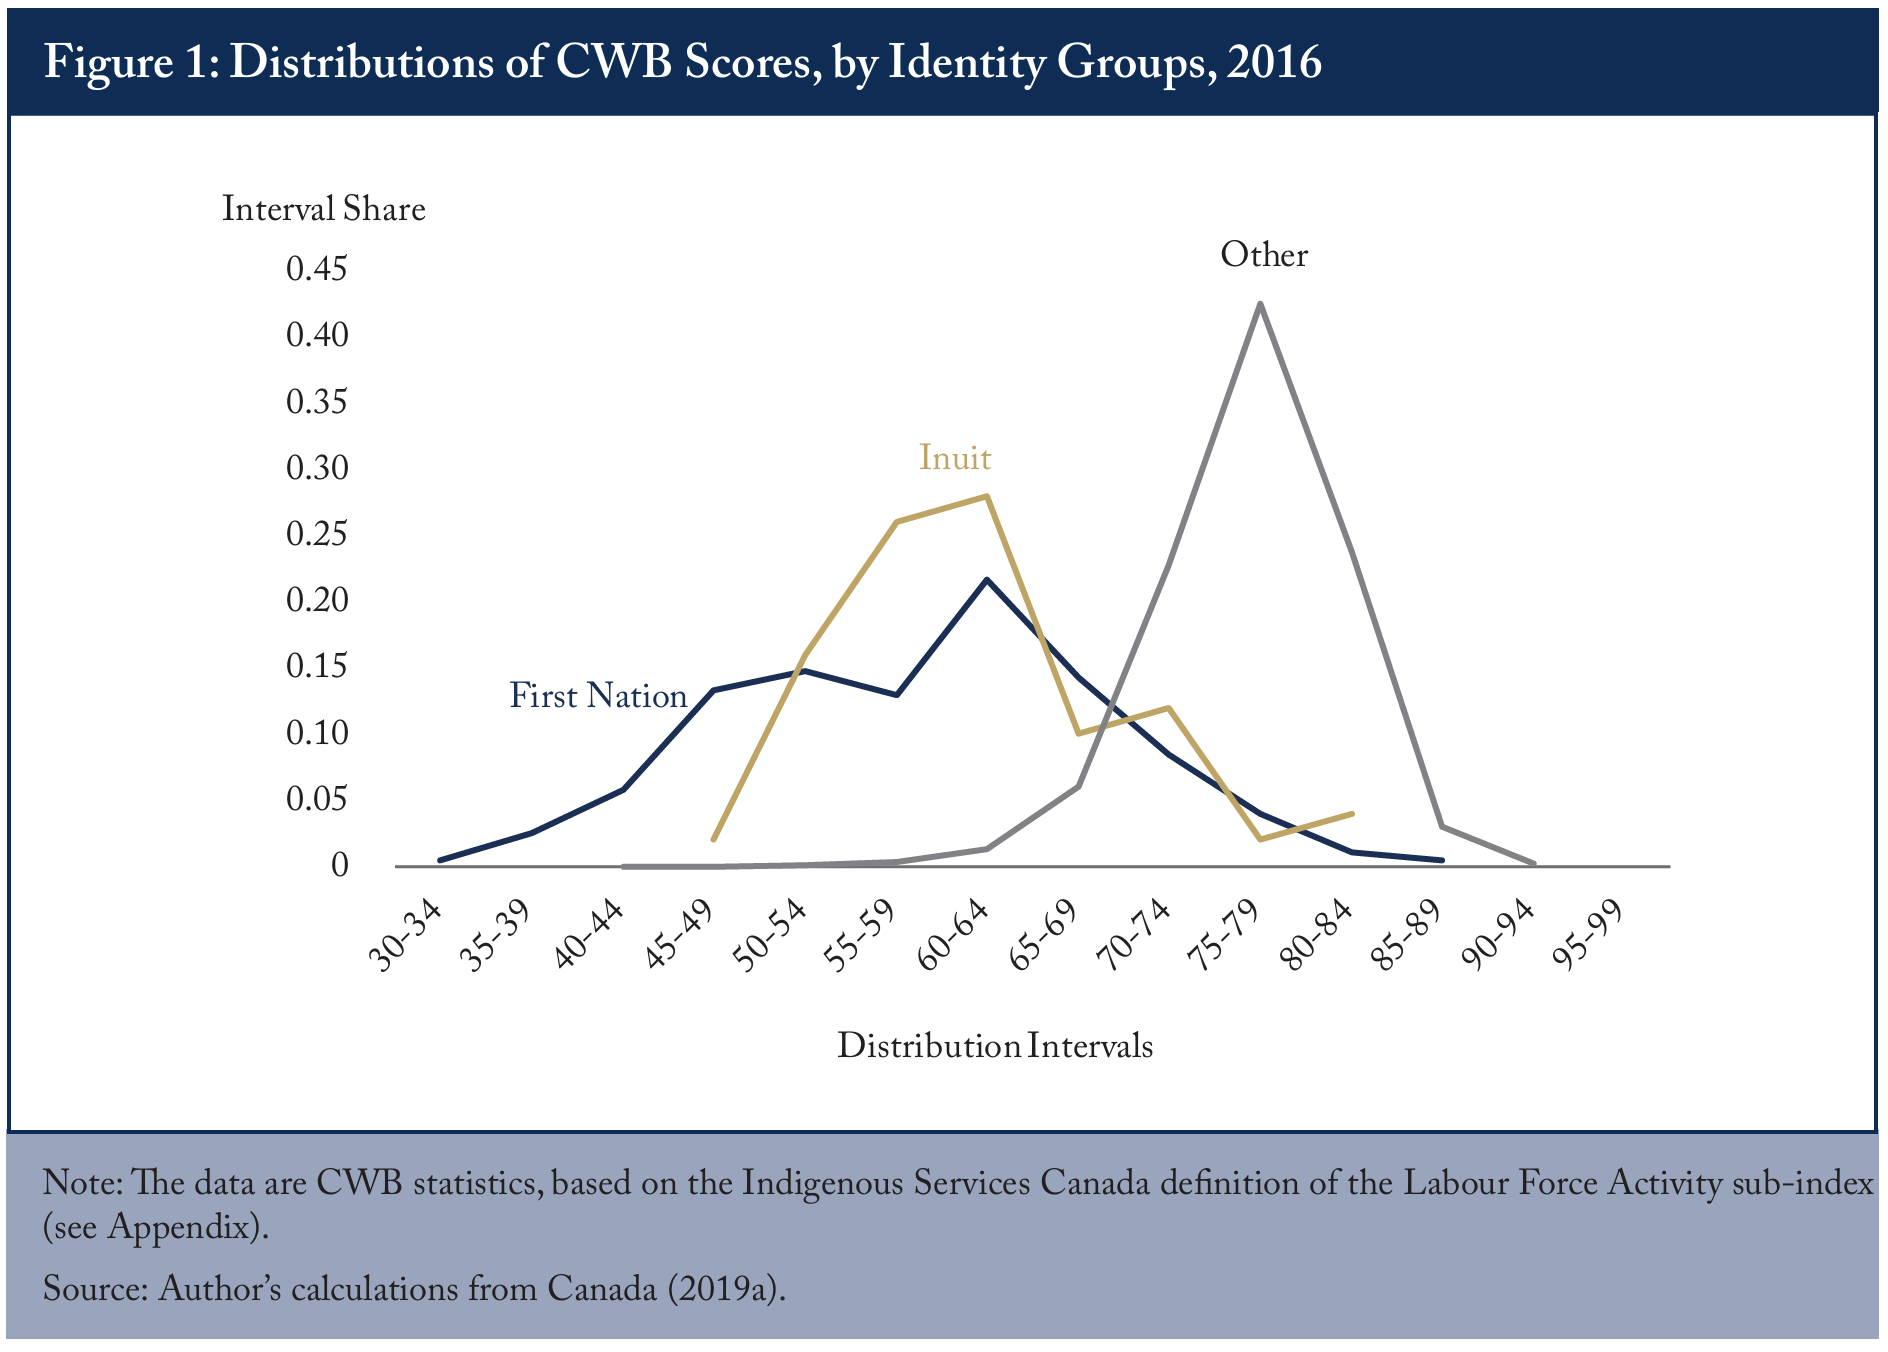
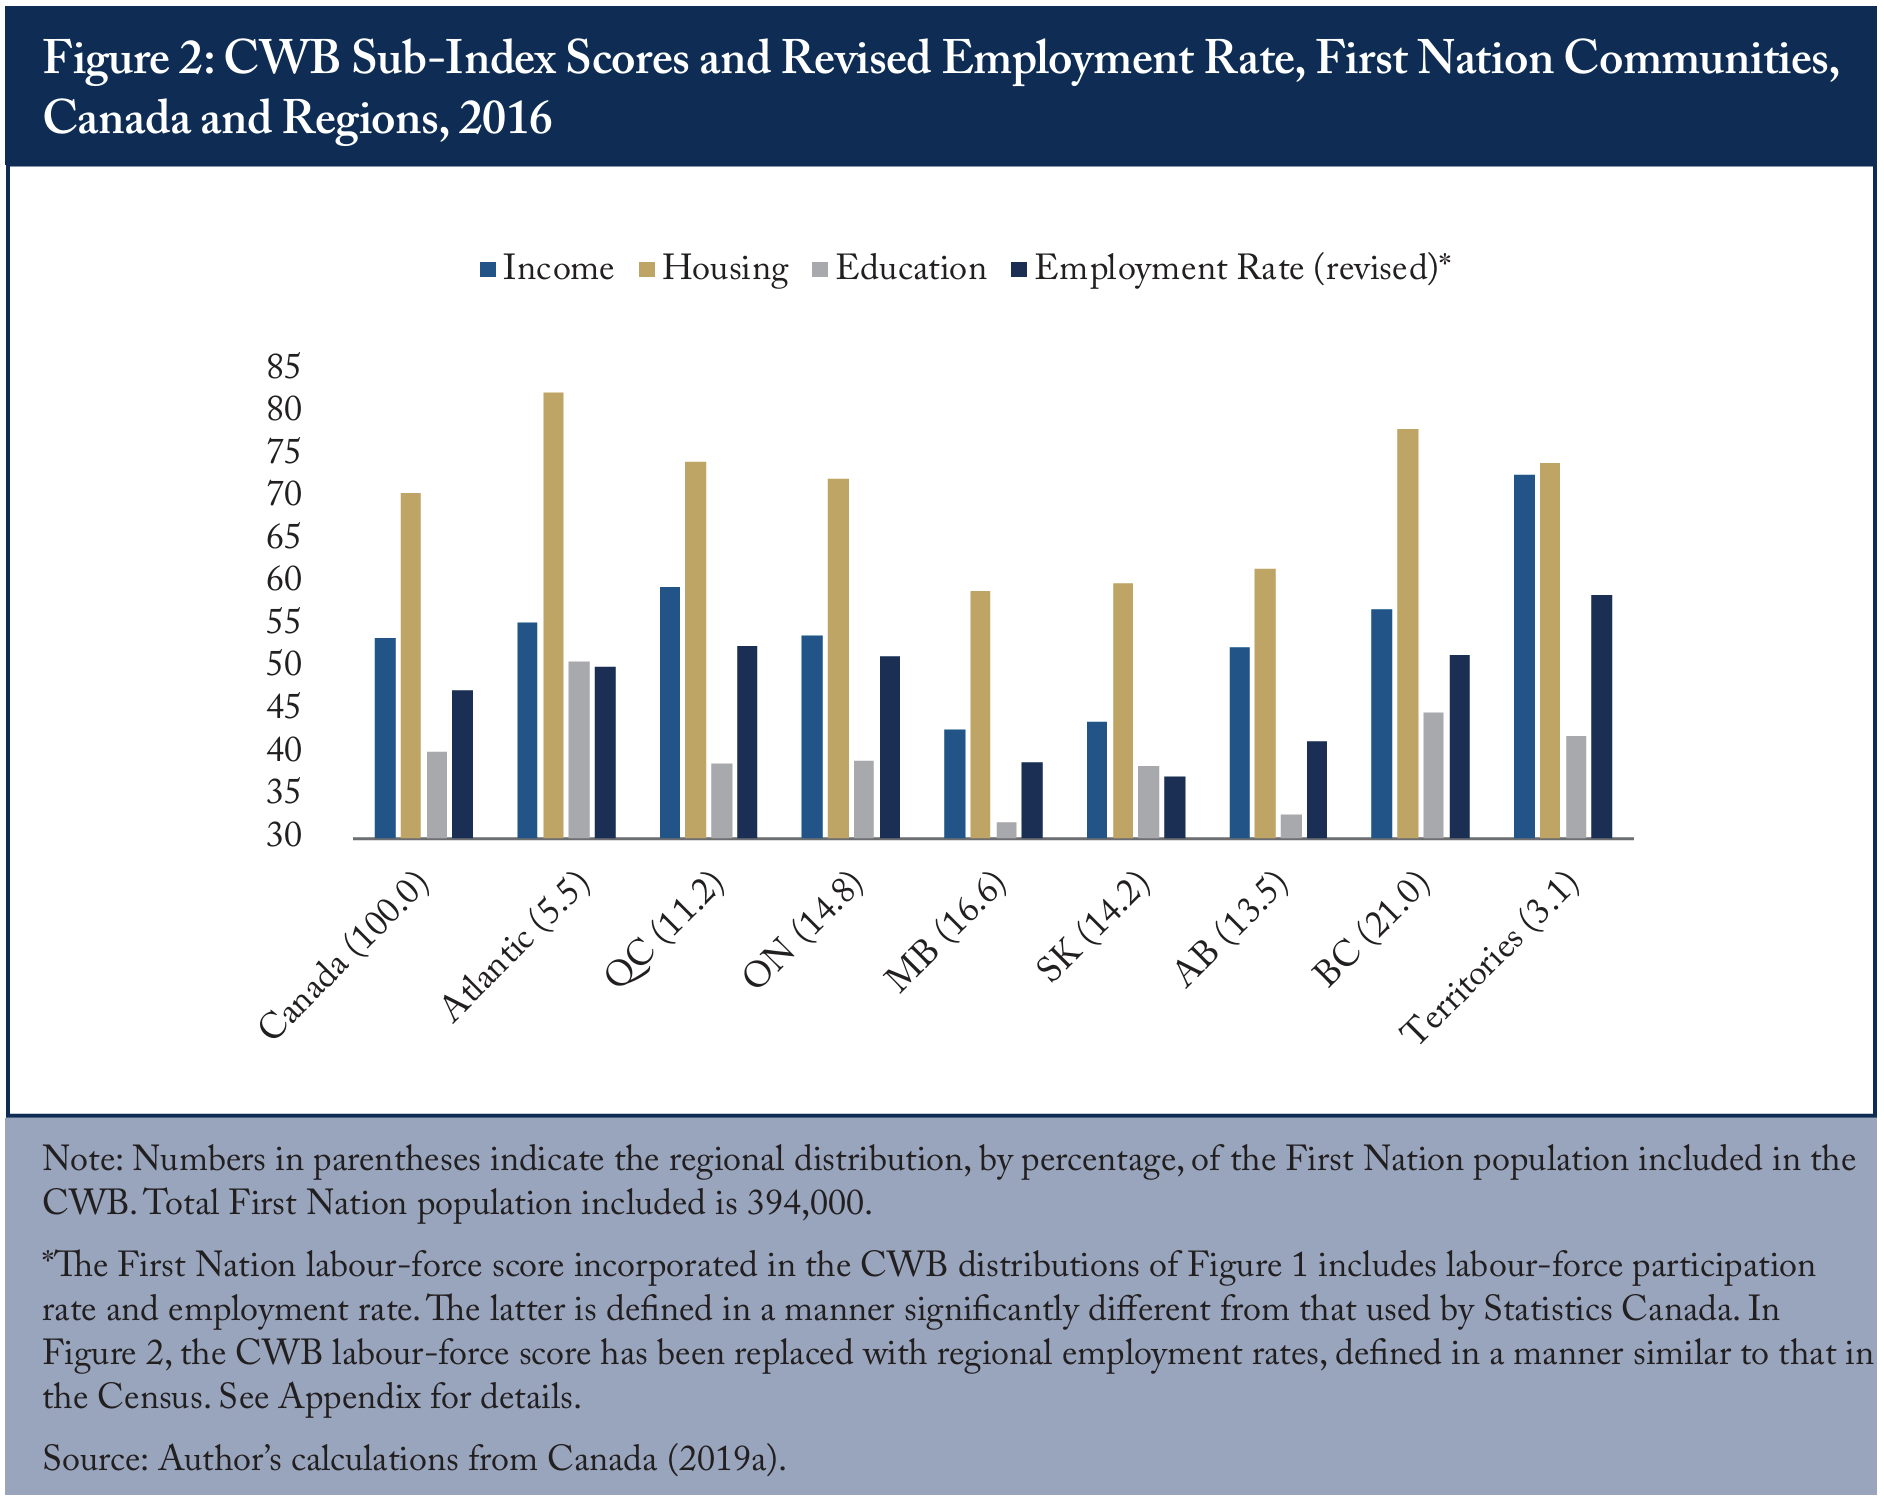
Statistics Canada provides the Census data from which Indigenous Services Canada has constructed 2016 CWB scores for 623 First Nation communities, 50 Inuit communities, and 3,781 “others” (ranging from Toronto, Montreal, and Vancouver to small villages). Figure 1 illustrates the three distributions of scores (using the published CWB data). Figure 2 illustrates, for First Nation communities, average regional scores on the four subindices from which the CWB is calculated. There are several obvious conclusions to draw:
- The mean CWB values for First Nation and Inuit communities are substantially lower than that for the “other” communities.
- The dispersion (standard deviation) of CWB values for Inuit communities, and even more so in the case of First Nation communities, is much larger than for the “other” communities.44 The standard deviations of the three communities are 5.0 (“other”), 7.6 (Inuit), and 10.8 (First Nation). One implication of the high variance among First Nation communities is the large range in socio-economic conditions among these communities.
- There exists overlap among the three distributions – but not much. Coincidentally, 71 is the top decile CWB score for the First Nation and Inuit communities, and the bottom decile for the “other” communities. In other words, nine of ten First Nation and Inuit communities score below 71; nine of ten of the “other” communities score above 71.
- At a regional level, the most severe social outcomes, as measured by the CWB sub-indices, are in the three Prairie provinces, which collectively account for 45 percent of the population living in a First Nation community.
Employment Matters
There is a long tradition in social policy that emphasizes the role of employment – young adult male employment in particular – as a key determinant of social outcomes in a community. There are several motivations behind the emphasis on employment:
- In general, two-parent families realize better outcomes for children and for themselves than do oneparent alternatives. In any community, women, when choosing marriage partners, use employment as a proxy for men’s suitability as fathers. In marginalized communities, where many young men experience a low employment rate, young women often seek second-best alternatives (such as grandmothers as prime caregivers) for raising children (Wilson 1996; Murray 2012).
- Adverse employment conditions are particularly damaging for men with low education levels. Over the last quarter century in the US and most other high-income countries, men with high school or less have disproportionately experienced employment and income declines and above-average prevalence of many pathologies (Autor et al. 2018).
- Those not in education, employment, or training are by definition the NEET population. In the 20- to 29-year-old cohort, adults typically form unions and begin families. The NEET subset of this cohort is less likely to form stable unions than the non-NEET. The Indigenous NEET rate among 20- to 24-year-olds is approximately twice that for the total Canadian population. This group is less likely to participate actively in raising children that arise from a union, and is prone to depression and abuse of alcohol and drugs (Putnam 2015; Brunet 2019; Case and Deaton 2020).
As summarized in the above bullets, the emphasis on employment may appear reductive. There is, nonetheless, extensive evidence that the “employment thesis” is crucial to understanding intergenerational poverty in highincome countries. There is no reason to think First Nation communities are exempt from these dynamics. To acknowledge the dire effects of low employment in many First Nation communities does not deny the destructive historical legacy of discrimination toward the Indigenous population; it does, however, imply a renewed priority to address low employment.
William Julius Wilson, a prominent American sociologist, developed his ideas on the role of employment in family formation primarily in the context of American inner-city ghettos. Writing in 1996, he summarized:
The disappearance of work and the consequences of that disappearance for both social and cultural life are the central problems in the inner-city ghetto. To acknowledge that the ghetto still includes working people and that nearly all ghetto residents, whether employed or not, support the norms of the work ethic … should not lead one to overlook the fact that a majority of adults in many inner-city neighborhoods are jobless at any given point in time. (Wilson 1996, xix.)
Wilson’s emphasis on joblessness as a central factor in understanding social dysfunction in urban ghettos is applicable to some First Nation communities, particularly those in remote areas without reasonable access to employment.
In several studies, Autor, Dorn, and Hanson have extensively analyzed the impact of the decline in stable manufacturing employment over the last quarter century. In their most recent study, in 2018, they analyze change in manufacturing employment and social outcomes using detailed US census data at the local level between 1990 and 2014. Their conclusion is that, “On average, trade shocks differentially reduce employment and earnings of young adult males, compared to young women, and shocks to male’s relative earnings reduce marriage and fertility. Consistent with prominent sociological accounts, these shocks heighten male idleness and premature mortality, and raise the share of mothers who are unwed and the share of children living in below-poverty, singleheaded households” (Autor et al. 2018).
Case and Deaton (2020) have analyzed, among cohorts of Americans born since 1940, the prevalence trends of numerous morbidities and sources of distress: suicide, chronic joint pain, difficulty in socializing, heavy drinking, mental distress, sciatic pain, drug/alcohol mortality, not married, never married, not in the labour force. Age adjusted, the more recent the date of birth the more prevalent are these sources of distress. Not only has prevalence risen among younger cohorts, the increase in prevalence rates has accelerated among cohorts born post-1980. The authors make no claim to have the definitive explanation for these trends. However, they introduce evidence on the importance of declines in wages and in labour force participation among white working-class Americans with education levels below a bachelor’s degree. Among younger cohorts of men with low education levels, the accelerating prevalence of these pathologies is more pronounced among white than among African and Hispanic Americans.
No studies as rigorous as those studying dynamics in low-employment US communities have been undertaken among the Indigenous population in Canada, but there exists abundant cross-section evidence – fragmentary and some of it dated – to the effect that First Nation communities with lower employment rates experience higher social dysfunction. Statistics Canada (Beattie et al. 2018) regularly publishes descriptive studies on homicide statistics in Canada, disaggregated in terms of Indigenous/non-Indigenous identity, gender, and province.55 Note that these data refer to all Indigenous people and do not differentiate between on- versus off-reserve location. In 2017, the national Indigenous share of total homicide victims stood at one-quarter; the Indigenous share of those accused of homicide stood above one-third. Nationally, these rates are approximately six times the comparable gender-specific non-Indigenous rates. Men comprise three-quarters of both Indigenous victims of homicide and Indigenous perpetrators. A disproportionately large share of Indigenous victims and Indigenous perpetrators of homicides (two-thirds in both categories) take place in the Prairie provinces, the regions with lowest employment.66 The memoirs of Harold Johnson (2016), long-time Crown prosecutor in northern Saskatchewan, provides a harrowing account of social problems in First Nation communities. He emphasizes the problems arising from alcoholism.
Figure 3 provides an overview of national and regional 1981-2016 employment trends among First Nation and “other” communities (using the revised employment rate definition discussed below). Nationally, the First Nation employment rate has risen modestly, as has the national rate among “other” communities. However, at the regional level employment rates have diverged. The 1981-2016 increases in the employment rate are substantial (over 10 percentage points) in the Atlantic region, Quebec, and the Territories. On the other hand, employment since 1981 has stagnated in Manitoba and Saskatchewan, and declined in Alberta.
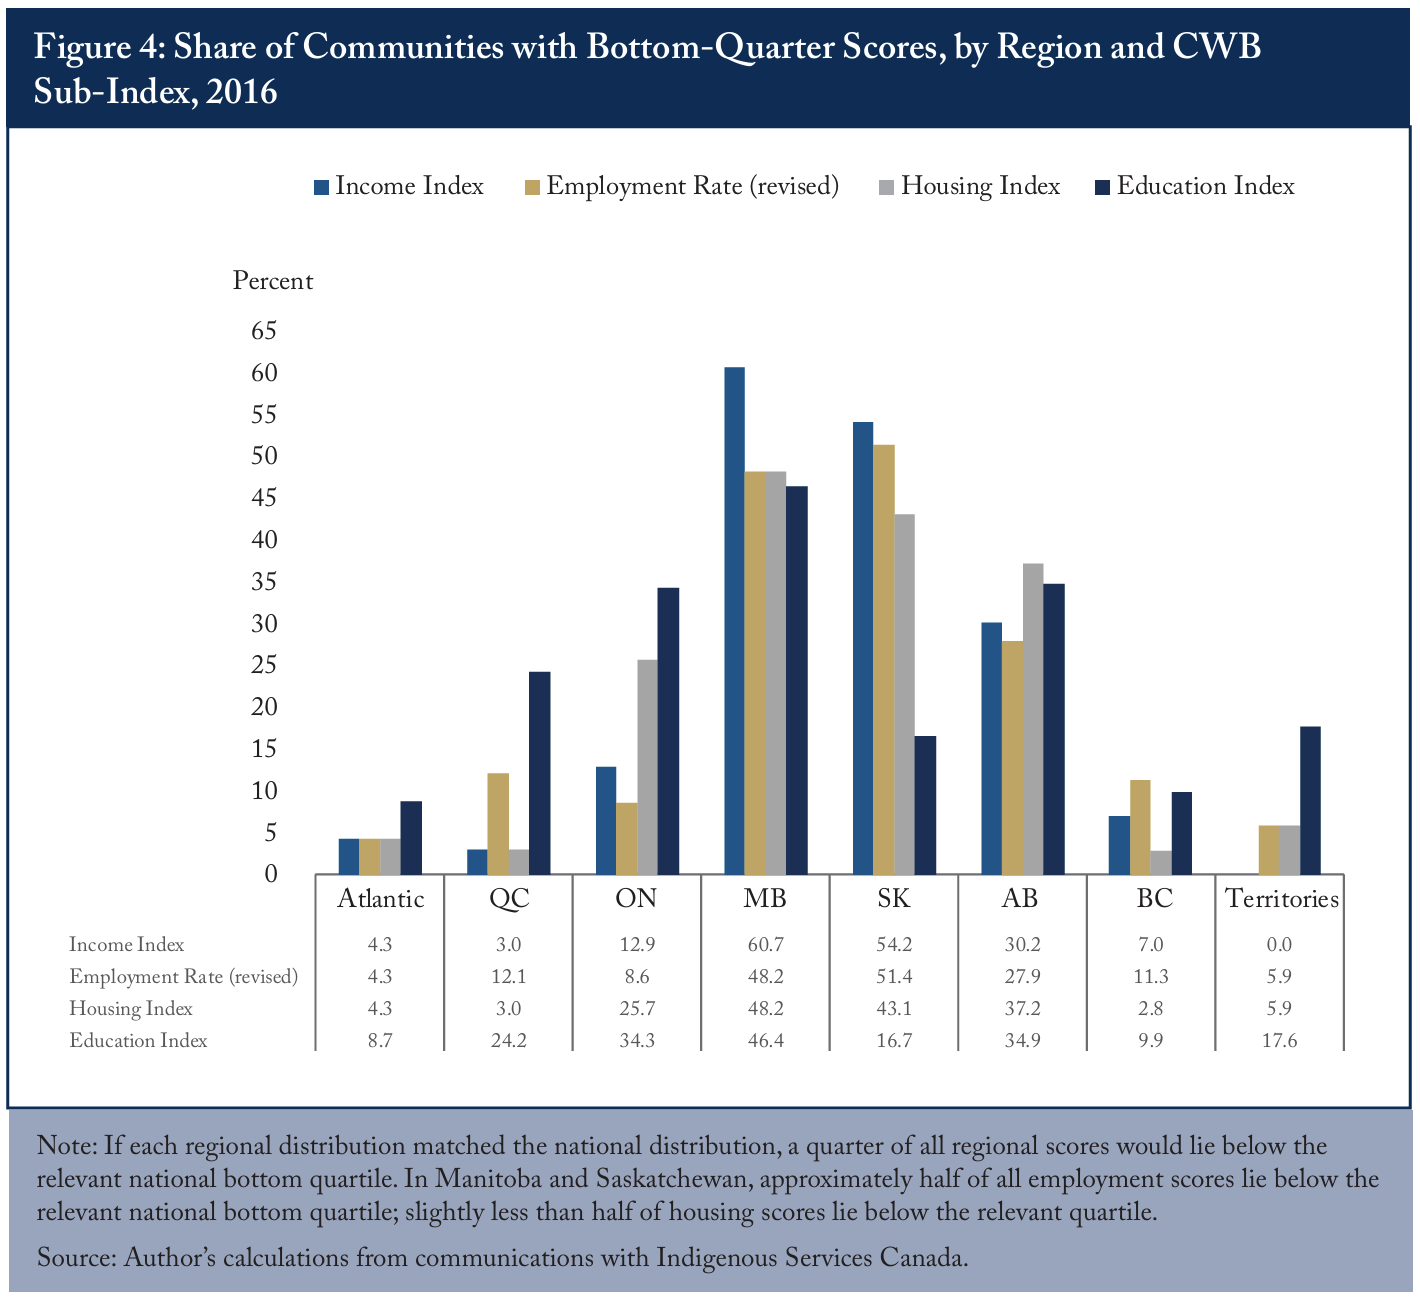
Prairie communities are dramatically overrepresented in the bottom quarter of results for each CWB subindex (see Figure 4). In Manitoba and Saskatchewan, half of First Nation communities have an employment rate below the national employment bottom quartile; slightly less than half display a housing score below the relevant bottom quartile (see Table A1 for quartile statistics). Not surprisingly, the income index of over half of First Nation communities in these two provinces is below the bottom quartile. In Alberta, bottom quarter prevalence of the four indices is (with one exception) lower than in the two other Prairie provinces; prevalence is nonetheless above the national average.
Since the beginning of this century, a major migration from reserve to town has been taking place among those who identify in the Census as First Nation. In the 2001 Census, 45 percent of the First Nation population resided on-reserve, in the 2016 Census only 34 percent did. The majority of the First Nation population now live in a city, over a third in a large city (population over 100,000).77 Changes in self-definition as First Nation between the 2001 and 2016 Census may explain some of the change in location of residence. A more restrictive definition of the First Nation population is registration under the Indian Act. By this definition, the decline in on-reserve share between 2001 and 2016 was similar in magnitude: from 49 percent to 40 percent. For additional detail, see Richards (2018). Why this migration? Probably, the best answers come from the large-scale survey of 2,600 urban Indigenous people (Métis and Inuit, as well as First Nation88 The differences in distribution of reasons for migration, between those who identified as First Nation or Métis, were minor.) undertaken for the Urban Aboriginal Peoples Study:
When asked (unprompted, without response options offered) why they first moved to their city, equal proportions cite the opportunity to be closer to family (38%), and the pursuit of education (37%) and employment opportunities (37%). Smaller proportions say they moved to their city because it offered better amenities (18%), the chance to escape a bad family situation (10%) and the opportunity for career advancement (9%). (Environics 2010, 32.)
A recent report of the First Nations Information Governance Centre (FNIGC 2018, 32-33) confirms that employment and education opportunities are the primary reasons stated by those who leave a First Nation community; family connections are the most important reasons for moving back to the community. Mobility is high, and migration obviously takes place in both directions. The report does not however discuss net migration trends.
One potential objection to an emphasis on employment in the context of First Nation communities, most of which are rural, is the definition of “employed person.” If restricted to paid work in the context of a formal employer-employee relationship, employment has limited relevance. Fortunately, the Census definition of an employed person (Canada 2019b) is much broader than “paid work” (emphases added below):
‘Employed person’ refers to those who, during the reference period, had a labour force status of “employed”. That is, those who, during the reference period: (a) Did any work at all at a job or business, that is, paid work in the context of an employer-employee relationship, or self-employment. This also includes persons who did unpaid family work, which is defined as unpaid work contributing directly to the operation of a farm, business or professional practice owned and operated by a related member of the same household; or (b) Had a job but were not at work due to factors such as their own illness or disability, personal or family responsibilities, vacation or a labour dispute. This category excludes persons not at work because they were on layoff or between casual jobs, and those who did not then have a job (even if they had a job to start at a future date).
Statistical Results
In addition to regional disaggregation, the CWB enables a tentative exploration of employment effects, using the redefined labour force sub-index at the level of individual First Nation communities.
Undoubtedly, well-governed First Nation communities are improving their CWB ranking by various means beyond enhancing employment. Flanagan (2019a) concludes that, in better governed communities, members are more likely to obtain secure ownership of their homes (via the certificate of possession), which leads to a higher community housing index and via various routes to higher incomes. Aragon (2015) extends the argument in the context of new treaties and court decisions that have improved First Nation access to employment and revenue associated with natural resource projects. To the extent Flanagan and Aragon are right, the CWB housing quality index is a relevant proxy measuring the potential for collective business entrepreneurship, employment, and income.99 For a comprehensive discussion of factors contributing to good governance, see Flanagan (2019a).
Not surprisingly, partial correlation among the four sub-indices is high.1010 Partial correlations among the four sub-indices are shown in this table: 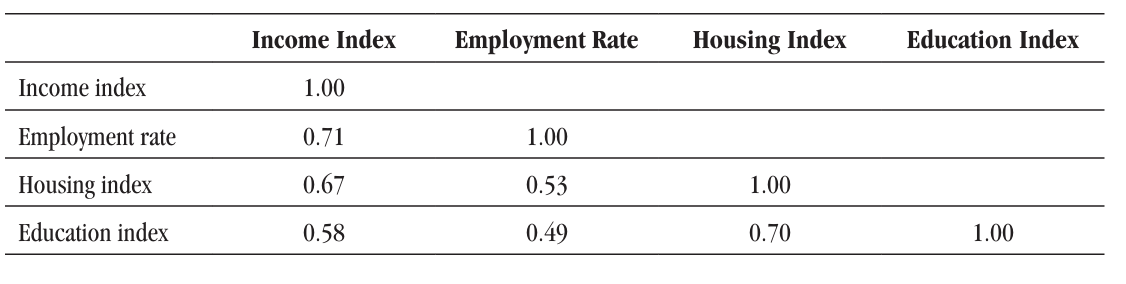 Any regression analysis based on CWB data at the community level is inevitably crude. Which does not mean the results are meaningless. Simple regressions of the community income score on the other indices provide evidence of a community’s benefit derived from employment. As discussed above, the community housing score may serve as a proxy for community governance quality. Hence, it makes sense to add the housing index as a second factor, in addition to the employment rate, as being closely associated with community income. A third factor included is community size. Several analysts have made the argument that, if too small, the community cannot achieve minimum efficient scale in local administration (Flanagan 2019a, 55; Graham 2012). (On the other hand, if too large, the community’s collective decision-making may become inefficient.)
Regression 1 illustrates the deviation of average regional income scores from that in the Atlantic region, which serves as benchmark. The key point to note is that, in Manitoba and Saskatchewan, average community income scores are more than 10 points lower than in Atlantic Canada and Ontario – and roughly 16 points lower than in Quebec and British Columbia.
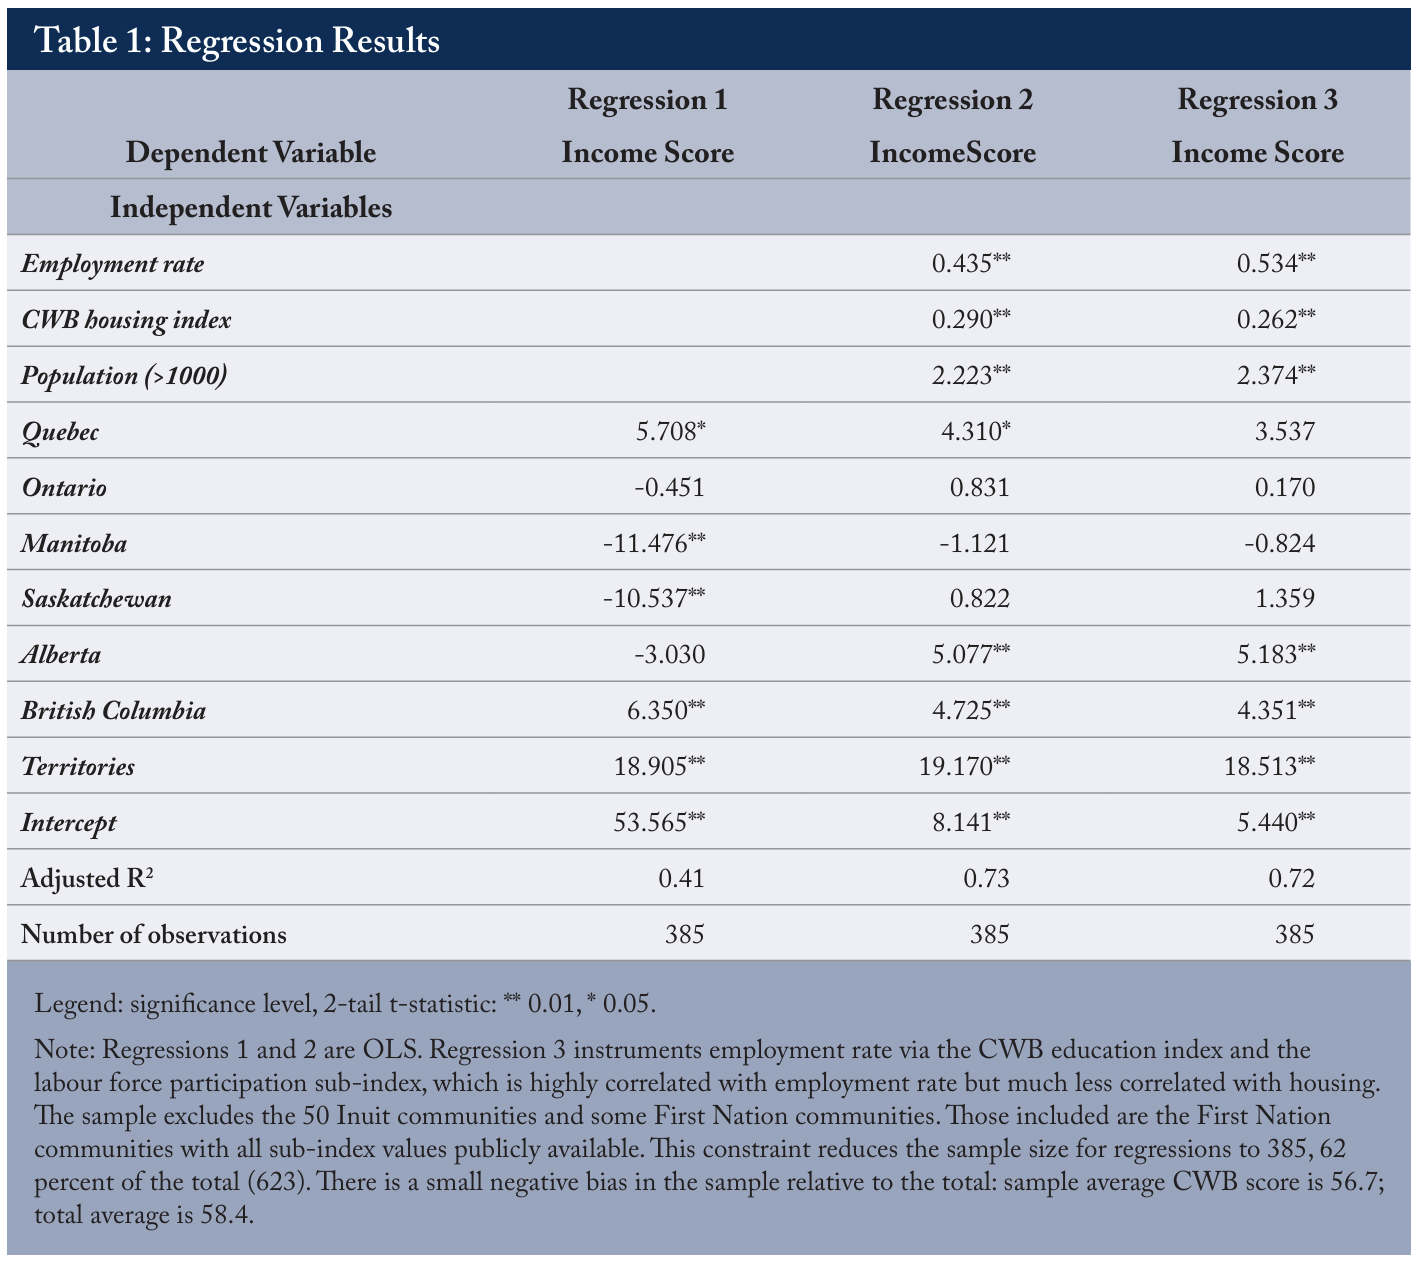
However, once we take into consideration community employment and housing (in regressions 2 and 3), the regional identifier coefficients for Manitoba and Saskatchewan become small and insignificant. In other words, low employment rates and poor housing quality in these two provinces are sufficient to explain their exceptionally low income scores revealed in regression 1. The Alberta coefficient changes from a statistically insignificant negative value in regression 1 to a statistically significant positive value. To be precise, controlling for employment and housing, regressions 2 and 3 imply that expected Alberta First Nation incomes are higher than in Atlantic Canada. Finally, the results are consistent with the argument that larger communities achieve (somewhat) higher income scores.
This brings us back to the question of what determines employment rates. There is a strong presumption that education levels matter. Higher education levels enable workers to command higher wages, which increase the reward from employment and the willingness to seek a job. Also, higher education levels increase the gap between employment earnings and transfer income available on-reserve. The size of this gap presumably has an impact on the employment rate. In the latest Census, all identity groups – non-Indigenous, Métis, First Nation off-reserve, First Nation on-reserve – experienced an increase of at least 20 percentage points between those with and without high-school certification. With post-secondary certification or university degrees, employment rates for all groups are higher yet, but the major jump in employment is associated with high-school completion (Richards 2018,10-11).
Many factors other than education underlie employment rates – in particular, distance of a First Nation community from an urban labour market. Those living in decent housing may be better able to seek and maintain a job. Hence, the housing index appears to be a relevant factor in explaining the employment rate. Finally, in the spirit of Flanagan’s analysis, the housing index may be a proxy for the role of overall community governance in promoting employment.
Policy Implications
Well-governed First Nation communities with access to business opportunities – for example, those with treaty rights relevant to development of resource projects – are realizing employment benefits and higher CWB scores (Aragon 2015; Flanagan 2019a). However, such communities are the minority. Simple regressions based on CWB data highlight, once again, the important role of employment as a key determinant of community income levels. In turn, education is a key determinant of employment. The severe problems of remote First Nations communities with low employment rates exist throughout Canada, but are most evident in the Prairie provinces.
Doubtless, affirmation of treaties and Indigenous culture over the last quarter century has been valuable. Doubtless, more can be done by federal and provincial governments in assuring Indigenous employment options in private resource developments and government infrastructure projects across northern Canada. There is also some potential to decentralize government offices to northern regions. That said, for many living in First Nation communities with a low CWB score, out-migration is a reasonable choice – vis. the 2001-2016 migration trend. However, without at least high-school certification, employment and income options are limited both on- and off-reserve. From an intergenerational perspective, better K-12 school outcomes are essential – as is post-secondary training.
Those who definitely want to live in remote communities should be able to do so with reasonable employment prospects. For that to happen, successful out-migration must become more feasible for those wanting to “go to town.” At present, those living in First Nation communities with weak education outcomes face limited employment options – whether in their community or “in town.” There must be no illusions: realizing significant improvements in education outcomes among First Nation communities with low CWB scores poses many obstacles.
First is the presence of First Nation mistrust of government interventions intended to improve on-reserve education. Much of this mistrust lies in the abuses associated with residential schools. A decade ago, the federal government and Shawn Atleo, at the time national chief of the Assembly of First Nations, led an ambitious initiative to increase federal funding of reserve schools and simultaneously improve on-reserve school management. The initiative foundered on accusations of “neocolonial” federal intervention.1111 I co-authored in 2012 the initial consulting report on details of the intervention. The report formed the basis of legislation, which was tabled in Parliament but not enacted. For a brief description of the initiative and accompanying legislation, see Anderson and Richards (2016, Appendix A). Those who share this mistrust must acknowledge a dilemma: there is little expertise in either Indigenous Services Canada or among most band councilors in the administrative requirements of good schools. Since the expertise in running schools lies primarily in provincial education ministries, inevitably they must be involved.
Due to scale economies, it is exceedingly expensive (on a per-student basis) to organize secondary schools on-reserve. Scale economies are readily visible at the secondary school level, where subject specialties require larger staffs that are efficient only with enough students to fill each class. Small, widely scattered secondary schools are unlikely to offer enough course variety to meet the needs of all students. This leads to high dropout rates. Hence, most children living on-reserve receive secondary education in a provincial school. High-school graduation for on-reserve children requires a high level of administrative cooperation between reserve schools and nearby provincial schools. Among the provinces with large First Nation populations, BC has indisputably been the most successful over the last quarter century in achieving high-school certification among young adults living on-reserve (Richards, Mahboubi 2018).
Second is the need to organize reform while respecting First Nations cultural traditions. First Nations have a constitutional right to organize schools for their children, and most on-reserve children attend an on-reserve primary school under band control. Successful pedagogy in reserve schools should not set low standards for core subjects (reading, math, science), but it must make major adjustments relative to pedagogy in a typical provincial school (Waubageshig [McCue] 2016).
Third, there is a lack of low-stake assessments of student performance in core subjects among students in on-reserve schools. What assessments do exist often reveal disappointing results. Anderson and Richards (2016) cite evidence on reading assessments in BC reserve schools over the K-12 cycle. The share of children reading “at grade level” declines from approximately 50 percent in early primary to 20 percent by Grade 8.1212 Mahboubi and Busby (2017) calculate the gaps between Indigenous and non-Indigenous in the Canadian sample of the OECD study of adult competencies in literacy, numeracy, and technology skills. Adjusted for highest education level, the gaps are statistically significant for those with incomplete high school, high-school completion, and college level. Only among those with university degrees is the gap statistically insignificant. Admittedly, the size of gaps declines at higher education levels. Similar declines have been found in reserve schools elsewhere.
Fourth, realizing significant improvements will be expensive. Among the most promising initiatives in improving education outcomes among secondary students at high risk of dropout has been Pathways, an NGO that combines extensive tutoring and mentoring of students living in selected low-income urban neighbourhoods. The annual cost per student is approximately $5,000. Pathways organized its original project in a public housing project in Toronto. The evaluation of Pathways by Oreopoulus and colleagues (2015) addressed the self-selection bias in such projects – the difficulty in measuring whether success is due to the initiative or to supportive families whose children are likely to graduate with or without special support.
A final observation: there is no silver bullet to resolve the social problems prevalent in First Nation communities with low CWB scores. Addressing the problems over the next generation will require recognition of First Nation treaty claims over resource-related employment and income, competent First Nation governance of local services, acceptance of out-migration as part of the solution – and higher quality schools.
Appendix
The CWB is an index (range 0 – 100). It is constructed as a sum of four equally weighted sub-indices: education, income, housing quality, labour force activity, each of which also has a range 0 – 100. These first-order subindices are in turn constructed from transformation of data and/or combinations of second-order sub-indices (range 0 – 100).
- Education sub-index This sub-index is the weighted sum of two second-order indices:
- High-school certification: The percentage of a community’s population, ages 20 years and above, that has obtained at least a high-school certificate, and
- University degree: The percentage, aged 25 and above, that has obtained a university degree at the bachelor’s level or higher.
The education sub-index accords two-thirds weight to high-school certification and one-third to university degree:
Education = [2 * high-school certification + university degree] / 3
- Income sub-index
This index involves a logarithmic transformation of the Statistics Canada estimate of average per capita income, which is subject to an upper bound of $75,000 and lower bound of $2,650. The implication of the log transformation is that increases in per capita income have a declining impact on the value of this index as the average increases. The upper bound of the sub-index, for a community with per capita income at or above $75,000 is 100. The lower bound is 0, for a community with per capita income deemed to be $2,650.Income = 100 * {[log(community per capita income) – log(2650)] / [log(75000) – log(2650)]}
- Housing sub-index
The housing sub-index is the average of two second-order sub-indices:- housing quantity: the percentage of the population living in dwellings that contain no more than one person per room. The ratio of persons to rooms is calculated by dividing the number of household members by the number of rooms in the dwelling they occupy.
- housing quality: the percentage of the population living in dwellings not in need of major repairs.
The housing index is the average of the above second-order indices:
Housing = [housing quantity + housing quality] / 2
- Labour force activity sub-index
This index is the average of two second-order sub-indices:- labour force participation: The percentage of the population, ages 20-64, involved in the labour force during the week preceding Census day in 2016 – either as employed persons or unemployed persons seeking employment.
- CWB employment rate: percentage of labour force participants, ages 20-64, employed during the week preceding Census day.
The labour force activity index is the average of the above two second-order indices:
Labour force activity = [labour force participation + CWB employment rate] / 2
For analysis in this E-Brief, I have redefined the labour force sub-index of the CWB: the labour force sub-index becomes simply the employment rate, defined in a manner similar to that used by the Statistics Canada Census.
The CWB definition of the labour force activity index is questionable on two grounds. First, the CWB definition of employment rate differs considerably from that employed in the Census (“The employment rate refers to the number of persons employed in the week prior to Census Day expressed as a percentage of the total population ages 15 years and over”). The denominator in the Census definition is the total population, not the population in the labour force. Second, in communities disproportionately reliant on seasonal or casual employment, the meaning of unemployed person becomes more ambiguous than in urban labour markets. Nominally unemployed persons may be relying on conditional transfers (such as employment insurance) but may not be actively seeking employment. To avoid the ambiguities of interpreting unemployment, measuring labour force activity via employment rate is preferable.
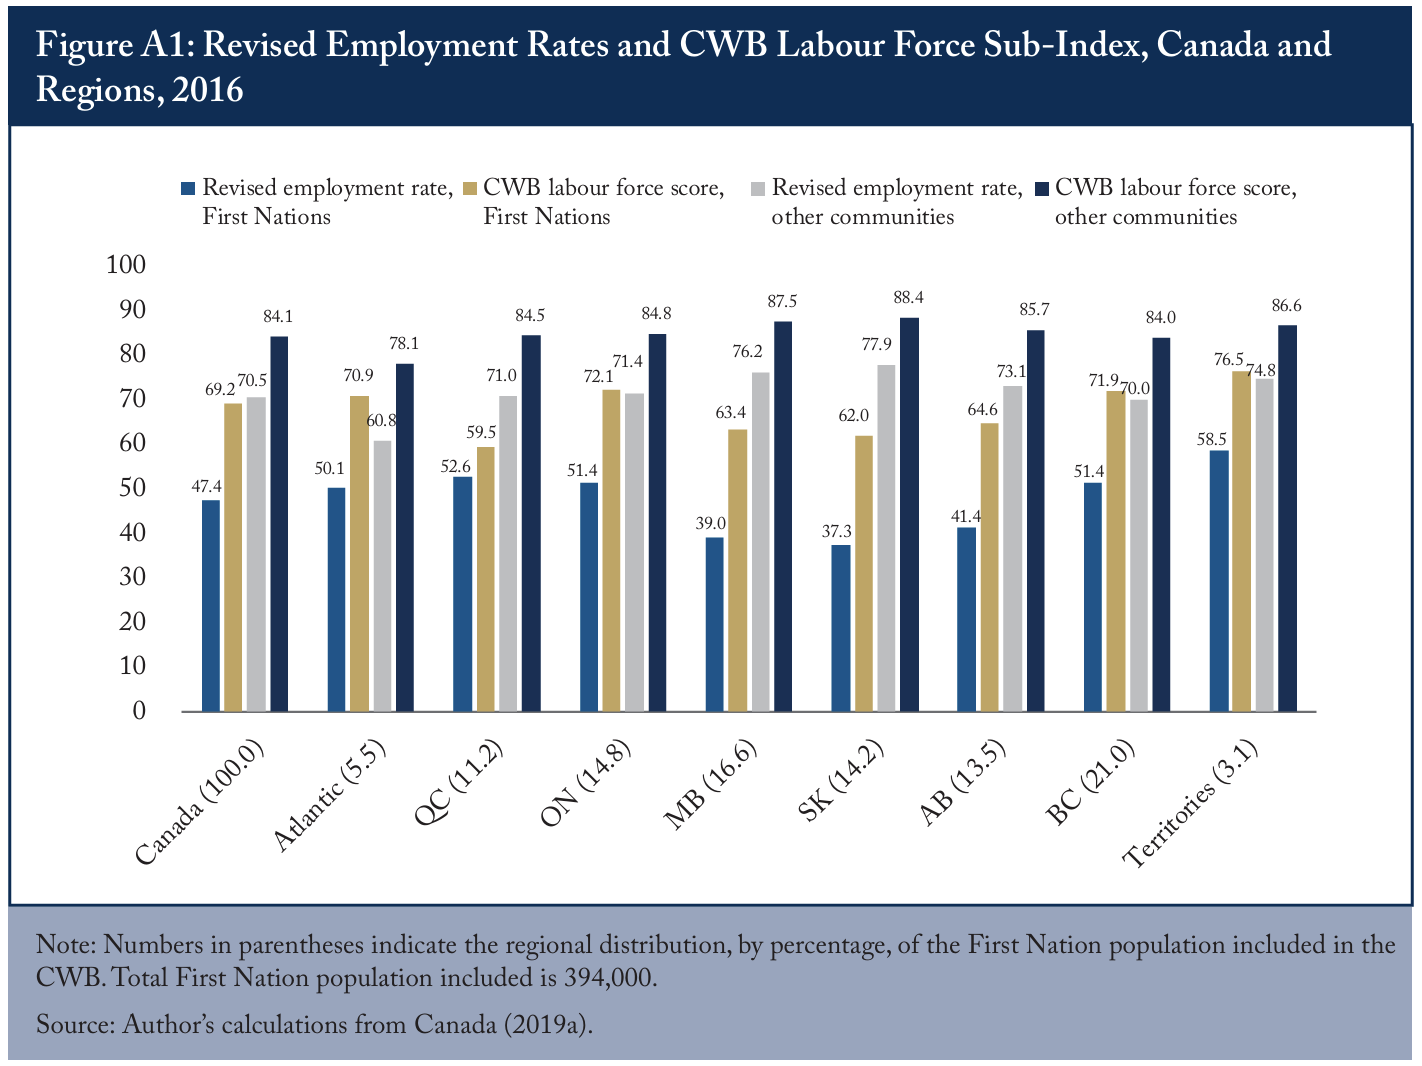
Census data are publicly available at the CWB community level for the labour force participation rate and CWB definition of employment rate for ages 25-64 (not ages 20-64 as reported in the online data release). In the regressions reported in the monograph, employment rate is defined, for population ages 25-64, as the CWB definition of employment rate multiplied by the percentage of persons in the labour force.
Employment rate, revised = [employed / labour force] * [labour force / population]
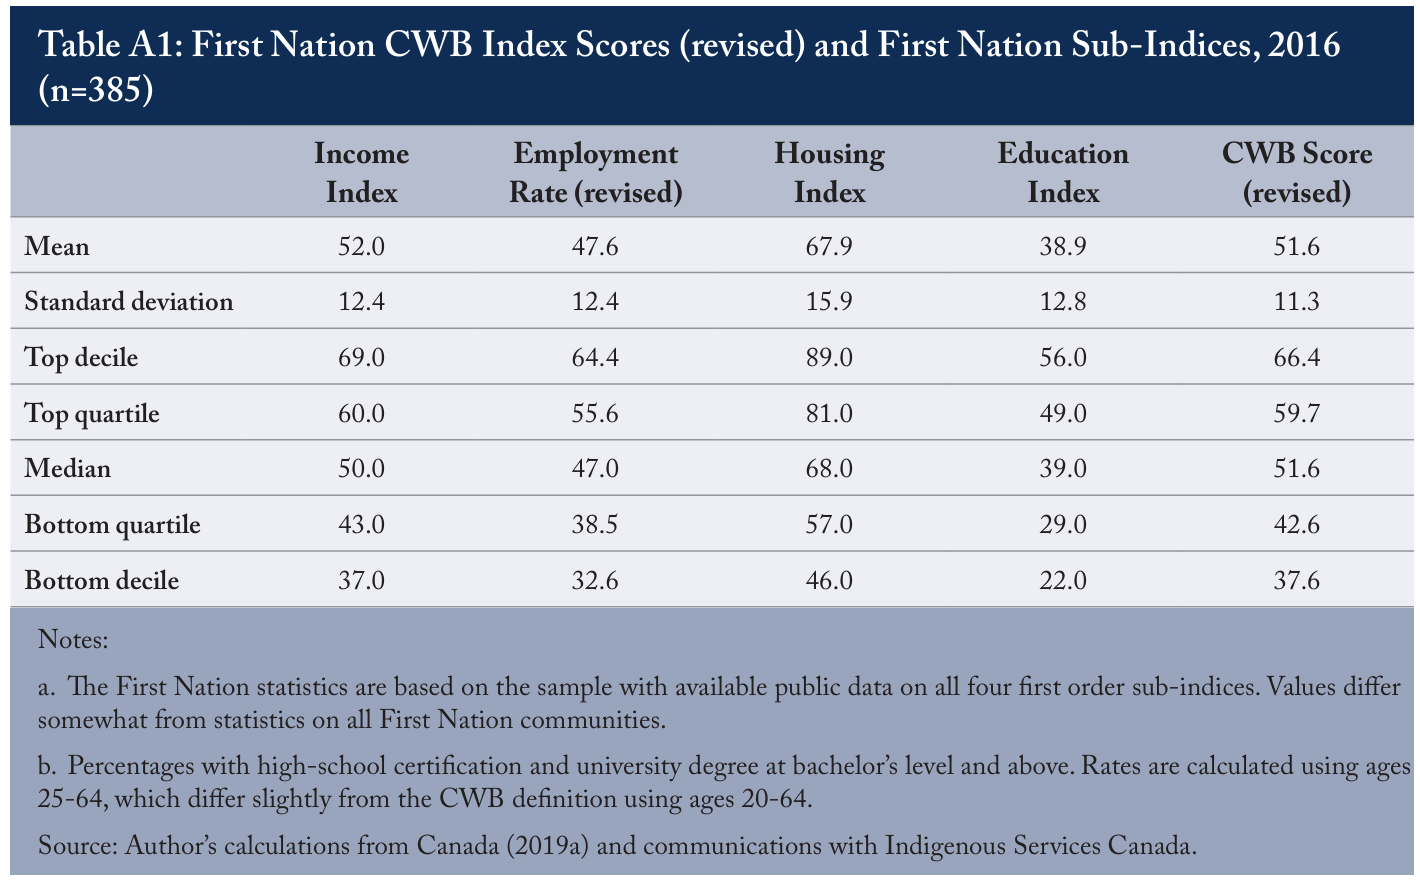
Table A1 shows selected statistics of the sample CWB scores, and sub-index scores calculated from publicly available data. The sample is based on the 385 communities for which all four sub-indices are publicly available. The labour force sub-index has been revised as the employment rate over the population ages 25-64. (This range deviates from the CWB rate based on ages 20-64.)
References
Anderson, B., J. Richards. 2016. Students in Jeopardy: An Agenda for Improving Results in Band-Operated Schools. Commentary 444. Toronto: C.D. Howe Institute.
Aragon, F. 2015. The Effect of First Nations Modern Treaties on Local Income. E-Brief 218. Toronto: C.D. Howe Institute.
Autor, D., D. Dorn, and G. Hanson. 2018. “When Work Disappears: Manufacturing Decline and the Falling Marriage Value of Young Men.” National Bureau of Economic Research.
Beattie, S., J-D David, and J. Roy. 2018. Homicide in Canada, 2017. Catalogue no. 85-002-X. Statistics Canada.
Brunet, S. 2019. The Transition from School to Work: The NEET Indicator for 20- to 24-year olds in Canada. Catalogue no. 81-599-X. Statistics Canada.
Canada. 1996. People to People, Nation to Nation: Highlights from the Report of the Royal Commission on Aboriginal Peoples. Ottawa: Royal Commission on Aboriginal Peoples.
_______. 2019a. The Community Well-Being Index. 20190615 accessed at https://www.sac-isc.gc.ca/eng/1100100016579/1557319653695
_______. 2019b. “Employed Person.” Dictionary, Census of Population, 2016. 20190710 accessed at https://www12.statcan.gc.ca/census-recensement/2016/ref/dict/pop028-eng.cfm.
Case, A., and A. Deaton. 2020. Deaths of Despair and the Future of Capitalism. Princeton University Press.
Environics Institute. 2010. Urban Aboriginal Peoples Study. Available at https://www.uaps.ca/knowledge/reports/
First Nations Information Governance Centre (FNIGC). 2018. National Report of the First Nations Regional Health Survey. Phase 3: Volume 1.
Flanagan, T. 2019a. The Wealth of First Nations. Vancouver: Fraser Institute.
_______. 2019b. “Why Some First Nations are gaining ground while others are losing.” Globe and Mail. December.
Graham, J. 2012. “Dysfunctional Governance: Eleven Barriers to Progress Among Canada’s First Nations.” Inroads 31:31-46.
Johnson, H. 2016. Firewater: How Alcohol is Killing My People (and Yours). University of Regina Press.
Mahboubi, Parisa, and Colin Busby. 2017. “Closing the Divide: Progress and Challenges in Adult Skills Development among Indigenous Peoples.” E-Brief 264. Toronto: C.D. Howe Institute.
Murray, C. 2012. Coming Apart: The State of White America, 1960-2010. Crown Publisher.
Oreopoulos, P., R. Brown and A. Lavecchia. 2015. “Evaluating Student Performance in Pathways to Education.” E-Brief 203. Toronto: C.D. Howe Institute.
Putnam, R. 2015. Our Kids: The American Dream in Crisis. New York: Simon and Schuster.
Richards, J. 2018. Pursuing Reconciliation: The Case for an Off-Reserve Urban Agenda. Commentary 526. Toronto: C.D. Howe Institute.
Stanton, E. 2007. “The Human Development Index: A History.” Working paper 127. Political Economy Research Institute, University of Massachusetts.
United Nations. 2019. “Human Development Index: 2018 statistical updates.” 2019/07/12 accessed at http://hdr.undp.org/en/2018-update
Waubageshig. 2016. “First Nations Elementary-Secondary Education: A National Dilemma.” Verbatim. Toronto: C.D. Howe Institute.
Wilson, W.J. 1996. When Work Disappears: The World of the New Urban Poor. New York: Vintage.