


The Clawback Trap: How Canada’s Benefit System Can Undermine Work and Saving
by Alexandre Laurin and Nicholas Dahir
- Clawbacks of government benefits can create high marginal effective tax rates (METRs) on extra income, or high participation tax rates (PTRs) on prospective income from taking on a job, that have a negative impact on work incentives particularly for low-to-middle income benefit recipients.
- As personal incomes rise above prescribed thresholds, income taxes rise and income-tested benefits paid by governments are reduced (or clawed back) at various rates. Because tax and clawback provisions overlap, their impact on take-home pay can be substantial, making it tough to get ahead for lower-income families wanting extra income, stay-at-home parents looking for work, or seniors looking to supplement their retirement income.
- METRs on each extra dollar of income for a working family with two children generally exceed 50 percent in most provinces on family employment income from between about $45,000 to $65,000. For seniors, METRs can exceed 75 percent on employment income, from about $13,000 to $24,000.
- Any further expansion of the targeted transfer system – through larger low-income supplements or the creation of new targeted family benefits, for example – should be approached with a broader analysis of the impact on work decisions. Income-averaging provisions for highly fluctuating incomes could be explored, as well as other factors in family paid work decisions such as childcare.
The authors extend gratitude to Luc Godbout, Jamie Golombek, John Lester, Daniel Schwanen, and several anonymous referees for valuable comments and suggestions. The authors retain responsibility for any errors and the views expressed.
Introduction
The incomes of Canadian families affect their taxes in two ways: the more they make, the more tax they may owe, and the more they make, the less they may receive in income-tested cash benefits.
Income-tested benefits are government payments to individuals. The largest are payments to seniors and benefits to families with children. Child benefits play an important role in reducing child poverty by providing substantial income support to low-income families. For example, in 2024, a low-income family of four with two young children in Ontario stood to receive about $20,000 in federal and provincial child and family benefits.1Calculated using the Canada Revenue Agency’s (CRA’s) online “Child and family benefits calculator” for a family income of $30,000, accessed August 2025. A low-income senior in Ontario could receive over $23,000 in federal and provincial seniors’ benefits.2Calculated using the schedule of Ontario GAINS benefits rates for a single pensioner under the age of 75 without private income, accessed August 2025. Benefits include GAINS, OAS and GIS. To these amounts, we can add other benefits – such as the Goods and Services Tax (GST) credit, the Canada Workers Benefit, and similar provincial programs.
These benefits are income-tested to support people with lower incomes, and thus can also play a role in mitigating the regressive impact of consumption taxes and other features of the tax system that are considered to affect those with lower incomes disproportionately.
Governments must balance redistributive objectives with the effects of these tax benefits on the public purse. As individuals and families earn more taxable income, income-tested benefit entitlements are reduced (or “clawed back”) at various phase-out rates, which reduces their overall cost for governments and ensures that they remain targeted to the intended lower-income families. Benefit reductions, however, act like hidden tax rates: they reduce the effective gain from working to generate additional income. They may reduce the incentives to save for retirement as well, especially for lower-income individuals with tax-deferred accounts like RRSPs. To determine the tax system’s full impact on financial gain from work, the combined effect of both taxes paid and reduced cash benefits must be taken into account.
This Commentary updates and extends the analysis in prior C.D. Howe Institute publications.3This Commentary builds on and updates a previous C.D. Howe Institute report (Laurin and Dahir 2022), which in turn updated similar studies on personal effective tax rates from earlier years. It enables comparisons of estimated effective tax rates on personal earnings for families with children, for seniors contemplating work, and for single working persons.4Tax estimates in this study are computed using Statistics Canada’s tax and benefit microsimulation tool, the Social Policy Simulation Database and Model (SPSD/M), v. 30.3. Responsibility for the simulation results presented and their interpretation lies with the authors. The federal carbon rebate, the final payment of which was made starting in April 2025, is included in our 2025 calculations. Because it was eliminated partway through the year and is not income-tested, its impact on 2025 effective rates is minor. Similarly, in our 2025 calculations, the federal bottom marginal tax rate is set at 15 percent rather than the 14.5 percent proposed in Bill C-4 (which had not been enacted as of October 2025). This half-percentage-point difference would have only a minimal effect on the effective rates presented in this study. In particular, the analysis is extended to examine the effective tax rates faced by single seniors on their pension and employment incomes.
“Effective” tax rates are computed by adding the amount of lost cash benefits to income taxes and payroll contributions paid, divided by gross earnings.5In other words, effective tax rates comprise statutory income tax (federal and provincial), payroll and other tax contributions, plus the effect of tax-back or phase-out rates for each benefit program that the household is eligible to receive. Effective tax rates computed here do not take into account social assistance and other income-tested government assistance programs delivered outside the tax system. Adding these programs would worsen work disincentives at very low income levels. On the other hand, payroll contributions to social security programs – for example, Quebec’s parental insurance plan, employment insurance and the Canada Pension Plan – included in the tax computations might match expected eventual direct benefits, possibly reducing their effect on work incentives. These effective rates play a key role in work decisions by reducing the monetary reward of earned income.
The “marginal effective tax rate” (METR) measures the loss from additional taxes and benefit reductions on each extra dollar of earnings. For workers, it reflects the financial penalty on any small increase in income, while for pensioners, it represents the loss on each additional dollar of retirement income from pensions or tax-deferred withdrawals.
The “participation tax rate” (PTR) is the cumulative effect of all income taxes, other contributions, payroll deductions and loss of cash benefits on the person’s total annual earnings from prospective work. For a stay-at-home parent or a senior contemplating getting a job, it represents the financial penalty that must be paid out of the total income derived from new paid employment.
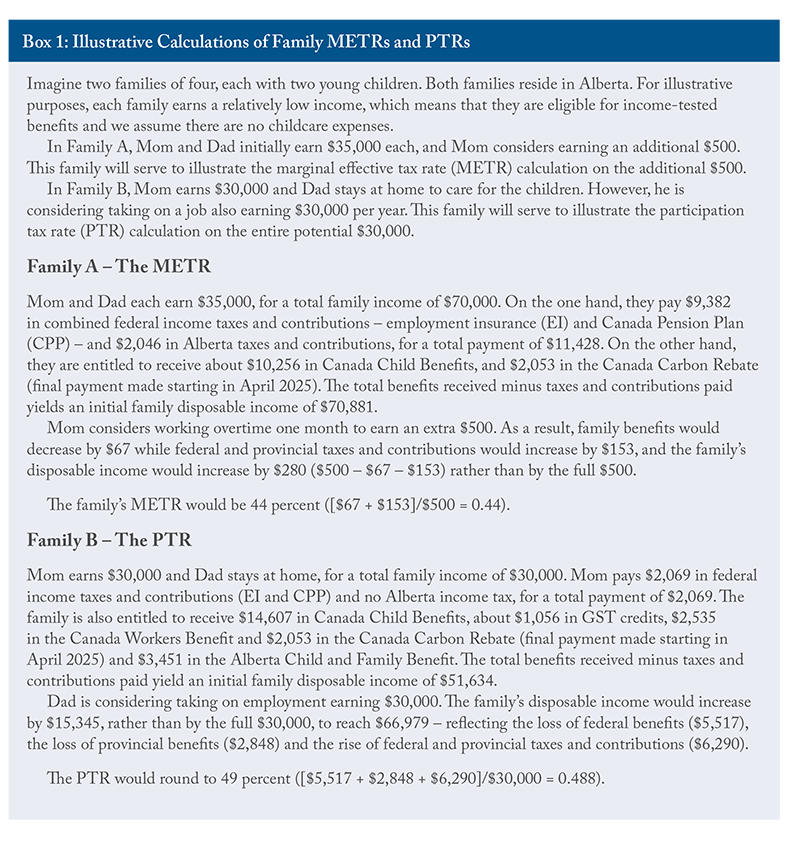
Box 1 tells the tale of two illustrative families to present the mechanics behind METR and PTR calculations.
Why Do Effective Tax Rates Matter?
Many studies have found a statistical relationship between work hours and high effective tax rates – in particular, those high rates have a negative impact on work incentives for mothers of young children, lower-skilled workers, and seniors nearing retirement.6For reviews of the literature on the relationship between wage earnings, taxation and employment, see: Bargain, Orsini, and Peichl (2013); Bocconi University (2011); Fortin and Lacroix (2002); and Meghir and Phillips (2010). There is a wide range of empirical results, which vary by subgroups studied, margin of response (participation versus additional work) and empirical methods. Ohanian, Raffo, and Rogerson (2007) find a very strong statistical link between hours of work and labour taxes across member countries of the Organisation for Economic Co-operation and Development. Causa (2009) finds a significant tax-induced labour-supply response for women, but not for men.
Empirical studies estimate that women and mothers, who are most often the secondary earners in a family, are more responsive to wage and tax-rate variations than male primary earners. This is especially true for the decision of whether to take on paid work at all, which has been found to be quite sensitive to taxation and cash benefits for married women in particular. Causa (2009) and Kalyva et al. (2018) find that the effect of taxation on labour supply is in general stronger for low-skilled women and for those with young children. Dudu et al. (2021) found a significant work-hour response to an increase in the level of the Canada Child Benefit in 2016. This means that high METRs or PTRs for a child-caring spouse are likely to affect the incentive to work longer hours, to seek part-time work or to re-enter the workforce. This leads to fewer paid work hours than people might otherwise choose.
In general, lower-income, less educated people have a greater tendency to adjust their paid work behaviour through workforce participation decisions, while more educated workers tend to adjust through the number of hours they work. Older workers nearing retirement are also more significantly affected by the tax and transfer system (Blundell 2013, Duclos et al. 2014). Studying the introduction of pension income splitting in Canada, Messacar (2022) finds that older Canadian workers respond meaningfully to tax changes.
Although there is no real consensus in the literature, in general the evidence points to insignificant work responses to tax changes for mid-career primary-earner men with strong workforce attachment and, if positive, the response to lower taxes tends to be low on average (Meghir and Phillips 2010). However, Keane (2011) highlights that even small short-term effects can lead to substantial long-term consequences by limiting opportunities to accumulate experience and develop skills. The resulting drag on productivity and wages means the long-term economic impact can far exceed the initial short-term effects.
Beyond labour responses, high marginal tax rates can encourage both legal tax planning and illegal tax evasion, such as under-reporting income earned under the table or hidden in low-tax jurisdictions. These avoidance opportunities are generally more accessible to higher-income individuals, and studies consistently find that tax planning responses rise sharply with income (Milligan and Smart 2014).
Other non-tax costs such as transportation and childcare may also greatly influence work decisions. In particular, the subsidization of childcare expenses increases parental (primarily maternal) workforce participation. Indeed, many Organisation for Economic Co-operation and Development (OECD) countries’ tax and transfer systems subsidize childcare, and the OECD calculates a PTR estimate inclusive of childcare services as part of its work incentive indicators (OECD 2022).
Because taxes and benefit programs can interact to create potentially extraordinarily high effective tax rates, governments need to be mindful of not discouraging work among segments of the population sensitive to these rates, especially families with children eligible for generous child-related cash benefits and older workers eligible for income-tested senior benefits.
METRs for Parents of Young Children and Unattached Individuals
Consider three hypothetical scenarios for working age persons: 1) a four-person family with two young children, with both parents working and earning income, 2) a working single-parent with two young children, and 3) an employed, unattached single individual. Their METRs, which indicate how much of the extra income they can keep after deducting income taxes and the loss of cash benefits, will influence their work decisions.
Other than tax and benefit provisions, five main factors determine the METR and how much a family would lose in additional taxes and benefit reductions: the province of residence, the initial level of family income, the number of children, the number of earners in the family and how earnings are split among the earners. For illustrative simplicity, we assume in our dual-earner family scenario that each spouse contributes half of the family income.
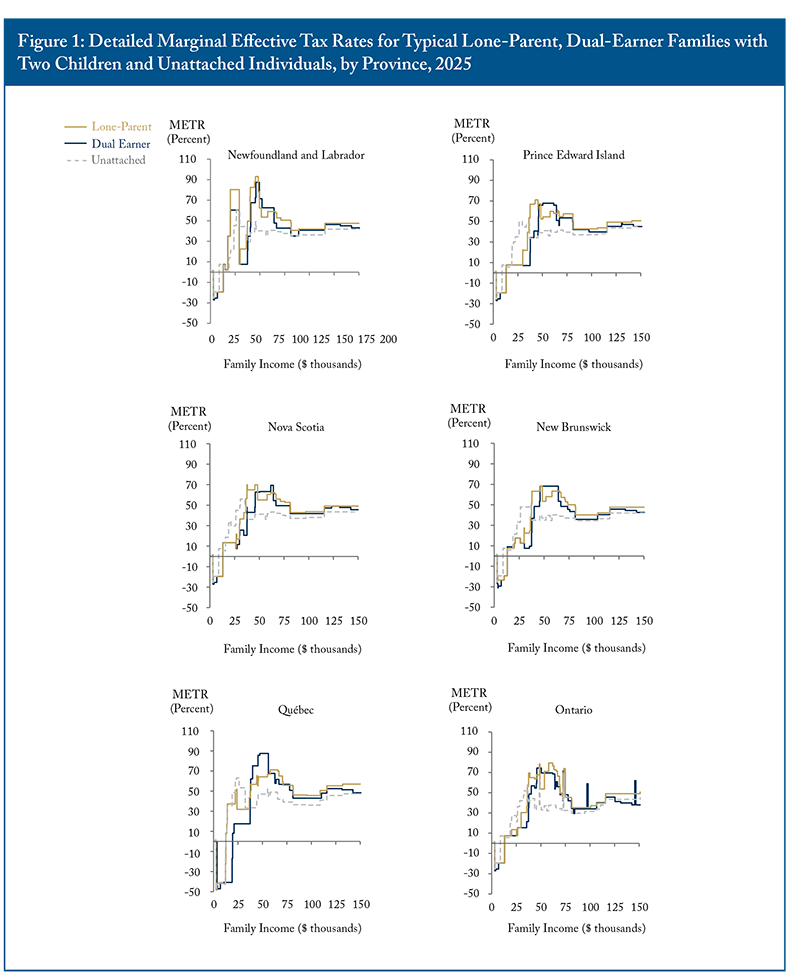
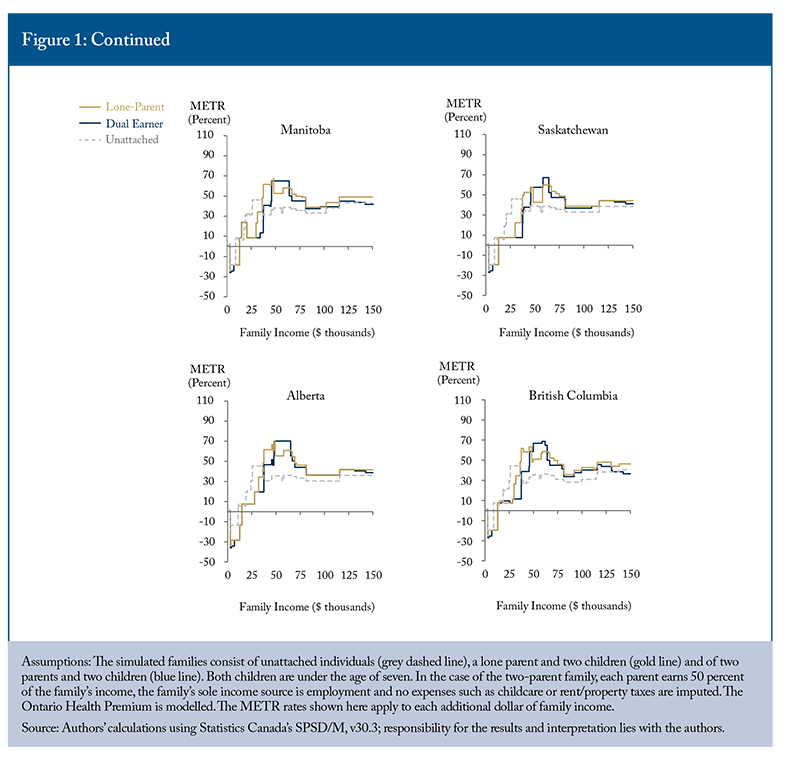
At very low family employment income levels – from about $3,000 to $13,000 ($9,000 for individuals) – the Canada Workers Benefit (CWB, renamed in 2019 from the Working Income Tax Benefit) rewards workers for taking on more work, resulting in a negative METR (Figure 1).7The CWB’s main purpose is to counter the “welfare wall” originating from the loss of social assistance and other welfare benefits as recipients return to work. Godbout and St-Cerny (2023) find that the enhancements of the CWB benefits have had an adverse effect on METRs, but have improved the incentive for secondary earners to participate in the labour market. For families with children, beyond the $37,000 mark for single parents and the $45,000 mark for dual parents, the CWB and most other federal and provincial refundable credits and income-tested benefits are reduced with each additional dollar of earnings. As a result, the METR rises quickly to levels approaching or exceeding 50 percent (see Figure 1). Beyond the $65,000 mark for single parents and the $80,000 mark for dual parents, the rates fall to the mid-40 percent range, then gradually rise again as the reduction of income-tested benefits is replaced by progressively higher statutory tax rates.
METRs are generally slightly higher for single-parent families, and the gap widens at higher income levels due to the individual tax unit and the progressivity of the tax system. Single individuals without children typically face higher METRs than parents before the $37,000 mark. Beyond this point, clawbacks of child-related benefits result in METRs for parents quickly surpassing those of unattached individuals.
Since childless individuals are not subject to clawbacks on child-related benefits, their METRs rarely exceed 50 percent. Around the $28,000 mark, METRs for these individuals rise above 40 percent. Beyond $36,000, they typically fall to the low 30s, then gradually increase again as reductions in income-tested benefits give way to higher statutory tax rates. At higher income levels, METRs for unattached individuals surpass those of two-parent families, but remain below those of single-parent families facing child-related benefit reductions.
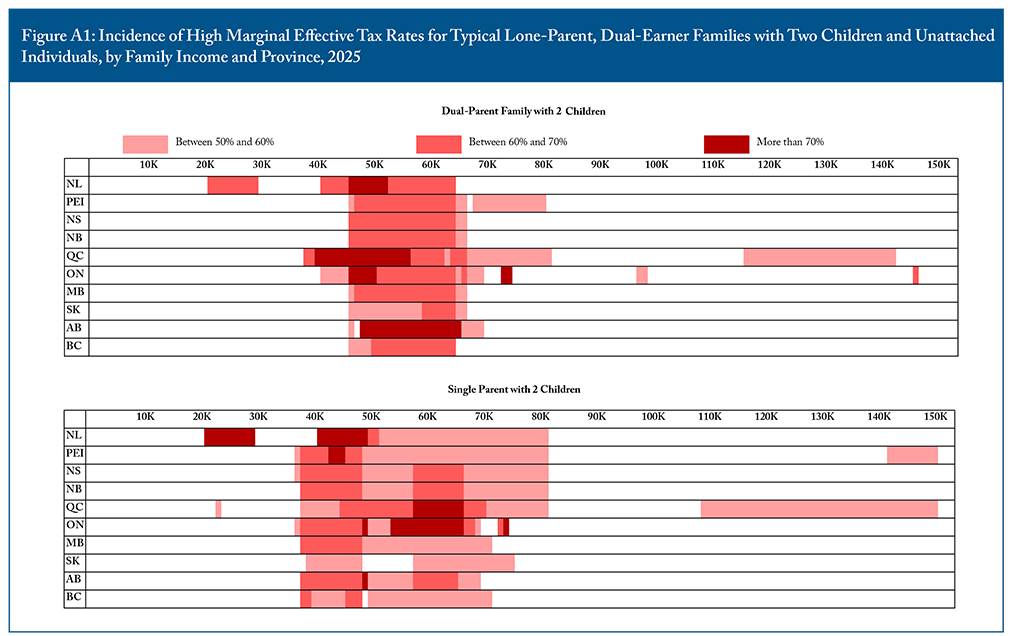
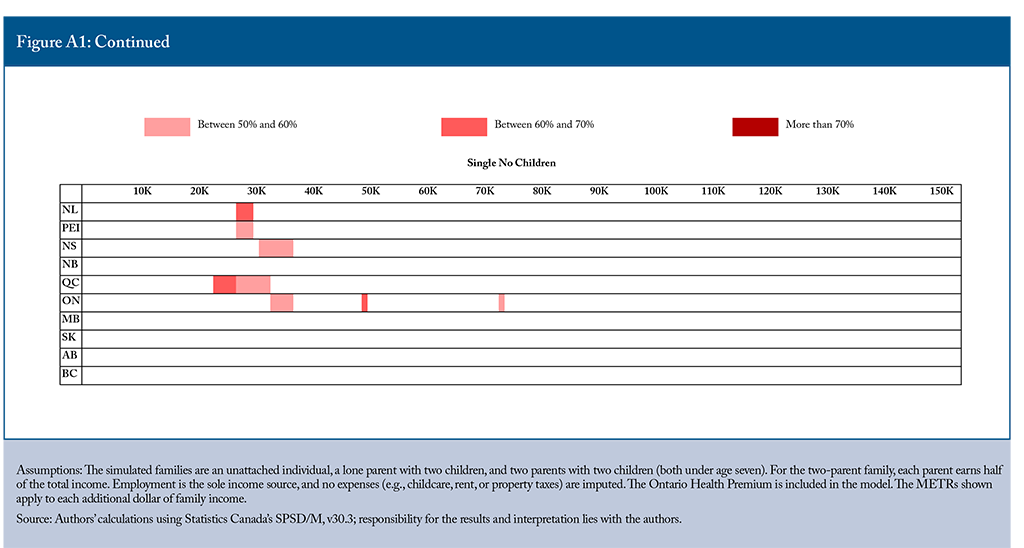
The Appendix provides a visual representation of where typical families face very high METRs across the income distribution. Unlike the multiple-line charts in Figure 1, these incidence charts filter out much of the visual noise and make it easier to see where METRs are exceptionally high. In all provinces, dual-parent families with two children generally experience METRs between 60 and 70 percent at incomes ranging from about $45,000 to $65,000. In Alberta, METRs exceed 70 percent through much of this range. The span of high METRs (above 50 percent) is broader in Ontario and Prince Edward Island, but Quebec stands out: METRs for dual-parent families exceed 50 percent from roughly $38,000 to $80,000 of family income, and again from about $115,000 to $140,000.
High METRs are also common for single-parent families with two children. In the provinces east of Ontario, METRs typically exceed 50 percent from $38,000 to $80,000 of income, and up to around $70,000 elsewhere. Quebec again stands out, with METRs above 50 percent even at higher income levels, roughly from $115,000 to $150,000. By contrast, METRs for childless individuals are rarely unusually high.
METRs generally peak at family incomes around the $40,000 to $50,000 mark. In Ontario, the family METR on extra employment income peaks at 74 percent for two-child, two-parent families and at 79 percent for single-parent families. In Quebec, it peaks at 88 and 71 percent, respectively. In other provinces, it tends to peak at around 60 to 70 percent.8Ignoring occasional mechanical METR spikes that arise from the design of certain programs, which trigger a sudden rather than gradual reduction in benefits once income crosses a specific threshold, causing METRs to rise and then fall abruptly over a narrow income range. METRs reach their peak at relatively
low levels of family income for two-parent families and at more moderate income levels for single-parent families.
For unattached individuals, METRs typically peak at lower income levels – around $25,000 to $35,000 depending on the province – compared to families with children. In Quebec, the METR on additional income peaks at 63 percent, while in Ontario it peaks at 62 percent. In other provinces, peak METRs are generally in the 40 to 50 percent range.
METRs for Seniors
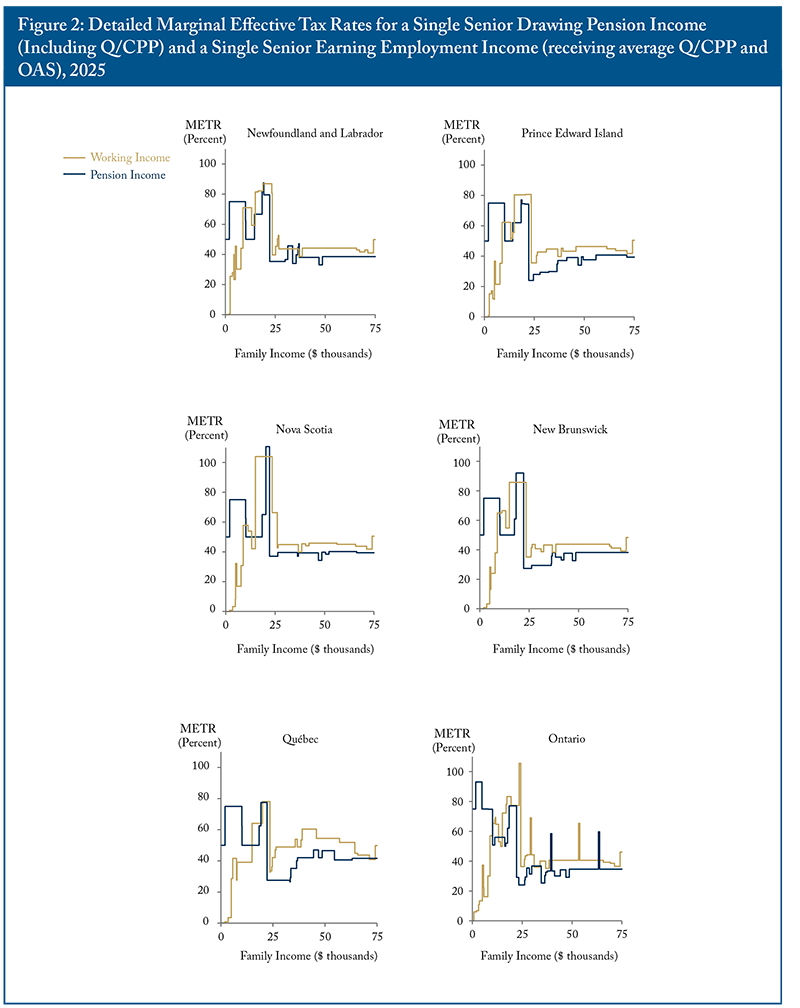
Next, we examine METRs for seniors receiving OAS and GIS benefits. Because these programs provide a basic income floor, they create a distinctive situation in which METRs are high from the very first dollar of taxable income. Seniors generally become eligible for age-related benefits delivered through or alongside the tax system at age 65. We consider two hypothetical scenarios: (1) a retired 65-year-old drawing taxable pension income (on top of basic OAS/GIS amounts), and (2) a 65-year-old receiving OAS/GIS and average Q/CPP9Employment and Social Development Canada publishes the average CPP payment for new beneficiaries. In this Commentary, we use the October 2024 average of $899.67/month, as it was the latest available at the time of writing. benefits while considering part-time work for a few more years.
Our analysis updates Laurin and Poschmann (2014) and confirms the same pattern across all provinces: low-income seniors face the highest effective tax rates, which then decline steadily as income rises into the middle and upper ranges. The primary driver of these high METRs is the aggressive phase-out of the GIS, a program playing a key role in reducing poverty among Canadian seniors over the past several decades. For single seniors drawing pension income, withdrawing from tax-deferred accounts, or earning taxable investment income, GIS is reduced by:
- 50 cents for every dollar (excluding Old Age Security) from $0 to approximately $2,000;
- 75 cents per dollar from about $2,000 to about $10,000;
- 50 cents per dollar from $10,000 to roughly $22,000.
- Seniors earning income from work benefit from reduced clawbacks on their initial earnings:
- the first $5,000 of employment or self-employment income is fully exempt from GIS clawbacks;
- the next $10,000 of such income is subject to only half the normal GIS reduction rate.
Additional federal and provincial income-tested supports – such as GIS top-ups, tax credits for sales, rent, or property taxes, and the non-refundable age credit – often phase out alongside the GIS. These overlapping clawbacks compound each other, creating extremely high METRs.
Across all provinces, seniors with modest taxable pension income (which includes Q/CPP in our calculations) on top of the OAS/GIS – up to about $22,000 – face some of the highest METRs, often exceeding 75 percent (see Figure 2).
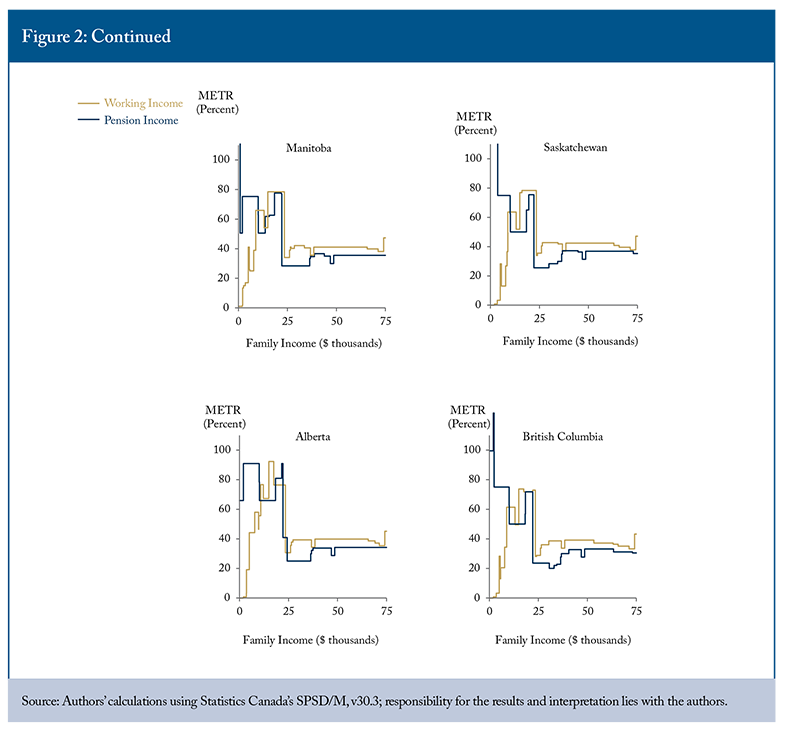
In some provinces, the combined effect of federal and provincial benefit reductions leads to METRs on pension income approaching or exceeding 100 percent in some narrow income ranges, effectively penalizing seniors for drawing additional tax-deferred retirement income. For example:
- in Saskatchewan, the phase-out of the provincial Seniors Income Plan, layered on top of the GIS clawback, results in a METR of over 145 percent on the first $2,000 of taxable income and over 218 percent on the next $1,580;
- in British Columbia, income-tested provincial GIS supplements push METRs to 100 percent on the first $2,000 of taxable income;
- in Alberta, the combined GIS and Seniors Benefit clawbacks result in a METR of 91 percent between approximately $2,000 and $9,000 in income.
The situation improves for seniors with employment income, as the first $5,000 of earnings are exempt from GIS clawbacks. Beyond this exemption, however, they may face METRs exceeding 50 percent on the next $10,000 of earnings, and approaching 95 percent or more in many provinces once clawbacks peak around the $20,000 income level.
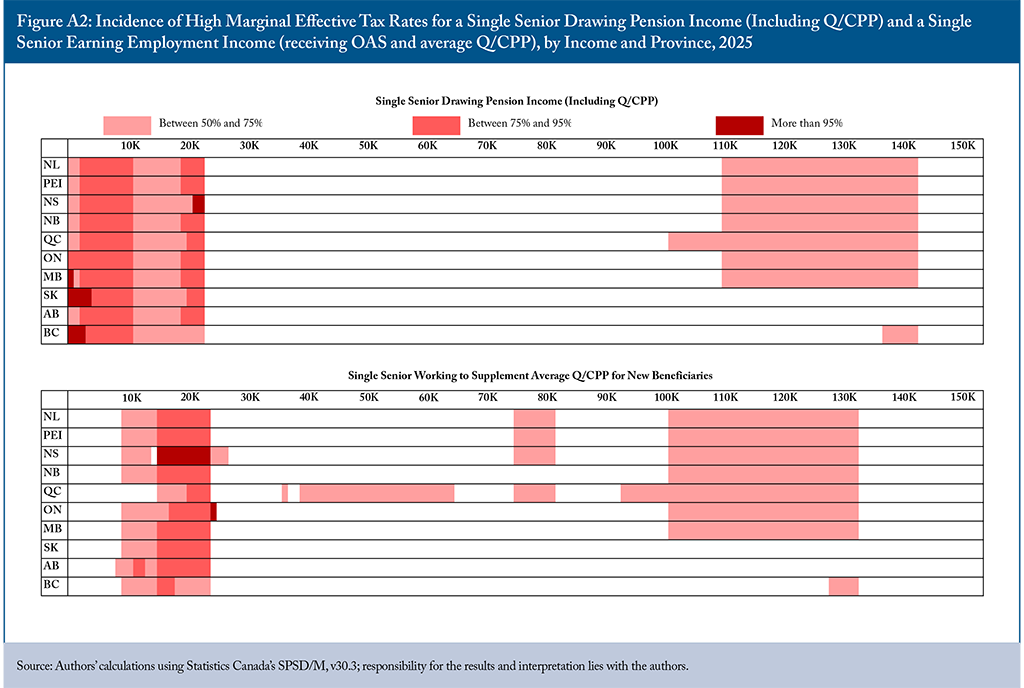
As with families with children, the Appendix illustrates the incidence of very high METRs across the income range. A few observations stand out. For seniors drawing taxable pension income (including Q/CPP benefits) in addition to GIS and OAS, GIS clawbacks are the main driver of high METRs, which drop below 50 percent in all provinces once the eligible GIS amount is fully phased out. At higher income levels, the phase-out of OAS, beginning at roughly $93,500 of individual net income, pushes METRs above 50 percent in most provinces.10Godbout and St-Cerny (2022) recommend an exemption on employment earnings from OAS clawbacks – similar to GIS treatment – to improve seniors’ incentives to work past 65.
For GIS-eligible seniors earning employment income to supplement average Q/CPP benefits, METRs are also very high at relatively low income levels. While the GIS earnings exemption softens the initial impact, METRs soon climb to punitive heights, between 75 and 95 percent, through the $15,000 to $22,000 employment income range. Once again, Quebec stands out in this chart, with METRs exceeding 50 percent over a broad span of employment income above $15,000.
Participation Tax Rates: Impact on Parents and Seniors Choosing to Work
For many workers, choosing how many hours to work is difficult. Jobs are typically offered with a fixed number of expected hours. In two-parent families with young children, the key labour supply decision for the second earner – often the mother – is whether to enter the workforce or stay home as a caregiver. The higher the participation tax rate (PTR) – the share of total earnings lost to taxes and reduced benefits – the weaker the incentive to work.
Among seniors eligible for the Guaranteed Income Supplement (GIS) and Old Age Security (OAS), taxes can similarly reduce the returns from continued work. A high PTR may discourage seniors from working at all, especially if they receive adequate income from Q/CPP, pension, and other sources.
Consider two hypothetical family types, illustrated in Figure 3.
1. A parent of two young children in a two-parent family, currently not employed, is contemplating entering the workforce.
2. A single senior is considering part-time work to supplement average public retirement benefits (OAS/GIS and Q/CPP).
How much of the earnings would the individual in each case retain after accounting for additional taxes and the reduction of income-tested benefits?
For families with children, the PTR depends on the incomes of both parents, since benefit entitlements are based on family income, and a few tax provisions (such as the spousal credit and the childcare deduction) depend on the secondary earner’s income. Beyond taxes, joining the labour force also brings other expenses such as transportation, work-related costs, and especially childcare that further diminish gains from earning. PTRs can be calculated both excluding and including net childcare costs (after accounting for the additional costs of paying for childcare and the reduction in tax liability from claiming the childcare deduction and provincial credits).
In the case of seniors, the GIS offers a limited exemption on employment income: the first $5,000 is fully exempt from benefit clawbacks, and half of the next $10,000 is also exempt. The PTR will depend on the senior’s total income, including Q/CPP, pensions, and investment income.
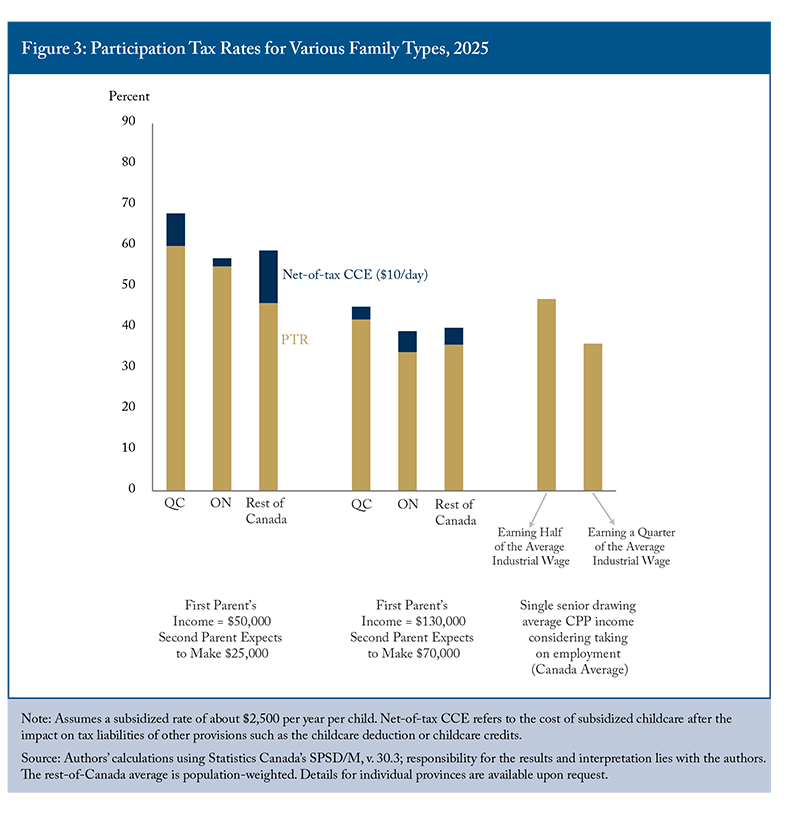
Figure 3 illustrates four sub-scenarios:
1. A family of four where one parent earns $50,000 and the other is considering a $25,000 job. This is roughly representative of dual-earner families with young children at the first quintile of the employment income distribution.
2. A higher-income family of four with one parent earning $130,000 and the second contemplating a $70,000 job. This is roughly representative of dual-earner families with young children at the third quintile of the employment income distribution.
3. A single senior receiving average Q/CPP benefits considering employment income of $32,850 (which is about half of the average industrial wage,11As defined by the EI maximum annual insurable earnings in 2025 ($65,700). Average employment income for seniors was $32,434 in 2023. Statistics Canada. Table 11-10-0039-01. roughly corresponding to the average work income of employed seniors).
4. The same single senior considering employment income of $16,425 (corresponding to a quarter of the average industrial wage).
In the first scenario, the second parent would face high PTRs.12Other studies, such as Robert-Angers et al. (2022), also find that income-tested children’s benefits contribute to high effective rates for secondary earners. On average across Canada, excluding Quebec and Ontario, a second earner moving from zero to $25,000 would face a PTR of 46 percent, driven primarily by the withdrawal of income-tested benefits. In Quebec, PTRs can reach 60 percent, the highest in the country. Ontario follows with PTRs around 55 percent. When factoring in after-tax subsidized childcare costs (we assume a subsidized $10/day per child in our scenarios13Laurin and Dahir (2022) examine the effect of subsidized childcare schemes in Ontario and Quebec on reducing PTRs.), PTRs exceed 59 percent on average.
In the second scenario, where the first parent makes $130,000 and the second contemplates earning $70,000, most income-tested benefits have already been phased out. The resulting PTRs are considerably lower: excluding Quebec and Ontario, the average is about 35 percent, with only about 6 percent of the second earner’s potential income lost to benefit clawbacks.
In the third scenario, where a single senior considers earning $32,850, the PTR is nearly 50 percent (47 percent). It improves in the fourth scenario, as the GIS clawback exemption applies to a larger share of the seniors’ earnings, resulting in a PTR of 36 percent. Interestingly, the PTR increases with higher income.
The Extent and Evolution of High METRs and PTRs
The scenarios above show the extent to which Canadian families and single seniors might be exposed to high marginal effective tax rates.14The 2022 Report on Federal Tax Expenditures presents a distributional analysis of personal METRs by age, family income, province, and full-time or part-time employment status (Department of Finance Canada 2023). But how typical are these scenarios?
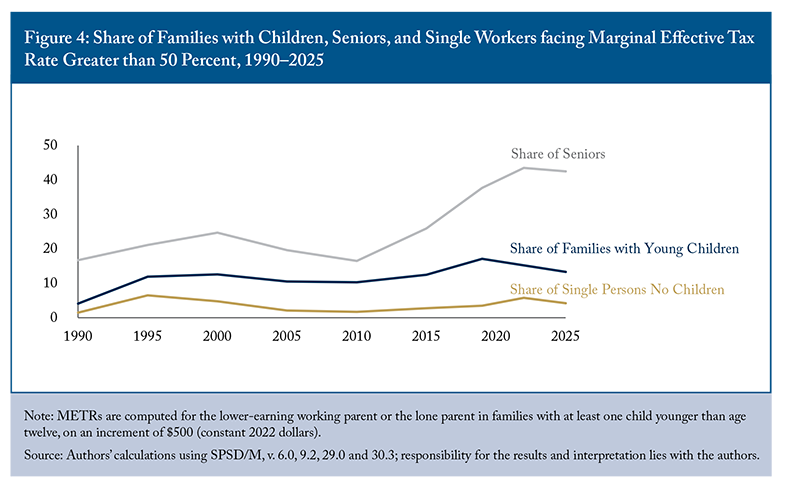
Of all working lone parents and secondary-earning parents (the lower-earning parent in a two-parent family) in 2025, 13 percent face a METR higher than 50 percent. This figure is much higher than the share of single persons with no kids facing such high METRs, since the loss of federal and provincial child benefits is the main driver of high METRs for families.
With respect to single seniors receiving pension income, as many as 42 percent face a METR higher than 50 percent on their pension income. This is because a large share of seniors have fixed incomes and lower earnings that are subject to the GIS clawback.
The share of parents facing very high METRs was much lower before the introduction of income-tested refundable child tax credits in the 1990s. It rose sharply between 2010 and 2019 – from about 10 to 17 percent of families – but then declined to 13 percent by 2025. Overall, from 1995 to 2025, the share fluctuated between 10 and 17 percent of families.
The share of seniors facing very high METRs on taxable pension income increased from less than 20 percent in 2010 to more than 40 percent currently. This increase is largely driven by the introduction of the GIS top-up in 2011, which was increased in 2016, and is clawed back at a rate of 25 percent for a combined 75 percent GIS clawback rate.
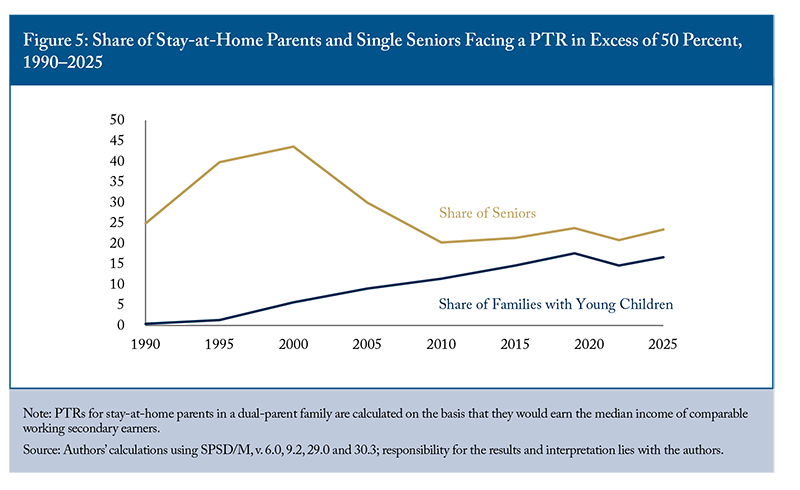
The share of stay-at-home parents (in two-parent families) facing PTRs greater than 50 percent, on the other hand, has increased gradually since 1995. In 1990, very few stay-at-home parents faced PTRs in excess of 50 percent. Since then, their share has increased to reach 17 percent of stay-at-home parents in 2025 (Figure 4). For seniors looking to earn income from employment, the share facing a PTR greater than 50 percent fell in the 2000s, likely reflecting the introduction of the GIS earnings exemption during this decade. Between 20 and 25 percent now face a PTR exceeding 50 percent.
Policy Conclusions
Avoid Very High Rates by Better Integrating New Benefit Programs
Government budgets are limited, and income-testing new benefit programs enables higher base benefits for targeted groups by reducing the program’s overall fiscal cost. But the federal and provincial governments should be careful not to pile up income-tested fiscal benefit programs on top of one another, because clawback rates can add up to create very high effective tax rates – sometimes above 50 percent – at lower-income levels. Income testing of multiple fiscal benefits requires an integrated approach to benefit reduction rates.
When thinking of introducing a new income-tested benefit program, in particular, policymakers should be conscious of the added economic and fiscal costs associated with income testing and clawback rates – and this added efficiency cost should be balanced against the social benefits of income targeting. For example, in the case of the existing federal CCB, income testing provides higher benefits to low-income families but creates economic and fiscal costs in terms of induced negative work impacts.
Income Averaging
The new economy is facilitating the development of labour arrangements in which workers become less attached to a single employer and move around more freely between projects and contracts. With these new structures comes increased potential for fluctuating incomes – a period of low earnings followed by a year of higher earnings, or vice versa. Because extra income can be exposed to much higher effective tax rates, a worker with fluctuating income might end up paying more tax (and losing more income-tested government benefits) than another worker with a flat income profile but earning the same amount over a period of years.
Wen and Gordon (2017) find that Canada’s “fluctuation tax penalty” is most severe for individuals who earn lower incomes or are self-employed. One way to lessen the impact of fluctuating incomes on tax liability is to allow workers to average their income over many years, so that any single large earning year would not lead to a disproportionate loss of fiscal benefits and higher tax payments.
This kind of income averaging could shield workers from losing income-tested benefits when they take on extra work, protecting them from being disproportionately affected by steep METR increases at lower income levels. However, income averaging should be applied broadly, to avoid overcomplicating the tax system with multiple provisions tailored to each benefit program.
Conclusion
Federal and provincial policymakers should pay special attention to effective tax rates when they consider changes to the tax-and-transfer system. Clearly, geared-to-income fiscal benefit programs provide valuable financial assistance to families with children, but these benefits can come with high family METRs and PTRs, especially at lower-income levels.
Any further expansion of the targeted transfer system – through larger low-income supplements or the creation of new targeted family benefits, for example – should be approached with a broader analysis of the impact on work decisions. Income-averaging provisions for highly fluctuating incomes could be explored, as well as other key factors in family paid work decisions such as childcare.
Appendix
References
Bargain, Olivier, Kristian Orsini, and Andreas Peichl. 2013. “Comparing Labor Supply Elasticities in Europe and the US: New Results.” NEUJOBS Working Paper D 10.6. Vienna: Central European University. January.
Bartels, Charlotte, and Cortnie Shupe. 2018. Drivers of Participation Elasticities across Europe: Gender or Earner Role within the Household? Discussion Paper 11359. Bonn: IZA Institute of Labor Economics.
Bocconi University. 2011. The Role and Impact of Labour Taxation Policies. Milan: Centre for Research on the Public Sector.
Department of Finance Canada. 2022. Fall Economic Statement 2022. Ottawa: Government of Canada. November.
Department of Finance Canada. 2023. Distributional Analysis of Personal Effective Marginal Tax Rates. Report on Federal Tax Expenditures – Concepts, Estimates and Evaluations 2022. Ottawa: Government of Canada.
Causa, Orsetta. 2009. “The Policy Determinants of Hours Worked across OECD Countries.” OECD Journal: Economic Studies 1: 1–40.
CRFFP (Chaire de recherche en fiscalité et en finances publiques). 2019. Guide des mesures fiscales, année d’imposition 2018. Cahier de recherche 2019/03. Sherbrooke, QC: Université de Sherbrooke.
Duclos, Jean-Yves, Arnaud Blancquaert, Nicholas-James Clavet, and Steeve Marchand. 2014. “La fiscalité québécoise et l’incitation au travail.” Working Paper. Quebec City: Commission d’examen sur la fiscalité.
Dudu, Alison, Zeus Eden, Theo Iordache, and Nathan McLean. 2021. “Is the Canada Child Benefit an Effective Policy? Impacts on Earnings and Incomes.” Finances of the Nation: Commentaries 2(14).
Fortin, Bernard, and Guy Lacroix. 2002. Assessing the Impact of Tax and Transfer Policies on Labour Supply: A Survey. Montreal: Centre interuniversitaire de recherche en analyse des organisations. April.
Godbout, Luc, and Suzie St-Cerny. 2022. Un regard éclairé sur le travail une fois à la retraite. Regard CFFP no. R2022-07. Sherbrooke, QC: Chaire en fiscalité et en finances publiques. July.
________________. 2023. “Is the CWB Enhancement Achieving Its Dual Objective of Supporting Income and Incentivizing Work? The Effects for Couples in Ontario and Quebec.” Canadian Tax Journal 71(2): 523–41.
Kalyva, Athena, Savina Princen, Alexander Leodolter, and Caterina Astarita. 2018. “Labour Taxation & Inclusive Growth.” European Economy Discussion Paper 084. Luxembourg: European Union.
Financial Accountability Office of Ontario. 2019. Child Care in Ontario: A Review of Ontario’s New Child Care Tax Credit and Implications for Ontario’s Labour Force. Toronto: Queen’s Printer for Ontario. Fall.
Laurin, Alexandre, and Nicholas Dahir. 2022. Softening the Bite: The Impact of Benefit Clawbacks on Low-Income Families and How to Reduce It. Commentary 632. Toronto: C.D. Howe Institute. November 30. https://cdhowe.org/publication/softening-bite-impact-benefit-clawbacks-low-income-families-and-how-reduce/.
Laurin, Alexandre. 2019. “The Paycheck Blues: Why Extra Work Is Often Not Worth the Effort for Lower-Income Families.” E-Brief 294. Toronto: C.D. Howe Institute. August 22. https://cdhowe.org/wp-content/uploads/2024/12/E-Brief20294.pdf.
Laurin, Alexandre, and Kevin Milligan. 2017. Tax Options for Childcare that Encourage Work, Flexibility, Choice, Fairness, and Quality. Commentary 481. Toronto: C.D. Howe Institute. May. https://cdhowe.org/publication/tax-options-childcare-encourage-work-flexibility-choice-fairness-and-quality.
Meghir, Costas, and David Phillips. 2010. “Labour Supply and Taxes.” In Dimensions of Tax Design: The Mirrlees Review, 202–74. London: Institute for Fiscal Studies.
Ohanian, Lee, Andrea Raffo, and Richard Rogerson. 2007. “Work and Taxes: Allocation of Time in OECD Countries.” Federal Reserve Bank of Kansas City Economic Review, Third Quarter.
Organisation for Economic Co-operation and Development (OECD). 2022. “The OECD Tax-Benefit Data Portal.” Paris. https://www.oecd.org/els/benefits-and-wages-statistics.htm.
Robert-Angers, Michael, Luc Godbout, and Caroline Lavoie. 2022. Imposition implicite du second apporteur de revenu au sein du couple – Comment se compare le Québec au Canada et à l’international? Regard CFFP no. R2022-09. October.
Tsounta, Evridiki. 2006. “Why Are Women Working So Much More in Canada? An International Perspective.” IMF Working Paper. Washington, DC: International Monetary Fund. April.
Wen, Jean-Francois, and Daniel V. Gordon. 2017. A Question of Fairness: Time to Reconsider Income-Averaging Provisions. Commentary 494. Toronto: C.D. Howe Institute. October. https://cdhowe.org/publication/question-fairness-time-reconsider-income-averaging-provisions/.