


From: David R. Johnson
To: Ontarians Concerned About Education
Date: July 4, 2025
Re: Boots on the ground in Ontario schools: 2018-19 to 2023-24: Implications for underfunding
While there are some very loud claims of education underfunding in Ontario despite a recent budget increase, a closer examination of enrolment and staffing data tells a more nuanced story.
Education is the second largest category of spending by the Ontario government. Expenditures on teaching and administrative staff dominate spending and trying to measure whether human resources, the boots on the ground, have increased, decreased or remained roughly the same is important.
This Memo presents two measures of changes in staffing resources in Ontario schools from the 2018-19 school year to the 2023-24 school year. The cost of restoring staffing to 2018 levels is estimated and compared to two estimates of underfunding.
The result: Underfunding claims are implausibly large.
The Ontario Public School Boards Association , which represents the 31 English public school boards, estimates that by the 2025-26 school year, spending per student will be $404 short of the 2018 level, when the current government took office. Meanwhile, the Ontario Secondary School Teachers Federation (OSSTF) says the gap is $1,500 per student.
Ontario’s K-12 system had 2,080,496 students in the last school year. Based on the OPSBA’s estimate and that enrolment, an additional $840 million in funding would be required to close the gap. The OSSTF calculation implies an additional $3.1 billion.
Using the provincial Education Facts website, we can calculate the direct teaching and administrative human resources per student. The results are presented in Table 1. In the elementary system, since the 2018-19 school year, ratios have changed very little. The number of students for which the average elementary administrator is responsible has dropped over this period, implying an increase in administrative resources per student.
Table 1: Human resources in Ontario elementary schools
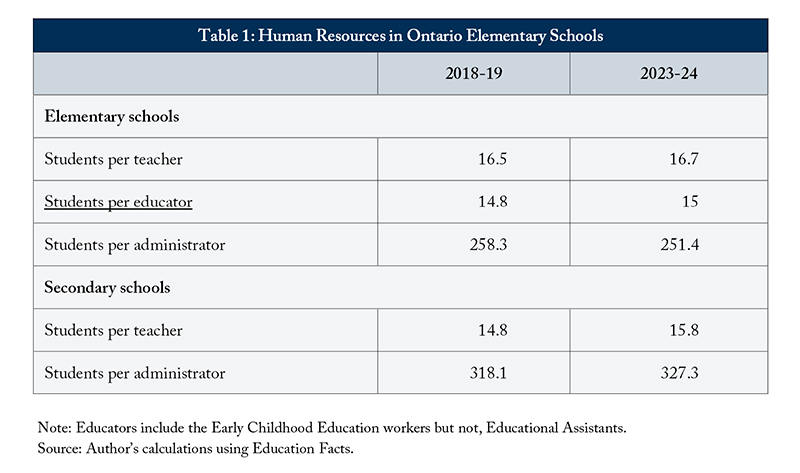
In the secondary system the student to teacher ratio has increased by one student and the student to administrator ratio also grew by a small amount. This suggests that teaching resources per secondary school student have fallen very modestly (by about 6 percent).
How much money might it cost to restore the student-teacher ratio in 2023-24 to its 2018-19 level? There were 660,956 secondary students in 2023-24. If the secondary school student-teacher ratio remained at 14.8, an additional 2,890 teachers would be required. At an estimated $110,000 per teacher (a generous figure that includes benefits), this would result in an $319-million increase in spending on secondary education across all school boards.
A similar calculation for elementary teachers, would require an additional 938 teachers and thus could cost up to an additional $103 million.
Together, these calculations suggest that restoring teaching staff to 2018-19 levels would cost up to $421 million, which is an overestimate since additional teachers in this example are assumed to be hired at the highest pay grade.
The OPBSA calculation, by contrast, suggests a funding shortfall of roughly $840 million – a gap twice the size of the calculations above. And the OSSTF suggests a funding shortfall of $3.1 billion, seven times the calculation above. Both gaps thus warrant further discussion. It could be, for example, all the gap is somehow in expenses not related to either teaching or administrative positions. The largest category of such expenses is called “non-teacher instruction,” which includes Educational Assistants (EAs), learning materials, technology, library services and the non-teacher component of support for students with special needs.
Statistics Canada’s Survey of Employment, Payroll and Hours (SEPH) offers an alternative source of staffing data, which also includes private schools and captures both salaried and hourly employees, including EAs. According to SEPH, the student-to-total-employee ratio fell slightly from 6.9 in 2018-19 to 6.7 in 2023-24, suggesting a marginal increase in staffing (Table 2). A rise in the number of students per salaried employee from 14.2 to 14.5 was offset by a notable decline in the ratio of students to hourly employees – 17.8 to 16.2 – indicating an increase in the number of hourly support staff.
Table 2: An alternative measure of human resources at school
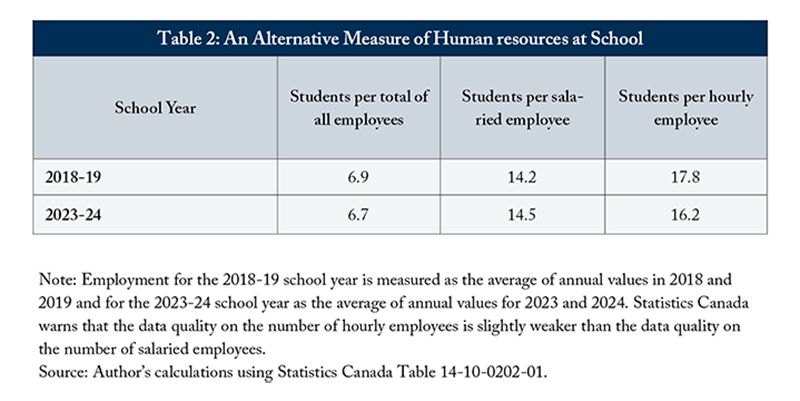
Source: Author’s calculations using Statistics Canada Table 14-10-0202-01.
Note: Employment for the 2018-19 school year is measured as the average of annual values in 2018 and 2019 and for the 2023-24 school year as the average of annual values for 2023 and 2024. Statistics Canada warns that the data quality on the number of hourly employees is slightly weaker than the data quality on the number of salaried employees.
Together, these findings support the broader conclusion that the “boots on the ground” in Ontario classrooms either remained steady, fell slightly, or even increased slightly depending on the measure over the past five years. There is no evidence of a large-scale cutback to classroom human resources. The argument that the education system is underfunded compared to previous history is weak. Even a full return of staffing to its 2018-19 levels would not require anywhere near the levels of additional funding claimed as needed by either the OPBSA or the OSSTF.
David R. Johnson is emeritus professor of economics at Wilfrid Laurier University and a C.D. Howe Institute Research Fellow.
To send a comment or leave feedback, email us at blog@cdhowe.org.
The views expressed here are those of the author. The C.D. Howe Institute does not take corporate positions on policy matters.
Want more insights like this? Subscribe to our newsletter for the latest research and expert commentary.