


- The Canada-wide Early Learning and Child Care program has significantly reduced childcare fees across most provinces and territories, stimulating demand for regulated care and drawing families away from informal arrangements. As affordability barriers have declined, however, access to licensed spaces has become the primary constraint.
- The creation of licensed spaces has fallen behind federal targets, shortages of early childhood educators have constrained system expansion, and waitlists have grown – creating significant accessibility barriers for many families. As a result, early evidence suggests the policy has led to modest increases in maternal labour force participation.
- A federal cost-benefit analysis indicates that, over the program’s early years, increased maternal employment generates only limited additional tax revenues relative to program costs, leaving the plan with a substantial net fiscal cost.
- To strengthen the program’s impact, governments should prioritize expanding licensed spaces in underserved areas, improving wages and working conditions for early childhood educators, and introducing more flexible supports – such as an income-tested refundable tax credit – for families who rely on non-subsidized care.
Introduction
In Canada, a persistent gap in labour force participation exists between mothers and fathers. Although this gap has narrowed over time, it remains particularly evident among parents with young children. It also continues to vary significantly across provinces, consistent with differences in childcare policies.
Lack of access to affordable childcare has long exacerbated the situation for parents, often women, looking to join the workforce. Before 2022, childcare remained costly in many provinces outside Quebec, and access to regulated childcare spaces was often limited. The COVID-19 pandemic led most jurisdictions to mandate school and daycare closures, with immediate and severe impacts on working parents. Recognizing both the economic gains from increased maternal labour force participation and its broader gender and social equity benefits, the federal government expanded its role in strengthening provincial childcare systems.
As of 2022, Ottawa and the provinces and territories had agreed to implement a national childcare plan – the Canada-wide Early Learning and Child Care (CWELCC) program – to deliver $10-a-day regulated childcare (licensed centre-based and home-based childcare) for children under age six within five years. The plan involves federal funding to subsidize parents’ fees for regulated childcare, creating more than 250,000 regulated childcare spaces, and improving wages for early childhood educators. The overarching policy objective is to increase women’s labour force participation by making childcare more affordable, particularly in provinces outside Quebec.
By early 2025, childcare costs had dropped significantly across most of Canada. Eight provinces and territories achieved average daily fees of $10 or less for regulated childcare, while the remaining provinces cut fees by at least half. Early evidence shows that the federal plan has modestly increased maternal employment in several provinces, enabled some mothers to shift from part-time to full-time work, and encouraged many families to move from informal care arrangements to regulated childcare.
However, the CWELCC’s rollout has also exposed persistent shortcomings. While affordability has improved, demand has surged without a corresponding expansion in system capacity, creating a supply-demand imbalance that has lengthened waitlists and intensified concerns about childcare accessibility. Regional disparities in participation, coverage, and affordability also remain significant. Despite efforts to expand childcare capacity, the number of new licensed spaces remains well below federal targets. Shortages of early childhood educators (ECEs) continue to constrain service expansion. For many families, the main obstacle has shifted from affordability to availability and flexibility, particularly for those working non-standard hours. Without faster and more targeted capacity expansion, the fiscal and economic returns from higher labour supply will remain below their potential.
Our fiscal cost–benefit analysis indicates that the federal childcare plan generates a substantial net fiscal cost over its first three years of implementation. Achieving long-term fiscal gains will depend critically on the availability of regulated childcare spaces, an adequate ECE supply, parental labour-supply responses, and long-run earnings gains, as well as complementary policies that support workforce participation.
As the system continues to evolve, it is essential to strengthen its impact by addressing persistent shortcomings. To that end, we recommend that the provincial and territorial governments:
- Prioritize the creation of licensed childcare spaces for underserved groups, especially low-income, less-educated, or single-parent households with preschool-aged children;
- Incentivize childcare providers to expand licensed childcare spaces in underserved areas through operating or capital grants and targeted funding mechanisms; and
- Improve wages, working conditions, and professional development opportunities to attract and retain ECEs and maintain high service quality.
For its part, the federal government needs to:
- Implement an income-tested, refundable tax credit1A refundable tax credit can be claimed regardless of whether the individual owes income tax. similar to Quebec’s model to increase flexibility and support families using non-subsidized care;2Admittedly, the federal government already provides the Child Care Expense Deduction (CCED) and the Canada Child Benefit. However, as Laurin and Milligan (2017) note, many lower-income families cannot fully benefit from the CCED because the deductible amount cannot exceed two-thirds of the lower-earning spouse’s earned income. This indicates room for a more equitable approach to the tax treatment of childcare costs. They propose replacing the CCED with a refundable tax credit that would both encourage greater maternal labour force participation and extend support to families of modest income who currently receive limited benefit from the CCED. and
- Ensure stable, long-term funding for the national childcare system while promoting provincial accountability and progress toward consistent national standards.
Mothers’ Participation and Childcare Policies
In the labour market, mothers’ labour force participation and employment are significantly influenced by childcare responsibilities, particularly those related to the age of their youngest child (Schirle, Ferrer, and Pan 2023). Employed mothers are more likely than fathers to reduce their regular work hours or decline job opportunities or promotions due to caregiving responsibilities. Between September 2022 and July 2024, approximately 40 percent of employed mothers in Canada said they made at least one career or job-related decision that prioritized childcare over their professional advancement.3See Labour Force Survey, July 2024. Available at https://www150.statcan.gc.ca/n1/daily-quotidien/240809/dq240809a-eng.htm.
The financial calculations for parents weighing work versus staying home to care for young children can be daunting, especially for lower-income families where incremental work hours are heavily taxed (Laurin and Dahir 2022, 2024). The affordability and availability of early learning and childcare services can directly influence caregivers’ ability, particularly that of mothers, to join the labour force.
Given these constraints, the motivation for subsidizing childcare is straightforward: to encourage maternal labour force participation, which in turn generates higher household incomes and contributes to GDP growth. The additional income earned by working mothers also generates tax revenues that can partially offset the initial subsidy costs.
Countries worldwide have adopted various childcare policies and programs, both universal and targeted, to help women achieve a better work-life balance. However, their effectiveness on maternal labour supply depends on several factors, including childcare availability, costs, quality, and pre-existing levels of labour force participation (see, for example, Cattan 2016 and Morrissey 2017).
In countries where female labour force participation is already high, new policies may have limited effects on labour supply (Cascio, Haider, and Nielsen 2015). When many mothers are already working, the potential to expand employment is constrained. Working mothers who previously relied on informal or privately paid care may simply substitute their existing arrangements with subsidized options, creating a crowding-out effect without necessarily increasing the labour supply (Baker, Gruber, and Milligan 2008; Cattan 2016).
This crowding-out effect has significant implications for the cost-effectiveness of policy. It creates “deadweight costs” by transferring income from the government to mothers through avoided childcare expenses, without affecting their labour-market behaviour (Cattan 2016). Consequently, the tax revenue generated by the new maternal labour supply may fall far short of covering the increased costs of childcare subsidies. This pattern is evident in several countries with already high female participation rates, including Norway (Havnes and Mogstad 2011; Hardoy and Schøne 2013), France (Givord and Marbot 2015), and the Netherlands (Bettendorf et al. 2015).
Childcare subsidies tend to have more pronounced effects in jurisdictions where maternal employment rates were low, as seen in Spain (Nollenberger and Rodríguez-Planas 2015), Germany (Bauernschuster and Schlotter 2015), and Quebec. Quebec provides a particularly compelling case study. In 1997, before implementing its universal childcare program, Quebec’s employment rate of mothers aged 25 to 54 years stood at 60.5 percent, 3.3-percentage points below the rest of Canada. To address this gap, Quebec introduced a universal childcare system for children under age six, featuring subsidized spaces with low universal fees and refundable tax credits for families waiting for these spaces or those who prefer non-subsidized private options. By 2019, the 78.9 percent employment rate for this group of mothers had not only closed the gap but surpassed the rate in the rest of Canada by approximately nine percentage points, marking a sustained reversal of its pre-reform position.
The program’s impact was substantial and well-documented. Multiple empirical studies have demonstrated significant increases in maternal labour supply both immediately and over the long term (Baker, Gruber, and Milligan 2005; Lefebvre and Merrigan 2005; Lefebvre, Merrigan, and Roy-Desrosiers 2011; Fortin, Godbout, and St-Cerny 2011; Haeck, Lefebvre, and Merrigan 2015). It also expanded employment along both extensive and intensive margins, with more women entering the workforce and employed mothers increasing their working hours. Notably, these positive effects persisted long term as children aged, particularly benefiting highly educated mothers (Baker, Gruber, and Milligan forthcoming).
Quebec’s infrastructure expansion is equally impressive. Subsidized childcare spaces more than doubled between 1998 and 2002 (Lefebvre and Merrigan 2005) and increased by 173 percent by March 2010 (Lefebvre, Merrigan, and Roy-Desrosiers 2011). During the first seven years, Quebec created an average of 16,000 new spaces annually (Fortin, Godbout, and St-Cerny 2011). Research indicates a strong causal relationship between the expansion of formal childcare spaces and increased maternal labour force participation (Haeck, Lefebvre, and Merrigan, 2015).
While Quebec’s program achieved its primary objective and the fiscal return from increased tax revenues outweighed its costs, according to several studies (Lefebvre, Merrigan, and Roy-Desrosiers 2011; Fortin 2019), it also raised important questions about policy efficiency. Notably, the increase in childcare utilization was twice the increase in maternal labour supply, suggesting that subsidies partially crowded out informal care arrangements rather than exclusively enabling new workforce entry (Baker, Gruber, and Milligan 2005; Vuri 2016). This suggests that a cost-effective approach involves targeting populations where childcare costs and availability pose the greatest barriers to workforce participation (Cattan 2016; Vuri 2016).
Meanwhile, the literature consistently shows that childcare policies have stronger effects on low-income, less educated, or disadvantaged single-parent households with preschool-eligible children (Del Boca, Pasqua, and Pronzato 2009; Kottelenberg and Lehrer 2017; Davis et al. 2018). These families face the most significant constraints and, therefore, benefit most from policy interventions.
In general, the most effective and efficient childcare policies include several key principles: ensuring accessibility and affordability across all income levels; offering a range of options to meet diverse family needs (including various care modes, flexible scheduling, and diverse facility types); and investing in high-quality4Information on childcare quality is often limited due to asymmetric information. Some dimensions of quality are observable and relatively easy to measure, including staff-child ratios, group size, the education of childcare workers, availability of books, space per child, and the overall child-friendly environment (Vuri 2016). Other dimensions are more difficult to assess, such as teachers’ and staff’s competence and childcare providers’ motivation and energy. early childhood education. High-quality programs have been shown to improve school readiness, cognitive development, and social skills – benefits that are particularly significant for children from disadvantaged backgrounds, ultimately improving socioeconomic outcomes and social integration.
The Canadian Context
In Canada, a persistent gap exists between the labour force participation rates of mothers and fathers. Figure 1 shows that the largest gap exists between mothers and fathers of children under age six (ages 0 to 5). While this gap has narrowed significantly over the past five decades, it remains sizable relative to families with older children.

The participation gap between mothers and fathers of young children declined sharply from 61.4 percentage points in 1976 to 31.4 points in 1990, mirroring similar trends among parents with older children. This convergence has been driven by several factors, including shifting social norms, increased educational attainment among women, and the gradual expansion of family and social policy supports. Since then, convergence has continued, but at a slower pace.
By 2019, the participation rate of mothers with children under age six had reached 75.8 percent, remaining 19.8 percentage points below that of fathers. The gap narrowed further to approximately 16.6 percentage points by 2025, after a brief period of pandemic-related volatility in 2020/21 when childcare disruptions temporarily slowed gains in maternal labour force participation. The slower pace of convergence in recent years suggests that remaining participation gaps are increasingly shaped by structural constraints – such as childcare affordability and availability, workplace rigidity, tax-benefit interactions, and entrenched social norms.
Maternal labour force participation also varies substantially across provinces, largely due to differences in childcare policies and financial support (Pasolli 2015). Variations in labour market conditions, demographic composition, and educational attainment are also likely to contribute to provincial heterogeneity. In 2019, prior to the CWELCC initiative, PEI and Quebec had the highest participation rates for mothers with young children, at 83.6 percent and 82.1 percent, respectively, while Alberta and Manitoba had the lowest rates, at 71.4 percent and 71.3 percent.5See labour force characteristics by family structure, annual, unadjusted for seasonality available at https://www150.statcan.gc.ca/t1/tbl1/en/tv.action?pid=1410039601. Although participation increased in most provinces after 2019, sizable cross-provincial disparities have persisted, consistent with differences in the pace and design of childcare policy implementation.
Childcare costs also vary significantly across provinces. In 2019, the average daily cost of full-time, centre-based care for children under age six ranged from as low as $19 in Quebec to around $39 in Ontario. In provinces such as Newfoundland and Labrador, PEI, Quebec, and Manitoba, government-regulated parent fees apply to more than half of childcare centres, which helps keep costs relatively low (Friendly et al. 2020). Despite these measures, early learning and childcare services across much of Canada remain either unavailable or unaffordable for many families.
Fees also vary by provider type (e.g., childcare centres, home-based providers, or care by relatives) and by the child’s age. In 2019, parents across Canada reported paying an average of $7,516 annually for a main full-time childcare arrangement (30 or more hours per week), rising to $9,112 when Quebec is excluded.6For parental childcare expenses for main childcare arrangement, children up to age five, see Statistics Canada, Table 42-10-0053-01. https://www150.statcan.gc.ca/t1/tbl1/en/tv.action?pid=4210005301. Provincial averages ranged from about $4,900 in Quebec and Manitoba to more than $10,000 in Alberta and BC, with even higher costs reported in the Northwest Territories. Differences across provider types were pronounced: centre-based care averaged roughly $7,500 nationally, compared with about $6,700 for licensed home-based providers, while care provided by relatives averaged roughly $2,600 per year where reported. Because these annual amounts aggregate across different care types and usage patterns, they reflect both price variation and constraints on access and availability for families, especially for those with low incomes.
Overview of the Federal Childcare Plan
In 2021, the federal government announced an ambitious plan to build the CWELCC system.7For more information, see https://www.budget.canada.ca/2021/report-rapport/p2-en.html. This initiative aims to promote gender equality in the labour market, support social equality among families from diverse income and demographic backgrounds, and increase women’s participation in the labour force. To achieve this, a central policy objective is to reduce the cost of childcare, particularly outside Quebec, where fees have historically been high.
As part of Budget 2021, the federal government committed $27.2 billion over five years (2021/22 to 2025/26) to establish the CWELCC system, building on approximately $7.5 billion in existing federal early learning and childcare funding under earlier bilateral agreements. Together, these commitments brought total planned federal investment in early learning and childcare to nearly $34 billion over the initial five-year period.
By 2022, the federal government reached bilateral agreements with all provinces and territories, setting out shared objectives and funding commitments (see online Appendix Table A1).8In March 2025, the federal government announced extension agreements with 11 of 13 provinces and territories for another five years and committed $36.8 billion in new funding to continue early learning and childcare supports beyond the original CWELCC term, including indexed increases beginning in 2027/28. These agreements established three core policy pillars:
- Affordability: Reduce fees for regulated childcare to an average of $10-a-day by 2026.
- Access: Expand licensed childcare capacity, with a target of 250,000 new affordable spaces by March 2026.
- Quality: Support the development and retention of a high-quality early learning and childcare workforce through training, professional development and improved working conditions, with the aim of sustaining and enhancing program quality.
Together, these pillars are intended to address both the cost and availability constraints that have historically limited childcare use and maternal labour force participation.
Childcare Costs
As of early 2025, many provinces and territories had achieved substantial reductions in regulated childcare fees (see online Appendix Table A2). Eight jurisdictions, including Newfoundland and Labrador, PEI, Quebec, Manitoba, Saskatchewan, Nunavut, the Northwest Territories, and Yukon, had reached average daily fees of $10 or less for regulated childcare (ESDC 2025a).9Among the eight jurisdictions, Quebec and Yukon had already achieved $10 or less before the implementation of CWELCC. In the remaining provinces, average fees had declined by 50 percent or more relative to pre-CWELCC levels.
Nationally, the average parental childcare expenses for full-time centre-based care (excluding Quebec) decreased from $36 per day in 2019 to $23 in 202510Data on fees for home-based childcare are not consistently available across provinces, nor are fees reported separately for licensed and unlicensed providers. Accordingly, the chart focuses on centre-based care. At the national level, excluding Quebec, average daily fees for centre-based and home-based care were similar in 2019 ($36 versus $35). By 2025, centre-based fees are lower on average ($23 versus $30), consistent with the higher share of licensed provision in centre-based care. (Figure 2). Substantial variation across provinces remains: in 2025, PEI had the lowest average daily fee at $10, followed by Newfoundland and Labrador ($11) and Saskatchewan ($13). The highest costs were in BC and Ontario, at $27 and $25 per day, respectively.

This fee reduction benefits families differently. In 2023, 41 percent of children aged five and under in low-income families attended formal or informal childcare, compared with 60 percent of children in higher-income families. This suggests that the current program disproportionately benefits affluent families who already had childcare arrangements before the CWELCC agreement, while doing less to reach those who need it most. Although some low-income parents in 2023 chose to stay at home with their children, 27 percent of them who did not use childcare cited cost as the reason and 20 percent cited unemployment. Both shares were higher than those among higher-income families.11For 2023 childcare use by low-income families, see https://www150.statcan.gc.ca/n1/pub/11-627-m/11-627-m2025042-eng.htm. This indicates that despite fee reductions, barriers to accessing affordable childcare persist for some low-income households, requiring targeted measures to reduce financial obstacles and expand access to affordable childcare in underserved communities.
On the other hand, not all eligible childcare providers participate in the CWELCC funding arrangements. Some centres have opted out of the program and continue to charge higher market-based fees, contributing to ongoing cost variation. In Ontario, for example, 92 percent of licensed childcare sites and spaces for children under age six were enrolled in the system as of March 31, 2025.12For more information, see https://www.ontario.ca/page/ontarios-early-years-and-child-care-annual-report-2025. The remaining 8 percent could charge fees based on market demand, meaning that families unable to secure a spot in regulated childcare may still face high fee costs.
Childcare Enrolment
As regulated childcare becomes more affordable, enrolment in childcare centres is expected to increase. Between 2019 and 2023, the number of children under age six in centre-based childcare, excluding the territories, grew by 54,700 (714,100 to 768,900), following a sharp pandemic-related decline in 2020 (Figure 3).13The corresponding figures for Canada, including the territories, are 717,300 in 2019 and 772,000 in 2023. Figures for Canada, excluding the territories, are used in Figure 3 because a national-level estimate for 2022 is not available. Both series display similar trends over time. Over the same period, use of several other childcare arrangements fell, particularly care by relatives (down 90,200) and home-based childcare providers (down 79,700), indicating a temporary shift toward regulated centre-based care during the early phase of CWELCC implementation and post-pandemic recovery.
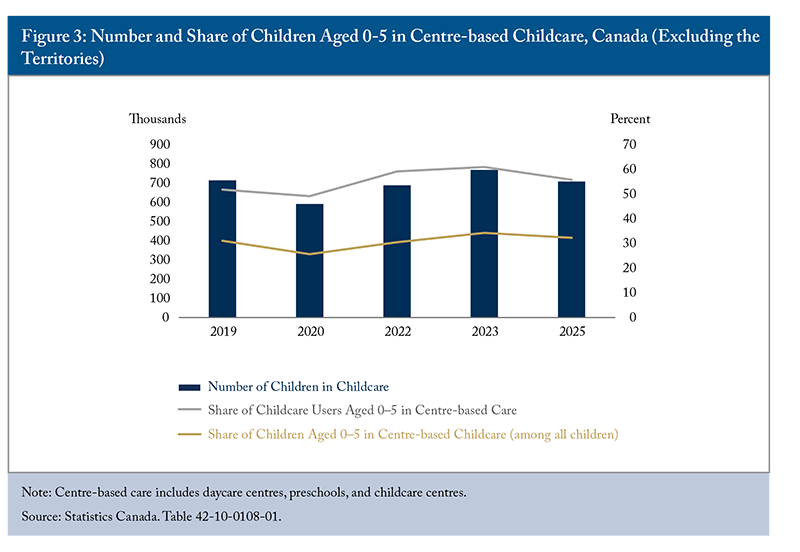
More recent data, however, shows some backsliding. By 2025, the number of children in childcare centres declined to about 709,000, while enrolment in home-based childcare providers, along with before- and after-school programs, increased. Care by relatives, which had declined steadily between 2019 and 2023, largely stabilized by 2025, and care by non-relatives in the child’s home showed a modest rebound. Consistent with these shifts, the share of all children under age six enrolled in centre-based care fell from 34.3 percent in 2023 to 32.3 percent in 2025, and the share of childcare users in centres declined from 61 percent to 55.8 percent (Figure 3). These trends suggest that while CWELCC significantly accelerated the expansion and utilization of centre-based care through 2023, sustaining and further increasing enrolment may be constrained by factors such as limited spaces, childcare workforce shortages, and parental preferences for a mix of care arrangements.
Provincial patterns in centre-based childcare use vary significantly (Figure 4). In 2025, the share of all children under age six enrolled in centre-based care ranged from over 50 percent in PEI to under 25 percent in Ontario and Saskatchewan. Quebec continued to report relatively high centre-based participation (46 percent), reflecting the long-standing role of its publicly supported childcare system.
Figure 4 also highlights divergent provincial trajectories between 2019 and 2025. While centre-based participation increased markedly in Manitoba and PEI during this period, several jurisdictions, such as BC, Ontario, and Nova Scotia, experienced slight declines.
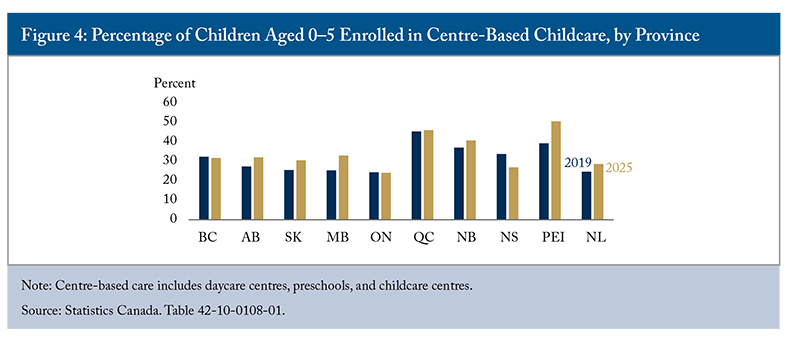
Differences are even more pronounced when centre-based care is examined as a share of children using childcare. In 2025, more than three-quarters of PEI children in childcare were enrolled in centres, compared with less than one-half in Ontario and Newfoundland and Labrador. This suggests that lower overall centre-based participation in some provinces reflects both lower childcare use overall and continued reliance on non-centre arrangements, including home-based and informal care.
Childcare Spaces
The economic and labour market impact of a childcare policy depends highly on the capacity of licensed care to accommodate increased demand. Provinces and territories across Canada have committed to expanding childcare capacity, with new space creation targets ranging from just 110 in Yukon to 76,700 in Ontario (ESDC 2025a).
As of February 2025, provinces and territories had announced plans to create some 150,000 new childcare spaces since 2021, including spaces already operational and those under development. However, this remains well below the federal target of more than 250,000 new licensed spaces by March 2026 (Figure 5). According to the Auditor General of Canada (2025), CWELCC had created less than half of its targeted number of spaces within three years of its launch. With the March 2026 deadline approaching, meeting the federal target appears unlikely, limiting the program’s accessibility for families who are not yet enrolled. While fewer spaces are being created than anticipated, these spaces may also not be equitably accessible to diverse or vulnerable families, raising equity concerns (Auditor General of Canada 2025).

Progress toward space-creation targets has been uneven across jurisdictions (Figure 6). In the program’s first three years, only Quebec fully met the target, while BC created more than half of the targeted new childcare spaces. Meanwhile, by February 2025, only New Brunswick and Yukon had announced plans to fully meet their space creation targets. Many other jurisdictions planned to achieve less than half of their intended expansions. For example, PEI (30 percent) and Ontario (43 percent) fell well below their targets, leaving the status of the goal’s remaining spaces uncertain. As a result, the pace of childcare expansion has lagged behind the surge in demand generated by lower childcare fees.

Announced space creation targets, however, do not fully capture changes in childcare availability relative to the population of young children. Between 2019 and 2024, regulated centre-based capacity increased nationally by approximately 113,000 spaces, raising coverage – the percentage of children under age six for whom a regulated full- or part-day centre space is available14Regulated capacity reflects the number of regulated spaces approved for operation and does not necessarily equal the number of children served at a given point in time. Staffing shortages, phased openings, quality and regulatory constraints, uneven demand across locations or age groups, and timing differences in data reporting mean that enrolment (shown in Figure 3) does not necessarily increase one-for-one with regulated capacity. – from 27 percent to 32 percent (Table 1). Alberta and BC recorded the largest increases in spaces and substantial improvements in coverage, while Ontario’s coverage rose more modestly, from 21 to 24 percent, despite large space increases. In contrast, several smaller jurisdictions experienced limited expansion, and Newfoundland and Labrador recorded a net decline in centre-based spaces over the same period.

While coverage improved in most provinces and territories, the data suggest that, even after recent expansion, regulated centre-based childcare remains unavailable for the majority of children in many jurisdictions. These capacity constraints contribute to longer waitlists and access difficulties for families not yet enrolled. The imbalance between affordability gains and capacity growth may have limited the extent to which CWELCC translates into sustained increases in maternal participation.
CWELCC Impact on Mothers’ Labour Market Outcomes
Between 2019 and 2025, the labour force participation rate of prime-age mothers (25–54) with children under age six increased across all provinces, though the magnitude of change varied (Figure 7).15CWELCC was introduced in 2022 amid the ongoing recovery from the COVID-19 pandemic. Provinces and territories were emerging from the crisis at different paces while the broader economy faced tight labour market conditions and elevated inflation. To account for these fluctuations and provide a stable point of comparison, we use 2019 as the baseline year. At the national level, this maternal participation rose by 3.7 percentage points, a gain comparable to the increase observed in Quebec (4.4 percentage points), where a universal low-fee childcare system has been in place for more than two decades. This suggests that, at the aggregate level, the early labour supply response to CWELCC has been modest, particularly given the scale of the policy intervention.16The term “modest” refers to the scale of change relative to the policy intervention’s cost, not to any predetermined target. Quebec’s experience offers useful context: the participation gap between mothers with young children and women without children narrowed from 9.9 percentage points in 1997 to 6.9 percentage points in 2019 and to three percentage points in 2025. The comparable gap for Canada overall narrowed from 11.5 percentage points (1997) to 11.8 percentage points (2019) to 9 percentage points (2025), while provinces like Ontario (10.4 percentage points in 2025) and Manitoba (14.8 percentage points) retain substantially larger gaps, suggesting room for further convergence.
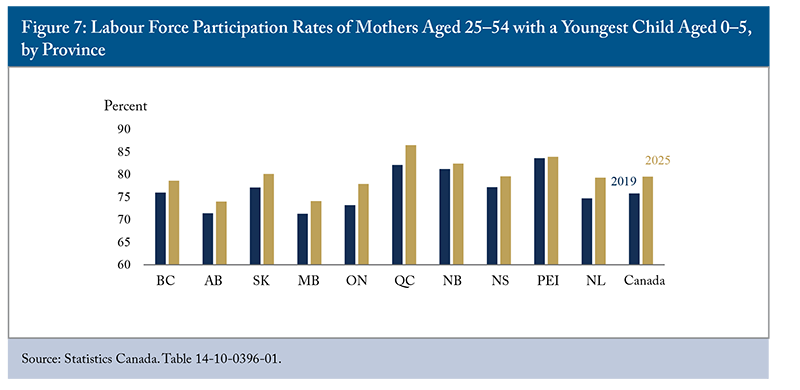
Several provinces experienced notable net increases in maternal participation between 2019 and 2025, but for different reasons. Ontario (4.7 percentage points) and Newfoundland and Labrador (4.6 percentage points) saw strong gains, suggesting that CWELCC has a larger effect where subsidized childcare was previously limited, and affordability constraints were more binding. Quebec also experienced a net increase, but it likely reflects expanded childcare capacity – over 18,500 additional regulated spaces were added between 2019 and 2024 – since it already had a universal low-fee childcare system (Table 1).
In provinces where maternal participation increased more modestly, such as New Brunswick (1.2 percentage points) and PEI (0.3 percentage points), both already had among the highest maternal participation rates before CWELCC. This modest increase may reflect several factors, including limited scope for further growth given their already-high baseline rates and potential statistical noise in the estimates. This may also reflect findings in the literature that publicly funded childcare services can “crowd out” private or informal care, generating limited net labour supply effects in jurisdictions with high pre-existing maternal participation rates. In such cases, subsidies are paid directly to working mothers who simply switch to a preferred, subsidized care arrangement, raising concerns about the program’s cost-effectiveness and long-term fiscal sustainability. The limited increase in maternal labour supply may also reflect other constraints, such as work schedules and local labour demand.
By 2025, Quebec (86.5 percent) and PEI (83.9 percent) continued to exhibit the highest maternal participation rates, while participation remained lowest in Alberta (74 percent) and Manitoba (74.1 percent), highlighting the persistence of cross-provincial disparities despite nationwide fee reductions.
Importantly, participation trends were not smooth. Several provinces experienced non-linear year-to-year fluctuations, reflecting pandemic-related disruptions, broader labour market conditions, and differences in the timing and pace of childcare policy implementation. For example, Newfoundland and Labrador participation rose sharply from 74.7 percent in 2019 to 86.7 percent in 2022 before declining to 79.3 percent in 2025, while PEI fluctuated between 80.4 percent and 86.7 percent before settling at 83.9 percent in 2025. Saskatchewan and Alberta also showed intermittent declines and rebounds, suggesting that single-year snapshots may obscure short-term volatility. The sudden jump in maternal participation rates during the “work-at-home” pandemic years reflects the potential impact of remote work on mothers’ labour force participation. The subsequent decline in 2025 is likely partly associated with governments and businesses returning to partial or full-time in-office work.
Changes in labour force participation were closely mirrored by changes in employment rates, indicating that increased participation largely translated into employment. Between 2019 and 2025, the employment rate of mothers with young children rose by four percentage points in Ontario, 4.2 percentage points in Quebec, and 6.3 percentage points in Newfoundland and Labrador, while remaining nearly flat in Alberta (0.8 percentage points).
While the focus of this section is on mothers, changes in labour force participation and employment among parents with young children were not gender-neutral. As shown in the online Appendix (Figures A1 and A2), increases in participation and employment between 2019 and 2025 were consistently larger for mothers than for fathers at the national level and in most provinces. Nationally, maternal participation rose by 3.7 percentage points compared with 0.5 percentage points for fathers, and maternal employment increased by 3.1 percentage points compared with just 0.2 percentage points for fathers. This pattern is consistent with childcare cost reductions and work-at-home possibilities that primarily relax constraints on mothers’ labour supply rather than generating broad-based increases in parental employment. Smaller gains among fathers likely reflect that a higher proportion were already participating in the labour force or employed prior to the introduction of the program.
Beyond participation and employment, childcare policies also affect women’s hours of work by enabling some mothers to transition from part-time to full-time employment. In several provinces, the share of prime-aged mothers with children under age six citing childcare responsibilities as the reason for working part-time decreased between 2019 and 2025, suggesting improved ability to work full-time. The largest declines occurred in New Brunswick (-11.1 percentage points), Alberta (-6.2 percentage points), and BC (-5.2 percentage points), suggesting that in these provinces, some mothers previously constrained by childcare were able to move toward full-time employment. Smaller declines were observed in Manitoba (-1.8 percentage points) and Saskatchewan (-0.6 percentage points), while Ontario remained largely unchanged.
In contrast, other provinces experienced the opposite pattern, with increases in the share of mothers working part-time due to childcare responsibilities (Figure 8). Newfoundland and Labrador (+10.8 percentage points), PEI (+10.3 percentage points), and Nova Scotia (+10.0 percentage points) all saw significant increases, likely reflecting growing gaps between the increased demand for childcare and the availability of full-time or flexible options to support mothers’ work hours. Quebec, with long-standing universal childcare, greater space availability, and enhanced parental leaves, saw a moderate decline (-2.5 percentage points), maintaining the lowest share of mothers working part-time for childcare reasons.

Overall, the evidence indicates that CWELCC’s early impacts reflect a combination of outcomes: modest increases in maternal labour force participation and employment, some shifts from part-time to full-time work, and substitution away from informal childcare arrangements. The variation in outcomes across provinces suggests that observed effects represent a reduced-form response to the policy, shaped by pre-existing childcare systems, labour-market conditions, and the pace of space creation, rather than a uniform structural shift in maternal labour supply. At the same time, participation and employment measures capture only part of childcare’s labour market effects. As discussed in Box 1, improved childcare access may also reduce labour market frictions related to employment stability, job tenure, and absenteeism.

Key CWELCC Challenges
While the CWELCC system has had some positive impacts for many families and in certain provinces, significant challenges remain. A shortage of regulated childcare spaces continues to create a gap between demand and supply, with regional disparities in availability. The system also lacks flexibility, making it difficult for working mothers with non-standard hours to access affordable care. Moreover, a growing ECE shortage is placing further strain on the system. Without a sufficient ECE workforce, the full implementation and success of CWELCC will not be achievable.
Childcare Availability
Childcare availability plays a significant role in supporting mothers’ return to the workforce after childbirth. Brilli, Del Boca, and Pronzato (2016) found that a one-percentage-point increase in public childcare availability increased the probability of maternal employment by 1.3 percentage points, with the strongest effects observed in areas with limited childcare availability prior to the expansion.
In Canada, while most provinces and territories have made progress in making regulated childcare more affordable, access to regulated spaces has emerged as the binding constraint. Evidence shows that the demand for licensed childcare continues to outpace supply, with pressures intensifying since 2022. Indeed, in 2023, 156,500 parents and guardians reported difficulties finding care, a 32-per-cent increase from 2020 (Auditor General of Canada 2025). In 2024, more than three-quarters of childcare centres across Canada reported having an active waitlist (Figure 9), a figure that has remained unchanged since 2022. Nova Scotia and Newfoundland and Labrador reported the highest waitlist rates.17In Newfoundland and Labrador, the Early Learning Gateway was launched on May 29, 2024, introducing a mandatory centralized waitlist. However, participating childcare centres continued to maintain their own lists, and children were often registered on an average of 11 to 12 different waitlists. Therefore, waitlist figures may overstate actual demand and are not a precise measure of unmet need. That said, rising waitlist numbers still signal growing pressure on the system and increased demand for childcare spaces. This may explain why Newfoundland saw an increase in the share of mothers with young children working part-time due to childcare responsibilities between 2019 and 2025. The situation is similar for licensed home-based childcare. Over 61 percent of all providers in Canada reported active waitlists, with PEI, New Brunswick, and Newfoundland and Labrador showing the highest rates. In PEI, every licensed home-based provider reported an active waitlist.

From the family perspective, waitlists have become increasingly common among both users and non-users of childcare. Nationally, the share of children under age six who were on a waitlist rose from 19.1 percent in 2022 to 30.8 percent in 2025 among children not in childcare, and from 16.7 percent to 23.6 percent among those already using childcare (Figure 10). This pattern suggests that unmet demand is not limited to first-time entrants but also affects families attempting to change arrangements, secure preferred locations or hours, or move into regulated care.

Provincial data show that this upward trend in waitlisting among children under age six is evident across all provinces (Figure 11). Between 2022 and 2025, the share of children who were not in childcare but were on a waitlist increased in every province. The rise was particularly pronounced in Atlantic Canada, Manitoba, and Quebec. By 2025, more than half of children in Quebec who were not in childcare were reported to be on a waitlist, while rates exceeded 40 percent in Newfoundland and Labrador and PEI. In contrast, provinces such as Alberta and Saskatchewan continued to report lower wait lists, though both experienced notable increases over the period. These patterns suggest that growing waitlists are a nationwide phenomenon, even as the intensity of access pressures differs across provincial childcare systems.

Difficulties accessing childcare were also common among families already using it. Nationally, nearly one-half of the parents and guardians who used childcare services in 2025 reported difficulty finding available care for their children under age six, up from 36.4 percent in 2019 (Figure 12). The increase was evident across all provinces, with Newfoundland and Labrador recording the largest increase. By 2025, over two-thirds of families in the province reported challenges in securing childcare.

Among the various barriers, the limited availability of childcare in smaller local communities has become increasingly problematic. The share of parents citing a lack of available care in their community rose from just over one-half (52.9 percent) in 2019 to nearly two-thirds (64.8 percent) in 2025 (Figure 13). Meanwhile, affordability concerns have declined: consistent with CWELCC’s objectives, the proportion of parents reporting difficulty finding affordable care fell from 48.3 percent to 41.9 percent in the same period. These opposing shifts appear to reflect demand pressures rather than surplus capacity. Lower fees have encouraged demand for regulated childcare, particularly in regions already facing supply shortages, intensifying competition for limited spaces.

Lower fees can also intensify demand in rural and remote areas – so-called “childcare deserts”18Childcare deserts are defined as areas where children (not yet attending kindergarten) live in a postal code with more than three children for every licensed childcare space. – where availability remains limited. In Canada, nearly one-half of young children live in childcare deserts (Friendly and Macdonald 2023). This issue is particularly acute in Saskatchewan, Newfoundland and Labrador, and Manitoba, where 92 percent, 79 percent, and 76 percent of children, respectively, live in regions lacking adequate childcare spaces.
Another structural constraint on expanding access is the ongoing pattern of licensed centre openings and closures. In Ontario, for example, 286 new licensed childcare centres entered the market in 2024/25, while 133 closed, yielding a net increase of 153 centres for the year.19See https://www.ontario.ca/page/ontarios-early-years-and-child-care-annual-report-2025#section-6. Over the past decade, this mix of openings and closures has resulted in modest net growth relative to demand, even as total spaces have risen. These closures – caused by factors such as relocation, low enrollment, business considerations, or lease issues – limit the pace at which regulated childcare can meet rising demand, thereby contributing to persistent waitlists and access gaps. Without policies that stabilize existing providers and encourage durable expansion, especially in high-need areas, the availability of childcare will continue to lag behind families’ childcare needs.
These access constraints have had tangible consequences for families’ labour supply and economic decisions. Among parents who were using childcare and experienced difficulties, more than one-third reported changing their work or study schedules in 2025, while roughly one-third postponed their return to work or reduced their working hours (Figure 14). Nearly one-quarter declined work opportunities, and more than 30 percent reported paying more for childcare than they wished, often by resorting to temporary, multiple, or informal arrangements.

Taken together, recent evidence suggests that the central challenge facing the CWELCC system has shifted from affordability to availability. Without a faster expansion of regulated spaces – particularly in high-demand regions and for centre-based care – the impact of lower childcare fees will continue to be constrained by persistent waitlists and access barriers.
Childcare Flexibility
As mentioned earlier, CWELCC’s rollout has led to a shift from informal to formal care arrangements. Most childcare centres and licensed home-based providers offer full-time and part-time schedules that cater to the needs of many families. Research on how parents search for and select childcare finds that, in addition to quality, practical concerns such as cost, hours, and schedule flexibility are among the top priorities families weigh when choosing care (Urban Institute 2024). However, centre-based care often lacks flexibility in terms of hours and days (Charters and Findlay 2023), which limits accessibility for parents working outside standard business hours.
This inflexibility is particularly significant considering that 38 percent of preschool-aged children had at least one parent who worked non-standard hours in 2016 and 2017 (i.e., evening, night, or rotating shifts), representing more than 625,000 families (Lero et al. 2021). Many of these families include single parents, parents working multiple jobs, low-income households, immigrants, and members of racialized communities who already face structural disadvantages. Their non-traditional work schedules create unique childcare needs that are poorly served by the current CWELCC system, potentially reinforcing existing inequities.
While most providers offer full-time care for children aged 12 years and under, the availability of non-standard and flexible options remains extremely limited (Figure 15). In 2024, 77.2 percent of childcare centres and 93.8 percent of licensed home-based childcare providers offered full-time care, compared with 72.1 percent of unlicensed home-based providers. However, fewer than 2 percent of childcare centres offered evening, weekend, or overnight care. Licensed home-based providers were only marginally more likely to offer such options. In contrast, unlicensed home-based providers were substantially more likely to provide care during non-standard hours, including evenings (5.4 percent), weekends (10.7 percent), and overnight (3.6 percent), as well as flexible arrangements (16.7 percent).

A key limitation of the CWELCC system is its emphasis on expanding licensed centre-based care, which may not fully accommodate families with non-standard work schedules. Although bilateral agreements commit provinces and territories to increasing access to flexible and inclusive childcare – including care outside standard business hours – ECE workforce shortages remain the primary constraint rather than regulatory exclusion alone. Progress has varied across jurisdictions as provinces and territories manage these operational realities. As a result, parents working non-standard hours have limited access to publicly funded options and often rely on unlicensed or private arrangements.
Over time, a system that channels the majority of public funding toward regulated centre-based models may reduce responsiveness to diverse scheduling needs, potentially narrowing the range of childcare options. While greater reliance on publicly funded provision can strengthen quality assurance, it also raises systemic costs – particularly if educator recruitment and retention require higher wages and enhanced professional standards. Unionization efforts in the sector reflect these workforce dynamics and may shape future fiscal pressures. Although federal infrastructure funding is available to support more flexible delivery models, provinces and territories retain primary responsibility for system design and implementation.20In Budget 2022, the federal government allocated $625 million from 2023/24 to 2026/27 for an infrastructure fund to support provinces and territories in undertaking projects that enhance inclusion within the CWELCC system. The funding may also be used to expand physical infrastructure for providers offering care during non-standard hours.
To address these gaps, provincial governments need to diversify delivery models to meet the varied needs of families with different work schedules (Boessenkool and Robson 2021).
ECE Workforce
A sufficient ECE workforce is critical to both the accessibility and quality of universal childcare. However, childcare centres across Canada continue to struggle to recruit and retain ECEs. These pressures intensified during the rapid expansion of regulated childcare following the introduction of the CWELCC agreements. Between the second quarter of 2019 and the second quarter of 2022, the number of ECE job vacancies more than doubled (Figure 16),21Due to pandemic-related disruptions, the ECE workforce reached its lowest level in early 2020 and gradually recovered between 2020 and 2022. The rise in job vacancies during this period likely reflects post-pandemic recovery dynamics, such as sectoral rebuilding, rehiring, the expansion of childcare spaces, and broader labour market tightness, rather than a large-scale exit of workers from the sector. reflecting a sharp increase in labour demand combined with a limited supply of trained workers. Although vacancies declined modestly after 2022, they remained some 60-percent higher in Q2 2025 compared to pre-pandemic levels, underscoring the structural nature of these constraints.

Between Q4 2019 and Q4 2025, ECE job vacancies rose by 33 percent nationally, while average offered hourly wages also increased by 33 percent.22Some provinces and territories have used the new federal money to raise ECE wages through the development of salary grids. However, these investments vary by province and territory. Yukon offers a minimum wage of about $31 per hour for qualified ECEs. PEI’s Early Years Centre (EYC) wage grid has increased by three times since 2019, resulting in an average wage increase of 41 percent across all levels for individuals working in EYCs. In addition, 93 percent of educators working in EYCs are certified in PEI and those with a two-year diploma earn a minimum of $29.15 per hour. Similarly, Ontario’s wage floor increased from $18 per hour in 2022 to $23.86 in 2025, and just 25 percent of its ECEs earned $25 or less in 2025. Across all occupations, however, wages grew by 33 percent, while vacancies decreased by 8 percent. This contrast points to a unique mismatch in the ECE sector, where rising wages have not been enough to fill growing gaps in labour supply.
Provincial trends reinforce this pattern but reveal important differences. In BC, ECE job vacancies decreased by roughly 50 percent between Q4 2019 and Q4 2025 while offered wages rose by about 40 percent, suggesting effective wage responsiveness.23In Q4 2025, BC offers an average hourly offered wage of $25.25 for ECEs and assistants, the highest among provinces. In contrast, Alberta experienced a nearly 98 percent surge in vacancies and only a 13 percent wage increase, implying that compensation failed to adjust to demand (Figure 17). Ontario and Quebec fall between these extremes, with vacancies rising 62 to 73 percent alongside wage growth of about 29 to 41 percent.24While Ontario and Quebec also increased average wages for ECEs at rates comparable to BC between Q4 2019 and Q4 2025, other factors likely contributed to BC’s substantial decrease in job vacancies. For instance, BC expanded funded ECE training spots at public post-secondary institutions, including part-time, online, and work-integrated programs, allowing individuals to train while remaining employed. The province also supports career development through province-wide career ladders, bursaries, and mentorship networks, as outlined in its multi-year Recruitment and Retention Strategy (2018–ongoing).

These variations suggest that persistent ECE shortages stem from multiple factors beyond wages alone. First, even after recent increases, wages for ECEs remain low – the national average offered hourly pay reached only $23.35 in Q4 2025 – limiting the sector’s competitiveness relative to occupations with similar credential requirements. Second, training and certification requirements and limited program capacity constrain the short-term supply of qualified workers. Third, changing post-pandemic job preferences and working conditions further weaken labour supply growth.
Beyond recruitment challenges, turnover and attrition are also major challenges. Positions requiring ECE-specific training have the highest turnover rates among childcare workers (Charters and Findlay 2024). In Ontario, for example, only 58.2 percent of registered ECEs were working in licensed childcare settings in 2024/25 (CECE 2025). According to the College of Early Childhood Educators, registered ECEs in licensed childcare are twice as likely to resign after three years compared to those employed in other settings (e.g., schools).25See Jones, Allison. “Government officials estimate Ontario could be short 8,500 early childhood educators.” CBC News. https://www.cbc.ca/news/canada/toronto/ontario-early-childhood-educator-shortage-1.6714274. Low pay is a primary driver, as ECEs earn significantly less than workers with comparable education in other fields. Many leave the sector for higher-paying jobs in school boards or other industries. Other factors include limited access to health benefits, pensions, paid sick leave, and personal leave (Charters and Findlay 2024). In contrast, Quebec offers a sector-wide pension plan for ECEs, which helps support workforce retention and the implementation of its universal childcare plan (Boessenkool and Robson 2021).
The shortage of ECEs has led some childcare centres to operate at reduced capacity or shut down entirely. According to Statistics Canada (2024b), 86.4 percent of childcare centres reported difficulties filling vacant staff positions in 2024, only slightly lower than 90 percent in 2022. The most frequently reported challenges included applicants’ lack of necessary skills (66.7 percent), too few applicants (62.3 percent), and insufficient related work experience (53.3 percent). These persistent hiring challenges directly affect the sector’s ability to meet rising demand, contributing to staff burnout and potentially lowering the quality of care. With an ongoing need for new childcare spaces, the demand for qualified ECEs is expected to grow.
To address these challenges, federal and provincial governments need to prioritize ECE recruitment and retention. This requires a significant investment in wages and a commitment to improving working conditions, including access to benefits and professional development opportunities. Evidence from provinces like Quebec and BC demonstrates that well-designed compensation and benefit structures can support workforce stability and enhance childcare quality.
The Cost-Benefit Analysis
This section evaluates the federal fiscal implications of the childcare plan by comparing federal public expenditures on regulated childcare with incremental federal revenues generated through increased maternal employment. The analysis focuses on mothers with children under six years of age, consistent with the CWELCC program’s primary objective of increasing labour force participation among this group.
The first step is to assess the potential employment impacts of childcare fee reductions. Our analytical framework treats childcare expenses as a cost of working, analogous to income taxes and the withdrawal of income-tested benefits. Lower childcare costs, therefore, increase expected take-home pay and strengthen incentives for labour force participation among mothers of young children. The analysis is restricted to the extensive margin (participation).26Additional labour supply channels – whether involving fathers or increases in hours among already employed mothers – are not modelled, but incorporating these margins would be unlikely to materially alter the federal fiscal balance. Childcare constraints primarily affect mothers’ decisions to enter the labour force, implying that potential employment responses among fathers are likely to be smaller, while transitions from part-time to full-time work typically generate limited incremental federal revenues relative to the scale of program expenditures. Although lower fees could, in principle, also increase hours worked among part-time employees, the supply of low-fee regulated childcare is relatively inflexible and concentrated in full-time provision. As a result, modelling intensive-margin responses is not straightforward.
Limited access to subsidized childcare also constrains behavioural responses. Mothers considering labour force entry cannot be certain in advance that they will secure a subsidized space, given waiting lists and capacity limits. Their employment decisions are, therefore, conditioned on expectations about access. To account for this, estimated childcare cost reductions are adjusted by the probability of obtaining a subsidized space, proxied by the share of young children enrolled in licensed childcare in each province and year.
We compute the percentage reduction in childcare expenses per subsidized child for each province by comparing observed centre-based childcare fees to a counterfactual fee path absent the program, defined by CPI-adjusted 2019 childcare costs. Daily full-time childcare fees for centre-based care for children under age six are drawn by province and year from Statistics Canada’s parental childcare expenses for the main childcare arrangement. These daily fees are converted to annual costs, assuming 250 days of care per year. To construct the counterfactual, observed fees are compared to province-specific childcare costs in 2019, adjusted forward using the Consumer Price Index (CPI). The percentage reduction reflects the change in annual childcare costs relative to this CPI-adjusted 2019 baseline. On average, in 2025, childcare fees are estimated to be approximately one-half of what they would have been in the absence of the program (see Table 2).27 Childcare fee reductions in this model are calculated using centre-based data due to data availability across all provinces and years. Because base-year costs for licensed home care in 2019 were somehow comparable to centre-based costs in provinces wherever available, we treat the centre-based fee reduction as a proxy for all regulated care.

Employment impacts are estimated using Statistics Canada’s Social Policy Simulation Database and Model (SPSD/M). The model is used to simulate how observed reductions in regulated childcare fees under CWELCC affect financial incentives to work, as measured by changes in participation tax rates inclusive of childcare costs and income-tested benefits. Simulations are performed on a subsample of working parents with children under age six in childcare and account for variation in earnings, spousal income, and the structure of the tax–transfer system, including personal income taxes, refundable credits, and benefit clawbacks. Estimates are produced separately by province.
Before fee reductions, all-inclusive participation tax rates average about 40 percent of employment income, implying that families retain roughly 60 percent of the earnings of a newly participating parent. With childcare fee reductions, the average participation tax rate in 2025 falls to about 33 percent. To reflect access constraints, these reductions are adjusted by provincial enrolment shares in licensed centre-based and home-based childcare, recognizing that not all families are able to benefit equally. This adjustment yields an estimate of the percentage change in net returns to work attributable to lower childcare expenses, holding other policy parameters constant.
Changes in net financial returns to work are translated into employment responses using empirically established participation elasticities with respect to net wages. While estimates vary across contexts, a large body of the literature suggests moderate responsiveness consistent with an elasticity of around 0.25, supporting the central assumption used in this analysis (see, for example, Chetty et al. 2013; Graversen 1998; Baker, Gruber, and Milligan 2019; Laurin and Milligan 2017; and Lefebvre and Merrigan 2008).
Specifically, simulated changes in net returns to work after taxes, transfers, and childcare costs are converted into proportional changes in employment rates among mothers with young children. These changes are applied to observed provincial populations to estimate employment gains between 2022 and 2025, relative to a 2019 baseline. This approach links estimated employment effects directly to policy-driven reductions in childcare costs.
SPSD/M is also used to estimate average net income tax rates by family type (single-parent and two-parent). Combined with average earnings from Labour Force Survey public-use files, these rates are used to calculate net federal income revenues by province and year. To approximate federal consumption tax revenues, an additional four percentage points are applied to reflect GST, assuming that 75 percent of incremental income is spent on taxable goods and services. These revenue components are then aggregated nationally.
Federal fiscal costs are measured using CWELCC program expenditures by province and year (see online Appendix Table A1).28Federal program costs reported in Table A1 reflect federal transfers to provinces and territories, not actual provincial spending. These transfers fund all five CWELCC pillars – affordability, accessibility, quality, inclusion, and data – and, therefore, exceed what would be implied by per-child fee reductions alone. Notably, the Auditor General of Canada (2025) found that between March 2021 and March 2024, provinces and territories spent only $12 billion of the $15 billion transferred, primarily due to delays in meeting space-creation (accessibility) and workforce-recruitment targets. As a result, the fiscal cost estimates presented here should be interpreted as an upper bound on actual public expenditure over the analysis horizon. Total public spending on childcare is estimated at $25.5 billion (constant dollars) at the national level between 2021 and 2025.
Annual federal revenues and program costs are compared to derive net fiscal impacts. All estimates are expressed in constant dollars and discounted to 2021 using a real discount rate of 3 percent, consistent with standard Canadian public-sector cost–benefit practice.
Under the baseline assumption of an elasticity of 0.25 with observed accessibility constraints, the CWELCC program is estimated to increase cumulative employment among mothers with young children by roughly 24,500 between 2022 and 2025, contributing about a 0.6-percentage-point increase in the employment rate between 2019 and 2025. The program’s net present value (revenues less costs) is negative $16.79 billion (a cumulative present-value figure over the 2021–2025 analysis horizon, discounted to 2021), with additional federal revenues and reduced transfer payments of $140 million, offsetting less than 1 percent of program costs (Table 3).29The analysis focuses on federal fiscal impacts, as provincial spending data under CWELCC and reporting practices are uneven and difficult to compare across jurisdictions, precluding a full provincial cost-benefit analysis. On the revenue side, however, the present value of incremental provincial income and sales tax revenues and reduced transfers is estimated at an additional $0.1 billion, suggesting that the consolidated fiscal picture, while improved, remains strongly negative.

As a robustness check, we examine alternative assumptions on labour supply responsiveness and childcare access. These include a higher elasticity of 0.40,30 This assumption is consistent with the upper end of estimates for highly responsive groups such as single mothers (Eissa and Liebman 1996; Meyer and Rosenbaum 2001; Blundell, Bozio, and Laroque 2011; Chetty et al. 2013). a scenario with full take-up of subsidized childcare (“no accessibility constraints”), and a combined scenario with both higher elasticity and full accessibility. Table 3 shows that employment gains increase under these scenarios, with cumulative employment reaching up to 128,000 and the 2025 employment rate rising to 74.9 percent, but the overall fiscal balance remains strongly negative.
Overall, the fiscal cost–benefit analysis suggests that CWELCC generates a substantial net fiscal cost for the federal government over the analysis horizon. Part of the reason is that the current program largely benefits working mothers who previously used unsubsidized childcare, and this change didn’t necessarily generate new employment or earnings gains. These results highlight the importance of policy design and targeting. Given the substantial fiscal cost of universal childcare subsidies, ensuring that affordable childcare reaches families for whom childcare costs constitute a binding constraint – particularly low- and middle-income mothers with young children – is critical to maximizing labour market and welfare gains.
At the same time, this short-run focus only captures part of the potential economic and fiscal impact of universal childcare. Initial increases in maternal employment may persist well beyond the early childhood years, and longer-run earnings gains – driven by greater labour market attachment, accumulated work experience, and wage growth – can exceed the initial participation effects, thereby increasing long-term fiscal benefits. Evidence from Baker, Gruber, and Milligan (2019) shows that labour supply responses to Quebec’s childcare program persisted into children’s early teen years, suggesting that the employment effects captured here in the preschool window likely understate the program’s full fiscal return. Emerging research further suggests that the labour supply impact may accelerate as mothers reach their forties, with mid-life earnings gains driving substantial additional tax revenues – a long-run fiscal offset not captured in the present analysis. To assess the long-term impact of the CWELCC system, further studies are needed.
Social Impact and Broader Welfare Effects
Beyond fiscal impacts, childcare policy that increases affordability, accessibility, and quality can also generate substantial social benefits for children, families, and communities (Armstrong 2021; Mahboubi 2018). These benefits extend well beyond government revenues and expenditures and are central to the broader rationale for public investment in early learning and childcare.
Since non-profit-licensed childcare generally provides higher-quality care, expanding this model could yield some long-term benefits. Improved access to affordable, high-quality childcare supports positive child development outcomes and may enhance children’s skill development and school readiness which could, over time, translate into stronger labour-market outcomes. These benefits are particularly important for children from disadvantaged backgrounds, for whom high-quality early learning can help narrow developmental gaps (OECD 2025). The literature shows that disadvantaged children in low-income families tend to benefit most from affordable, accessible, and high-quality childcare, both by increasing maternal employment and by promoting child development (van Huizen and Plantenga 2018, Hotz and Wiswall 2019). Thus, targeting childcare policies toward such families clearly makes sense from an economic efficiency perspective. From an equity perspective, such a policy also has the potential to reduce socioeconomic and gender disparities.
Universal childcare also changes how families allocate time between paid work, childcare, and other activities. A substantial portion of childcare is often provided by informal or unpaid caregivers such as parents, relatives, or friends. Evidence from the Canadian General Social Survey on time use shows that estimates of parental time vary widely depending on how it is measured, with total time spent with children often 2.5–3.5 times higher than the time spent on primary childcare activities alone (Fedick, Pacholok, and Gauthier 2005). This highlights that parents devote significant time to childcare alongside other tasks, which is often overlooked in standard economic measures. By reducing reliance on parental or informal care, affordable formal childcare not only enables parents and extended families to participate more fully in the labour market but also reduces time pressures and opportunity costs associated with unpaid caregiving.
Beyond individual households, broader social benefits include greater gender equity in the labour market, improved child health and safety through regulated care, and strengthened community connections facilitated by early learning centres. Over time, these effects may contribute to higher fertility intentions, stronger labour force attachment, and improved long-term outcomes for children.
Overall, the social welfare gains from affordable, accessible, and high-quality childcare are substantial but contingent. If quality erodes, access remains constrained, or expansion disproportionately benefits already advantaged families, the broader social returns will fall short of their potential. Ensuring that affordability is matched by adequate capacity, a stable childcare workforce, and inclusive access is, therefore, essential to realizing the full social value of Canada’s childcare policy.
Policy Discussion and Recommendations
Clearly, CWELCC has delivered some benefits for Canadian families and the economy. By significantly reducing regulated childcare fees and moving most provinces toward the $10-per-day target, the program has improved affordability and contributed to modest increases in maternal labour force participation, particularly in jurisdictions where childcare was previously costly or limited.
However, the system’s rollout has also revealed persistent shortcomings. While costs have fallen, demand has surged without a corresponding expansion in system capacity, creating a supply-demand imbalance that has lengthened waitlists and intensified concerns about childcare accessibility. Regional disparities in participation, coverage, and affordability remain substantial. Regulated centre-based capacity is insufficient in many areas and ECE shortages constrain service expansion. For many families, the binding barrier has shifted from affordability to availability and flexibility, particularly for those working non-standard work hours. Without accelerated and targeted capacity expansion, the fiscal returns from increased maternal labour supply will remain below their potential.
Expanding Access and Targeting Underserved Communities
To address these challenges and meet growing demand, provincial and territorial governments need to expand the number of licensed childcare spaces and prioritize their creation in underserved regions, particularly in Saskatchewan, Newfoundland and Labrador, and Manitoba, where the prevalence of childcare deserts is highest. New spaces should be targeted to communities and households most in need, including low-income, less-educated, and single-parent families with preschool-aged children.
To improve childcare accessibility, expanding the number of licensed home-based providers, in addition to increasing licensed childcare centres, can also play an important role. Home-based care offers greater flexibility and aligns with parental preferences for smaller group sizes, flexible hours, and non-standard schedules. However, it can be disrupted when the home care provider takes vacations, becomes ill, or decides to discontinue operations. Survey evidence indicates that a substantial share of families favour home- and family-oriented care over childcare centres, particularly for younger children (Saskatchewan Policy Brief 2025). Research on parental decision-making further shows that parents who prioritize practical factors – such as cost, flexibility, and hours – tend to choose home-based arrangements over centre-based care, highlighting the role of home-based options in meeting families’ real needs (Kim and Fram 2009). Home-based care can also be scaled more quickly and at a lower cost than centre-based care. These factors and findings suggest that expanding licensed home-based options could help meet unmet parental demand and increase the diversity of affordable care choices available to families.
Despite a significant increase between 2022 and 2024 (a 42.1-percentage-point rise nationally), the share of home-based providers that are licenced remains low in most regions (Figure 18).31In 2024, Canada had approximately 17,800 licensed home-based providers compared with 14,663 unlicensed ones, meaning that nearly one-half (45 percent) of home-based childcare operated outside the licensed system. In PEI, in particular, the share of licensed home-based providers is extremely small. This limited availability of licensed options may help explain, to some extent, why mothers’ participation saw almost no increase, even as the share of parents and guardians reporting difficulty finding childcare rose notably. In provinces where maternal participation was already relatively high before the program, the scope for further gains may also have been more limited. However, even there, rising waitlists and incomplete licensed space coverage suggest that unmet demand, rather than saturation of potential participants, remains the binding constraint.

These data suggest that expanding childcare capacity will require growth in both centre-based and home-based provision. However, for home-based care, the primary constraint is not demand but licensing: at the national level, a substantial proportion of providers continue to operate outside the formal system due to concerns over autonomy, regulatory complexity, and perceived costs (Figure 19). The data suggest that governments face inherent limits in influencing provider decisions, as personal preferences are the most commonly cited reason for remaining unlicensed providers. To the extent that non-licensing is related to regulatory or cost barriers, policy interventions can help, but they must be carefully balanced with the need to maintain standards that ensure quality of care.

Moreover, being licensed does not automatically make childcare affordable. Even when providers meet quality and safety standards, families may still face high fees if the provider does not participate in the CWELCC agreement. In 2024, only about one-third of licensed home-based providers nationally participated in the CWELCC agreement (compared with 71 percent of centre-based providers), limiting the extent to which fee reductions translated into effective access.32Participation rates vary widely by province and are particularly low in BC (12.9 percent) and Alberta (37.6 percent), indicating that a substantial share of licensed home-based care does not offer CWELCC-reduced fees. (See Statistics Canada, Table 42-10-0081-01).
Meanwhile, there is a significant workforce attrition problem, particularly in the unlicensed sector, which can further constrain the availability of childcare options. In 2024, among the 42.6 percent of unlicensed childcare providers serving children under age 12 who did not intend to continue offering services within the next three years, more than half cited retirement or career change as their reason (Statistics Canada 2024b). Similarly, 16.4 percent of licensed home-based providers planned to exit the sector within the same timeframe, with the majority citing the same reasons. While a certain level of attrition is expected, given that some home-based care providers offer services only while their own children are young, the substantial exit rates indicate the need to attract and retain more childcare providers to expand capacity and sustain the CWELCC system.
Across licensed childcare operators of all sizes in Ontario, accessing capital funds for expansion was a major challenge (Building Blocks for Child Care 2022). Most operators reported that their top three needs to support expansion are a substantial increase in the supply of qualified staff, guaranteed operating funding, and capital expansion grants. Therefore, governments can incentivize expansion through operating and capital grants, with allocations tied to local demand indicators such as childbirth rates per capita or identification of childcare deserts (Boessenkool and Robson 2021). Flexible demand-side support, such as one-time grants parents can direct to a provider of their choice, could further encourage service growth and innovation. Targeted assistance to offset the costs of renting or acquiring physical space for providers would also help remove key barriers to expansion (Boessenkool and Robson 2021).
While for-profit providers can respond more quickly to unmet demand, the provinces and territories need to heed Quebec’s experience. Between 2019 and 2022, about 30 percent of Quebec childcare installations (i.e., Centres de la petite enfance [CPEs] and daycares) failed the provincial educational quality assessment (VGQ 2024). Quality outcomes were significantly weaker in for-profit daycares than in non-profit CPEs, despite refundable tax credits and other measures intended to support the expansion of commercial daycare services. For-profit centres also tend to rely more heavily on unqualified staff and are more likely to fail both the quality evaluation and qualified-staff ratio requirements. Therefore, quality assurance must accompany expansion. Even when involving private providers, public funding should be conditional on meeting quality standards, maintaining qualified-staff ratios, and demonstrating equitable access, with enhanced monitoring of large for-profit operators where quality concerns are most evident.
Strengthening the Early Childhood Educator Workforce
Expansion of physical capacity will be effective only if accompanied by efforts to attract and retain qualified ECEs. Provincial governments should implement strategies to stabilize and grow the ECE workforce, including:
- To the extent budgets are available, encouraging improved compensation and benefits, including pensions, health coverage, and paid leave;
- Creating clear career pathways and professional development opportunities; and
- Fast-tracking foreign credential recognition and streamlined onboarding for qualified educators.
Addressing workforce shortages is essential not only to increase capacity but also to maintain service quality and avoid inefficiencies associated with unfilled spaces.
Supporting Families Using Non-Subsidized Care
For families relying on private, informal, or non-standard care arrangements, the federal government needs to consider a progressive, income-tested refundable tax credit similar to Quebec’s model. As proposed by Laurin and Milligan (2017), replacing the current childcare expense deduction with a more generous and progressive refundable tax credit could substantially improve labour force participation among mothers with young children. Their analysis suggests that such a change could encourage 13 to 19 percent of stay-at-home mothers to enter the workforce, while providing critical support to low-income households unable to access subsidized spaces. To be eligible for the refundable credit, children would need to be enrolled in non-subsidized childcare. This would target families who were unable to secure a subsidized space due to capacity constraints and avoid providing duplicate subsidies.
However, careful design is important. Since 2019, Ontario has implemented the Childcare Access and Relief from Expenses (CARE) tax credit33CARE can be claimed for any eligible childcare space, regardless of whether it already receives a government subsidy. See https://www.ontario.ca/page/ontario-child-care-tax-credit. to help reduce childcare costs for working families and provide greater flexibility in choosing childcare arrangements that best meet their needs. The CARE credit supplements the federal Child Care Expense Deduction but is less generous than Quebec’s model.34For more information, see https://www.revenuquebec.ca/en/citizens/tax-credits/tax-credit-for-childcare-expenses/tax-credit-rates-for-2025/ and https://www.ontario.ca/page/ontario-child-care-tax-credit. Eligible families can claim up to 75 percent of childcare expenses, with rates decreasing at higher income levels, up to a maximum of $6,000 per child under age seven. According to Ontario’s Financial Accountability Office (2019), approximately 310,000 families with children will receive the credit, with an average benefit of $1,300 per family. The labour market impact, however, is modest. The office estimates the credit could draw an additional 6,000 to 15,000 people into Ontario’s workforce, marginally increasing the labour force participation rate for core-age women from 81.5 to 81.9 percent.
Direct financial support gives families, especially those most in need, greater flexibility and choice. Quebec demonstrates that subsidized licensed care and a refundable tax credit system for non-subsidized care can co-exist effectively. Supporting non-subsidized care through refundable credits enables the creation of spaces more quickly, promotes diverse care options, and encourages innovation in delivery models. Ultimately, offering families a range of childcare choices helps ensure the system meets the diverse needs of Canadian households.
Ensuring Long-term Sustainability, Accountability, and System Coherence
The long-term success of the CWELCC system also depends on stable funding, clear accountability, and greater coherence across jurisdictions. While childcare delivery appropriately reflects provincial and territorial responsibilities, the current system exhibits substantial variation in access, service models, eligibility rules, and progress toward shared objectives. Without stronger accountability mechanisms and clearer national benchmarks, these disparities risk widening over time.
Ensuring stable, predictable, and long-term federal funding is critical to supporting provider planning, workforce retention, and sustained capacity growth. Uncertainty around future funding commitments can discourage investment in new spaces, undermine recruitment efforts, and limit innovation in service delivery. The fiscal capacity of provinces and territories is unlikely to maintain the current universal childcare system without federal support. Multi-year funding certainty is necessary and can improve system stability and strengthen incentives for provinces and territories to expand access where it is most needed. Meanwhile, provinces and territories need to develop a sustainable funding model for childcare operators to encourage their continued CWELCC participation and expansion.
While provinces and territories are required to report on how CWELCC funding is allocated and spent, reporting practices remain uneven and, in many cases, difficult to access or compare across jurisdictions. Only a few provinces – most notably Ontario – have reported this information consistently and in a publicly accessible manner. In the absence of standardized and transparent reporting, it can be difficult to assess how funding translates into expanded capacity, workforce improvements, or improved access for families in each jurisdiction. Strengthening reporting requirements and improving the accessibility and comparability of provincial data would enhance accountability and support evidence-based policy adjustments.
At the same time, greater national consistency in outcomes does not necessarily mean uniform program design. Instead, the federal government can promote accountability by establishing clear expectations around access, affordability, workforce compensation, and inclusion of underserved populations, while allowing provinces and territories flexibility in how these goals are achieved. Regular public reporting on indicators such as waitlist prevalence, childcare deserts, space creation, ECE vacancies, and service availability for non-standard hours would help ensure progress toward shared objectives and enable evidence-based course correction. Strengthening accountability and standardization in this way would help ensure that CWELCC develops into a more balanced and resilient system that benefits families across regions and populations.
Conclusion
Most provinces and territories are missing their space creation commitments, and some are falling short of the $10-per-day affordability target in 2025. Yet the federal government has continued transfers despite these failures to meet core objectives. By 2025, all jurisdictions had extended their CWLECC agreements – most for five years, although Alberta and Ontario secured only one-year extensions. While the new funding maintains current parent fees for licensed childcare and sustains access to affordable childcare, this approach raises fundamental questions about program effectiveness and fiscal sustainability.
Given the significant childcare fee reductions across Canada, maternal workforce participation has increased only modestly. This modest response partly reflects program design: many households already using regulated childcare, particularly high-income families, were simply able to substitute government-subsidized care for the market-priced care they were already paying for. For these families, CWELCC represents a financial windfall but produces minimal to no additional gains in maternal employment or child development outcomes.
Effective policy requires moving beyond universal fee reduction to a mixed approach: universal access with progressive targeting. As the OECD (2025) recommends, policies should reach everyone but concentrate resources on the most disadvantaged. Evidence shows that low-income and vulnerable families benefit most from affordable, accessible childcare, both through increased maternal employment and improved child development. These early investments reduce future costs in remedial education and social services, making targeting not just equitable but economically sound. Provinces and territories should collect and publicly report childcare participation rates for low-income families, provide targeted support to eliminate affordability barriers, and prioritize infrastructure expansion in underserved areas with high concentrations of vulnerable children.
To sustain program funding without adding budget pressures, childcare fees should be income-tested. Nordic countries demonstrate that when fees reflect the ability to pay, families accept the model as fair. Middle- and high-income families – who currently save thousands annually – would likely accept modest fee increases if quality remains high and covers inflation and operational costs. An income-based sliding scale could redirect existing funding toward vulnerable families, including those who use non-subsidized or home-based childcare, without requiring new revenue.
As the system continues to evolve, it is also essential to strengthen its impact by addressing persistent shortcomings. To that end, we recommend that the provincial and territorial governments:
- Prioritize the creation of licensed childcare spaces for underserved groups, especially low-income, less-educated, or single-parent households with preschool-aged children;
- Incentivize childcare providers to expand licensed childcare spaces in underserved areas through operating or capital grants and targeted funding mechanisms; and
- Improve wages, working conditions, and professional development opportunities to attract and retain ECEs and maintain high service quality.
For its part, we recommend that the federal government:
- Implement an income-tested, refundable tax credit similar to Quebec’s model to increase flexibility and support families using non-subsidized care and
- Ensure stable, long-term funding for the CWELCC system while promoting provincial accountability and progress toward consistent national standards.
The authors extend gratitude to Kate Koplovich, Alexandre Laurin, Jennifer Robson, and several anonymous referees for valuable comments and suggestions. The authors retain responsibility for any errors and the views expressed.
References
Armstrong, Shafeeq. 2020. “Universal access to quality childcare is good policy and a positive determinant of health. Let’s invest.” Paediatrics & Child Health 26(2): 82–84. https://doi.org/10.1093/pch/pxaa054.
Auditor General of Canada. 2025. “Canada-Wide Early Learning and Child Care System.” Report to the Parliament of Canada. Ottawa: Office of the Auditor General of Canada. https://www.canada.ca/content/dam/oag-bvg/audit-reports/documents/parl_oag_202510_02_e.pdf.
Baker, Michael, Jonathan Gruber and Kevin Milligan. 2008. “Universal Child Care, Maternal Labor Supply, and Family Well‐Being.” Journal of Political Economy 116(4): 709–745. https://doi.org/10.1086/591908.
_____________. 2019. “The Long-Run Impacts of a Universal Child Care Program.” American Economic Journal: Economic Policy 11(3): 1–26. https://www.aeaweb.org/articles?id=10.1257/pol.20170603.
_____________. Forthcoming. “Investing in Mothers? The Long-Run Impact of a Universal Childcare Program on Maternal Work and Income.” NBER.
Bauernschuster, Stefan and Martin Schlotter. 2015. “Public Child Care and Mothers’ Labor Supply: Evidence from Two Quasi-experiments.” Journal of Public Economics 123: 1-16.
Bettendorf, Leon J.H., Egbert L.W. Jongen, and Paul Muller. 2015. “Childcare Subsidies and Labour Supply– Evidence from a Dutch Reform.” Labour Economics 36: 112–123.
Blundell, Richard, Antoine Bozio, and Guy Laroque. 2011. “Labor Supply and the Extensive Margin.” American Economic Review 101(3): 482-486.
Boessenkool, Ken, and Jennifer Robson. 2021. Aggressive Incrementalism: Strengthening the Foundations of Canada’s Approach to Childcare. Commentary 595. Toronto: C.D. Howe Institute. March. https://cdhowe.org/publication/aggressive-incrementalism-strengthening-foundations-canadas-approach-childcare/.
Brilli, Ylenia, Daniela Del Boca, and Chiara D. Pronzato. 2016. “Does Child Care Availability Play a Role in Maternal Employment and Children’s Development? Evidence from Italy.” Review of Economics of the Household 14(1): 27–51. https://doi:10.1007/s11150-013-9227-4.
Building Blocks for Child Care. 2022. “How to Remove the Barriers to Child Care Expansion: A Survey of Non-Profit and Public Child Care Licensees in Ontario.” Toronto: Building Blocks for Child Care. https://b2c2.ca/wp-content/uploads/2022/11/b2c2-surveypaper-web-final-1.pdf.
Cascio, Elizabeth U., Steven J. Haider, and Helena Skyt Nielsen. 2015. “The Effectiveness of Policies that Promote Labour Force Participation of Women with Children: A Collection of National Studies.” Labour Economics 36: 64-71.
Cattan, Sarah. “Can Universal Preschool Increase the Labor Supply of Mothers?” IZA World of Labor 2016: 312. https://wol.iza.org/uploads/articles/312/pdfs/can-universal-preschool-increase-labor-supply-of-mothers.pdf.
Charters, Thomas J., and Leanne C. Findlay. 2023. “Characteristics of Child Care Centres Serving Children Aged 0 to 5 Years in Canada, 2021 to 2022.” Ottawa: Statistics Canada. https://doi.org/10.25318/36280001202300300001-eng.
_____________. 2024. “Child Care Centre Workers Serving Children Aged 0 to 5 Years in Canada, 2021 to 2022.” Ottawa: Statistics Canada. https://doi.org/10.25318/36280001202401200004-eng.
Chetty, Raj, Adam Guren, Day Manoli, and Andrea Weber. 2013. “Does Indivisible Labor Explain the Difference between Micro and Macro Elasticities? A Meta-Analysis of Extensive Margin Elasticities.” NBER Macroeconomics Annual 27(1): 1-56.
College of Early Childhood Educators (CECE). 2025. “2024 – 2025 Annual Report.” https://www.college-ece.ca/wp-content/uploads/2026/01/2024-25_Annual_Report.pdf.
Davis, Elizabeth E., Caroline Carlin, Caroline Krafft, and Nicole D. Forry. 2018. “Do Child Care Subsidies Increase Employment Among Low-Income Parents?” Journal of Family and Economic Issues 39: 662–682. https://doi.org/10.1007/s10834-018-9582-7.
Del Boca, Daniela, Silvia Pasqua, and Chiara Pronzato. 2009. “Motherhood and Market Work Decisions in Institutional Context: A European Perspective.” Oxford Economic Papers 61(Supplement 1): i147–i171. https://doi:10.1093/oep/gpn046.
Dhuey, Elizabeth. 2025. “Economic Gains from Early Childhood Education and Care: The Role of Workforce Participation. Early Childhood Education in the Public System.” Encyclopedia on Early Childhood Development. https://www.child-encyclopedia.com/pdf/expert/early-childhood-education-public-system/according-experts/economic-gains-early-childhood-education.
Eissa, Nada, and Jeffrey B. Liebman. 1996. “Labor Supply Response to the Earned Income Tax Credit.” Quarterly Journal of Economics 111(2): 605-637.
Employment and Social Development Canada (ESDC). 2025a. “Toward $10-a-day: An Early Learning and Child Care Backgrounder.” https://www.canada.ca/en/employment-social-development/news/2025/03/toward-10-a-day-an-early-learning-and-child-care-backgrounder0.html.
_____________. 2025b. “Progress and impact of Canada-wide Early Learning and Child Care.” https://www.canada.ca/en/employment-social-development/programs/early-learning-child-care/progress-impact.html.
Fedick, Cara B., Shelley Pacholok, and Anne H. Gauthier. 2005. “Methodological issues in the estimation of parental time – Analysis of measures in a Canadian time-use survey.” International Journal of Time Use Research 1(2); 67-87. https://dx.doi.org/10.13085/eIJTUR.2.1.67-87.
Financial Accountability Office of Ontario. 2019. Child Care in Ontario: A Review of Ontario’s New Child Care Tax Credit and Implications for Ontario’s Labour Force. Toronto: Financial Accountability Office of Ontario. https://fao-on.org/en/report/childcare-ontario-2019/.
Fortin, Pierre, Luc Godbout, and Suzie St-Cerny. 2012. “Impact of Quebec’s Universal Low-Fee Childcare Program on Female Labour Force Participation, Domestic Income, and Government Budgets.” Toronto: Atkinson Centre for Society and Child Development. https://www.oise.utoronto.ca/home/sites/default/files/2024-02/impact-of-quebec-s-universal-low-fee-childcare-program-on-female-labour-force-participation.pdf.
Friendly, Martha, et al. 2020. “Early Childhood Education and Care in Canada 2019.” Toronto: Childcare Resource and Research Unit.
Friendly, Martha, and David Macdonald. 2023. “Not Done Yet: $10-a-Day Child Care Requires Addressing Canada’s Child Care Deserts.” Ottawa: Canadian Centre for Policy Alternatives. https://www.policyalternatives.ca/news-research/not-done-yet/.
Givord, Pauline and Claire Marbot. 2015. “Does the Cost of Child Care Affect Female Labor Market Participation? An Evaluation of a French Reform of Childcare Subsidies.” Labour Economics 36: 99–111.
Graversen, Brian Krogh. 1998. “Labour Supply and Work Incentives.” Aarhus School of Business Working Paper.
Guèvremont, Anne, and Leanne Findlay. 2023. “Estimates of Parental Child Care Expenses in January to February 2022.” Ottawa: Statistics Canada. https://doi.org/10.25318/36280001202300700001-eng.
Haeck, Catherine, Pierre Lefebvre, and Philip Merrigan. 2015. “Canadian Evidence on Ten Years of Universal Preschool Policies: the Good and the Bad.” Labour Economics 36: 137–157.
Hardoy, Inés, and Pål Schøne. 2013. “Enticing Even Higher Female Labour Supply: The Impact of Cheaper Day Care.” Review of Economics of the Household 123: 1–22. doi:10.1007/s11150-013-9215-8.
Havnes, Tarjei, and Magne Mogstad. 2011. “Money for Nothing? Universal Child Care and Maternal Employment.” Journal of Public Economics 95(11–12): 1455–1465. https://doi:10.1016/j.jpubeco.2011.05.016.
Hotz, V. Joseph, and Matthew Wiswall. 2019. “Child Care and Child Care Policy: Existing Policies, Their Effects, and Reforms.” The Annals of the American Academy of Political and Social Science 686(1): 310-338. https://doi.org/10.1177/0002716219884078.
Lefebvre, P., and P. Merrigan. 2008. “Child-Care Policy and the Labor Supply of Mothers with Young Children: A Natural Experiment from Canada.” Journal of Labor Economics 26(3): 519–48.
Kim, Jihyun, and Margaret S. Fram. 2009. “Profiles of Choice: Parents’ Patterns of Priority in Child Care Decision-Making.” Early Childhood Research Quarterly 24(1). https://doi.org/10.1016/j.ecresq.2008.10.001.
Kottelenberg, Michael J., and Steven F. Lehrer. 2017. “Targeted or Universal Coverage? Assessing Heterogeneity in the Effects of Universal Child Care.” Journal of Labor Economics 35(3): 609-653.
Laurin, Alexandre, and Nicholas Dahir. 2022. Softening the Bite: The Impact of Benefit Clawbacks on Low-Income Families and How to Reduce It. Commentary 632. Toronto: C.D. Howe Institute. November. https://cdhowe.org/publication/softening-bite-impact-benefit-clawbacks-low-income-families-and-how-reduce.
Laurin, Alexandre, and Kevin Milligan. 2017. Tax Options for Childcare that Encourage Work, Flexibility, Choice, Fairness and Quality. Commentary 481. Toronto: C.D. Howe Institute. May. https://cdhowe.org/publication/tax-options-childcare-encourage-work-flexibility-choice-fairness-and-quality.
Lefebvre, Pierre and Philip Merrigan. 2005. “Low-Fee ($5/Day/Child) Regulated Childcare Policy and the Labor Supply of Mothers with Young Children: A Natural Experiment from Canada.” Cahiers du CIRPÉE 05-08. https://depot.erudit.org//id/002038dd.
_____________. 2008. “Child-Care Policy and the Labor Supply of Mothers with Young Children: A Natural Experiment from Canada.” Journal of Labor Economics 26(3): 519–48.
Lefebvre, Pierre, Philip Merrigan and Francis Roy-desrosiers. 2011. “Quebec’s Childcare Universal Low Fees Policy 10 years after: Effects, Costs, and Benefits.” Montreal: CIRPÉE Working Paper 11-01.
Lero, Donna S., et al. 2021. “Non-Standard Work and Child Care in Canada: A Challenge for Parents, Policy Makers, and Child Care Provision.” Toronto: Childcare Resource and Research Unit and University of Guelph.
Manitoba Inc. 2023. “Survey Shows Childcare Helps Employee Retention, Reduces Absenteeism.” Manitoba Inc. September 18. https://manitoba-inc.ca/survey-shows-childcare-helps-employee-retention-reduces-absenteeism/.
Meyer, Bruce D., and Dan T. Rosenbaum. 2001. “Welfare, the Earned Income Tax Credit, and the Labor Supply of Single Mothers.” Quarterly Journal of Economics 116(3): 1063-1114.
Morrissey. Taryn W. 2017. “Child Care and Parent Labor Force Participation: A Review of the Research Literature.” Review of Economics of the Household 15: 1–24. https://doi.org/10.1007/s11150-016-9331-3.
Nollenberger, Natalia and Núria Rodríguez-Planas. 2015. “Full-time Universal Childcare in a Context of Low Maternal Employment: Quasi-experimental Evidence from Spain.” Labour Economics 36: 124–136.
OECD. 2025. “Reducing Inequalities by Investing in Early Childhood Education and Care.” Starting Strong. OECD Publishing, Paris. https://doi.org/10.1787/b78f8b25-en.
Pasolli, Kelly Erica. 2015. “Comparing Child Care Policy in the Canadian Provinces.” Canadian Political Science Review 9(2): 63–78. https://doi.org/10.24124/c677/2015541.
Schirle, Tammy, Ana Ferrer, and Annie (Yazhuo) Pan. 2022. “Uneven Odds: Men, Women and the Obstacles to Getting Back to Work with Kids.” E-Brief. C.D. Howe Institute. https://cdhowe.org/publication/uneven-odds-men-women-and-obstacles-getting-back-work-kids.
Saskatchewan, University of. 2025. “What child care do parents really want?” School of Public Policy. https://www.schoolofpublicpolicy.sk.ca/research-ideas/publications-and-policy-insight/policy-brief/what-child-care-do-parents-really-want.php#:~:text=As%20can%20be%20seen%2C%20a,a%20home%20and%20family%20option.&text=Figure%204%20shows%20the%20results,under%20two%2Dthirds%20of%20respondents.
Simintzi, Elena, Sheng-Jun Xu and Ting Xu. 2024. “The Effect of Childcare Access on Women’s Careers and Firm Performance.” Kenan Institute of Private Enterprise Research Paper No. 4162092. https://ssrn.com/abstract=4162092.
Statistics Canada. 2025. “Canadian Survey on the Provision of Child Care Services, 2024.” Ottawa: Statistics Canada. https://www150.statcan.gc.ca/n1/daily-quotidien/250319/dq250319b-eng.htm.
UNICEF and International Labour Organization (ILO). 2022. Providing Childcare for Workers Boosts Their Productivity: Study Results. Cairo: International Labour Organization.
Urban Institute. 2024. “Parental Search and Selection of Child Care and Early Education: A Literature Review.” Washington, DC: Urban Institute. https://www.urban.org/sites/default/files/2024-05/Parental%20Search%20and%20Selection%20of%20Child%20Care%20and%20Early%20Education-%20A%20Literature%20Review.pdf.
van Huizen, Thomas, and Janneke Plantenga. 2018. “Do Children Benefit from Universal Early Childhood Education and Care? A Meta-Analysis of Evidence from Natural Experiments.” Economics of Education Review 67: 1–16. https://doi.org/10.1016/j.econedurev.2018.08.001.
Vérificateur général du Québec (VgQ). 2024. “Qualité des services de garde éducatifs à l’enfance: Audit de performance. Rapport du Vérificateur général du Québec à l’Assemblée nationale pour l’année 2023-2024, Chapitre 4.” Québec: Vérificateur général du Québec. https://www.vgq.qc.ca/Fichiers/Publications/rapport-annuel/208/VGQ_mai2024_ch4_Qualite_SGEE.pdf.
Vuri, Daniela. “Do Childcare Policies Increase Maternal Employment?” IZA World of Labor 2016: 241. https://wol.iza.org/uploads/articles/241/pdfs/do-childcare-policies-increase-maternal-employment.pdf.