






by Mawakina Bafale and Peter MacKenzie
- Canada’s high household debt warrants concern, but the aggregate data do not point to a systemic debt crisis. The debt-service ratio (DSR), a more timely measure of financial strain than the debt-to-income ratio, has eased from its 2023 peak and sits slightly below its pre-pandemic level. Canada’s DSR is also not an international outlier, and the financial system has absorbed the recent rate cycle without widespread distress.
- National averages, however, conceal acute financial strain among particular groups. Lower-income households are increasingly spending more than their disposable income, while younger Canadians report greater difficulty meeting debt obligations. Pressure is also concentrated among highly leveraged homeowners in Toronto and Vancouver renewing mortgages at higher rates. Rising insolvencies are another warning sign, but existing data cannot distinguish cash-flow problems from cases in which debts exceed assets.
 Policy should target these pockets of vulnerability rather than treat household debt as an economy-wide emergency. Policymakers should retain mortgage underwriting guardrails, make longer mortgage terms more viable, expand housing and economic opportunity beyond today’s supply-constrained markets, and improve insolvency data to distinguish between cash-flow and balance-sheet distress.
 Policy should target these pockets of vulnerability rather than treat household debt as an economy-wide emergency. Policymakers should retain mortgage underwriting guardrails, make longer mortgage terms more viable, expand housing and economic opportunity beyond today’s supply-constrained markets, and improve insolvency data to distinguish between cash-flow and balance-sheet distress.
The authors extend gratitude to Colin Busby, Alex Ciappara, Philip Cross, Nicholas Dahir, Dave Longworth, William B.P. Robson, and Mark Zelmer, and several anonymous referees for valuable comments and suggestions. The authors retain responsibility for any errors and the views expressed.
Introduction
Canada’s heavily indebted household sector has now been tested by the sharpest interest-rate tightening cycle in a generation, offering a clearer picture of where the risks actually lie. The House of Commons Standing Committee on Finance convened this spring to examine household debt in Canada, reflecting renewed concern about the financial health of Canadian households. Canada has the highest household debt levels in the G7 (Statistics Canada 2024). Consumer insolvencies, which include both bankruptcies and consumer proposals, are also rising.11 Consumer insolvencies rose from 123,233 filings in 2023 to 137,295 in 2024 and 140,457 in 2025, the highest since 2009, and in April 2026 were close to their highest since the financial crisis (St-Arnaud and Kacoutie 2026a). See Office of the Superintendent of Bankruptcy Canada. 2026. “Insolvency Statistics in Canada – 2025.” These are important warning signs, but they do not by themselves establish a systemic debt crisis.
At the aggregate level, Canadian households can still finance their debt. The share of disposable income absorbed by principal and interest payments is elevated but within its historical range, helped by mortgage underwriting rules that required borrowers to qualify at rates above their contract rate. The average nevertheless masks a pronounced distributional split. Income and wealth gains at the top of the distribution are large enough to hold the national numbers up, while younger Canadians, lower-income households, and highly leveraged homeowners in Toronto and Vancouver are under severe and intensifying strain. The Canadian economy is doing well enough on average to conceal pockets of acute stress.
Against this backdrop, the widely cited headline debt stocks cannot tell the whole story. The debt-to-income ratio measures the stock of debt households carry relative to their income and is a good gauge of longer-term vulnerability. It roughly doubled between 1990 and 2022 as interest rates fell, and at about 176 percent of disposable income today it means that any rise in rates or fall in income translates into larger payments. A household that increases its income will naturally increase the absolute value of its debt (OECD 2018), so the stock matters mainly for what it implies about resilience. The household debt-service ratio (DSR), which measures the share of disposable income committed to principal and interest payments, shows how heavily current debts weigh on household budgets. For household financial health, what matters is the cost of servicing debt. Kronick and Ambler (2020) show the DSR is among the most reliable leading indicators of financial crisis in Canadian data. It is therefore the indicator to watch most closely when interest rates are rising or a large volume of loans is renewing, as is the case now, because higher rates then pass through to required payments. On the DSR, the aggregate picture is one of pressure that rose through the 2022 to 2024 rate cycle but remains below its 2023 peak.
This E-Brief finds that pressure is concentrated among highly leveraged homeowners in Toronto and Vancouver renewing mortgages at higher rates than when their loans originated; younger Canadians carrying unsecured debt without the offsetting home-equity gains of older cohorts; and lower-income households that are increasingly dissaving. The rise in insolvency filings likely reflects the same distributional story. However, published statistics do not distinguish between households that cannot meet monthly payments out of current income (cash-flow insolvency) and those whose debts exceed their assets (balance-sheet insolvency). Cash-flow-insolvent households may be able to sell their homes and remain above water, while balance-sheet-insolvent households are in a much worse financial position.
This diagnosis leads to three recommendations. First, policymakers should reduce highly leveraged borrowers’ exposure to rate resets by keeping the mortgage underwriting guardrails that worked through this cycle and by exploring an amendment to the Interest Act 22 Interest Act, RSC 1985, c I-15. so that longer mortgage terms become viable. Second, governments should let housing and investment follow economic opportunity by allowing more housing where the jobs are and building the capacity of a small number of mid-sized cities (Kronick and Beaudry [2025] discuss Kamloops, London, and Kitchener-Waterloo as examples) to compete for workers and firms. Third, the Office of the Superintendent of Bankruptcy (OSB) should publish statistics that distinguish cash-flow insolvency from balance-sheet insolvency, since the two call for different policy responses.
Looking Beyond Household Debt Levels
Debt-to-disposable-income was below 100 percent in the early 1990s and crossed that mark in late 1993. It climbed steadily through the 1990s and 2000s to reach about 160 percent in 2009 during the financial crisis. It kept rising at a slower pace to about 186 percent in 2019, and the ratio fell in 2020 as pandemic support payments lifted disposable income. It then rose from about 166 percent to a peak of 188 percent in the third quarter of 2022. The ratio subsequently declined through 2024, rose for five consecutive quarters as debt grew faster than disposable income and eased to 176.4 percent in the second quarter of 2026.
The long-run increase coincided with a period, beginning in the 1990s,33 The policy rate fell from about 14 percent in 1990 to 0.25 percent in 2009 and again in 2020. when interest rates trended downward and households could rationally borrow more because lower borrowing costs allowed them to carry larger debts for similar monthly payments (Kronick and Ambler 2020). The policy rate sits at 2.25 percent at the time of writing, well above its pandemic low, so the debt accumulated now costs more to service.
Lower borrowing costs rationally led households to take on more debt, while the 35-year secular decline in interest rates contributed to higher asset prices, including housing, equities, and other assets. That era appears to be over, with policy rates above their pandemic-era lows and long-term bond yields having moved up across advanced economies. The debt accumulated over those decades therefore matters because its size determines how much a given rate increase adds to payments. This is why we argue that policymakers should be concerned less with aggregate ratios than with individuals’ ability to finance their debt. The debt-to-income ratio moves slowly and records the exposure that has built up, while the DSR responds within a few quarters when rates rise and loans renew, which makes it the more timely signal of strain in periods like the present.
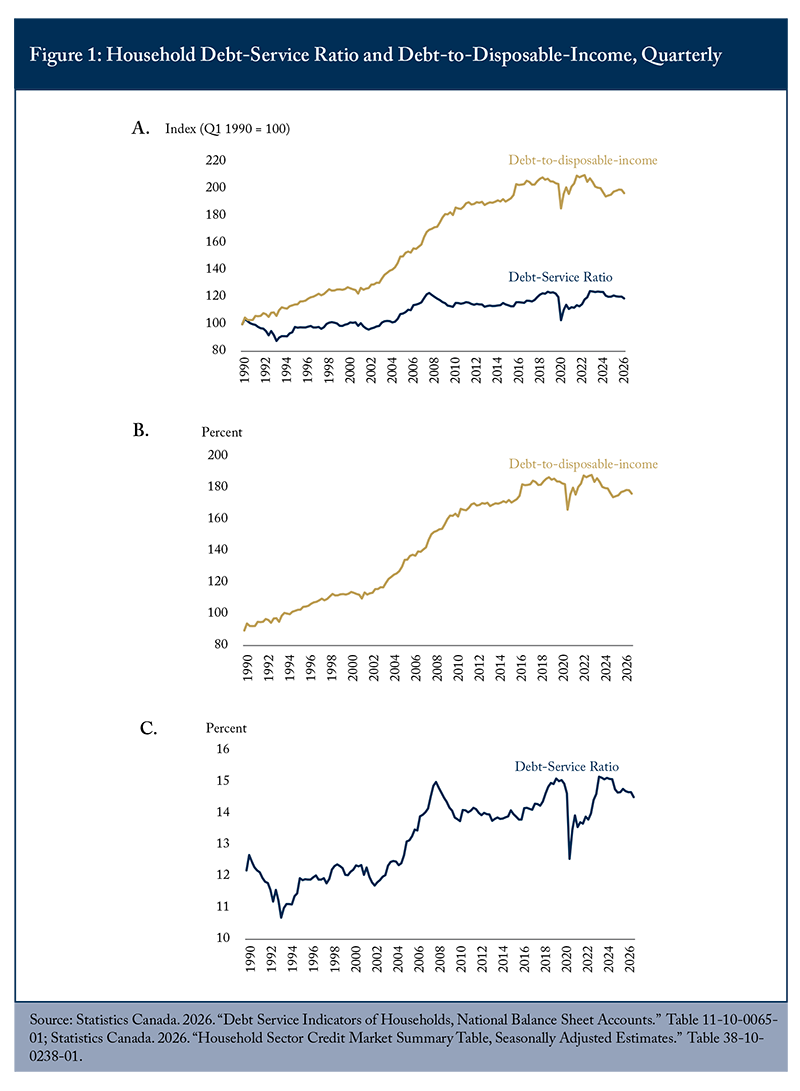
Panel A of Figure 1 indexes the debt-service ratio and debt-to-disposable-income to a common base so their relative movements are comparable. Panels B and C show each series as a percentage, corresponding to the levels discussed in the text.
The DSR averaged about 12.3 percent between 1990 and 2007 and rose sharply in the run-up to the 2008 financial crisis. It has remained elevated since, apart from the pandemic dip in 2020, and climbed to an all-time high during the post-2022 rate-hike cycle (Figure 1).
The DSR fell to 12.6 percent in the second quarter of 2020 as pandemic-era payment deferrals took effect, climbed to a record 15.2 percent in 2023 as the Bank of Canada’s rate hikes flowed through to mortgage renewals, and then eased to 14.7 percent in the fourth quarter of 2025. It fell further to 14.5 percent in the second quarter of 2026 as payments grew slower than income, leaving the ratio slightly below its pre-pandemic level of 15 percent.
The relatively contained increase in required payments partly reflects households extending amortization periods or loan terms, which reduces the immediate cash-flow shock but leaves borrowers indebted for longer (St-Arnaud and Kacoutie 2026b). Most fixed-rate mortgages taken out before 2022 carried five-year terms, so higher policy rates have reached households gradually. The 2023 and 2024 vintages skewed toward shorter one- to three-year fixed terms as borrowers anticipated rate cuts, pulling those renewals into the same window. Although the largest part of the renewal wave has passed, about 12 percent of all outstanding mortgages are pandemic-rate mortgages still due to renew, with payments expected to rise roughly 15 percent. These borrowers remain exposed, and the adjustment will continue through 2027 (Bank of Canada 2026).
This renewal arithmetic implies an increase in aggregate scheduled payments of less than 2 percent, equivalent to about a quarter of a percentage point on the debt-service ratio, spread over 2026 and 2027. Nominal disposable income growth, if it continues at recent rates, would offset most of this increase.
The banking sector absorbed the pandemic shock, helped by the same federal transfers that supported household incomes. Canadian banks and non-bank financial institutions were generally resilient to severe solvency and liquidity shocks (IMF 2025). Successive reports of the C.D. Howe Institute’s Domestic Stability Buffer Council, which provides an independent assessment of the direction for the buffer, also found no signs of severe stress in the financial system.44 See C.D. Howe Institute Domestic Stability Buffer Council. 2025. “Sluggish, Not Stressed, But Elevated Risks: Council Recommends Leaving Buffer at 3.5 Percent.” Council Report. November 20. https://cdhowe.org/publication/sluggish-not-stressed-but-elevated-risks-council-recommends-leaving-buffer-at-3-5-percent/; and C.D. Howe Institute Domestic Stability Buffer Council. 2026. “Split Vote as Risks Worsen: Council Recommends Holding Buffer at 3.5 Percent, but Urges Readiness to Act Fast.” Council Report. June 3. https://cdhowe.org/publication/split-vote-as-risks-worsen-council-recommends-holding-buffer-at-3-5-percent-but-urges-readiness-to-act-fast/. By requiring borrowers to qualify at rates above their contract rate, the Office of the Superintendent of Financial Institutions’ (OSFI) Guideline B-20 and the federal mortgage stress test limited the loosening of lending standards during the low-rate years. Meanwhile, federally backed insurance on low-equity mortgages and full recourse on most mortgages meant that households largely bore the cost of rate increases through forgone consumption and longer indebtedness, rather than lenders through their balance sheets. The household debt problem is real, but it is concentrated among the specific groups documented below.
Canada’s Debt-Service Burden in International Perspective
The Bank for International Settlements’ (BIS) DSR database enables cross-country comparisons of household balance sheets by applying a unified methodology to 17 advanced economies with quarterly updates.55 Bank for International Settlements. 2026. “Debt Service Ratios.” September 14. data.bis.org/topics/DSR. Absolute levels are hard to compare across countries because the methodology holds maturities and other institutional features fixed,66 The BIS formula applies a single assumed average remaining maturity of 18 years across countries and holds it constant over time, rather than using observed, country- and time-specific repayment schedules (Drehmann et al. 2015). but movements within a country and the broad ranking of countries are reliable. The comparators in Figure 2 are some of Canada’s usual G7 peers with available BIS coverage, plus Australia and Norway, whose predominantly floating-rate mortgage markets mark the fast end of rate pass-through.
By that measure, Canada does not sit as a global outlier (Figure 2). Levels also differ across countries for structural reasons. Mortgage markets differ in how quickly policy-rate changes pass through to borrowers, so a given tightening shows up in household budgets within a few years in some systems and barely at all in others. In the most recent BIS data, Canada’s 14 percent sits below Australia’s 15.7 and Norway’s roughly 20.9, but well above the United States, the United Kingdom, France, and Germany, where ratios sit at or near multi-decade lows.77 The BIS series for the United States produces a lower level than the Federal Reserve’s domestic measure due to methodological differences in assumed maturity; time-series movements remain comparable. Canada’s five-year mortgage term, Australia’s floating-rate-dominated market, and Norway’s loans tied to interbank benchmarks all transmit policy rate changes to household budgets within a few years.
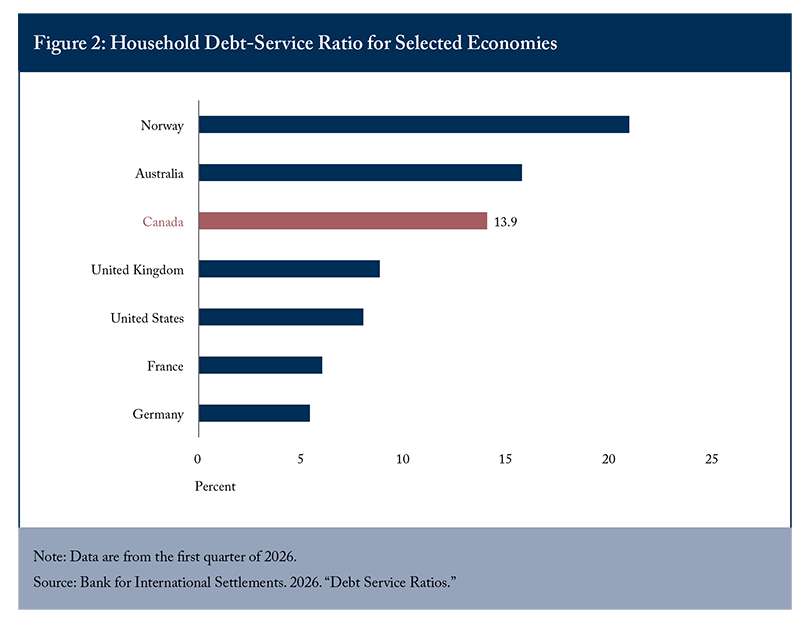
These structural differences explain why the Canadian DSR responds visibly to rate cycles while economies with longer fixed-rate mortgages absorb the same shocks more slowly. Between rate cycles, Canada’s DSR has been broadly stable since 2010.
The debt-to-income measure also fails to capture where credit risk among the riskiest borrowers ultimately sits. In Canada, mortgages with a loan-to-value ratio above 80 percent – the limited-equity segment most exposed at renewal – must by law carry mortgage default insurance, backed by the Canada Mortgage and Housing Corporation (CMHC) or private insurers that carry a federal guarantee.
Much of the credit risk on low-equity borrowers (the tail of the distribution) therefore shifts to the federal government, although the loans remain on lender balance sheets, with insurance reducing the regulatory capital lenders must hold against them. That insurance is written under tight underwriting, a qualifying-rate stress test, and, in most provinces, full recourse. This helps explain why the rate cycle passed through to household cash flows, as reflected in the DSR, without producing system-level distress.
Where Household Financial Stress Is Concentrated
The Average Conceals the Split
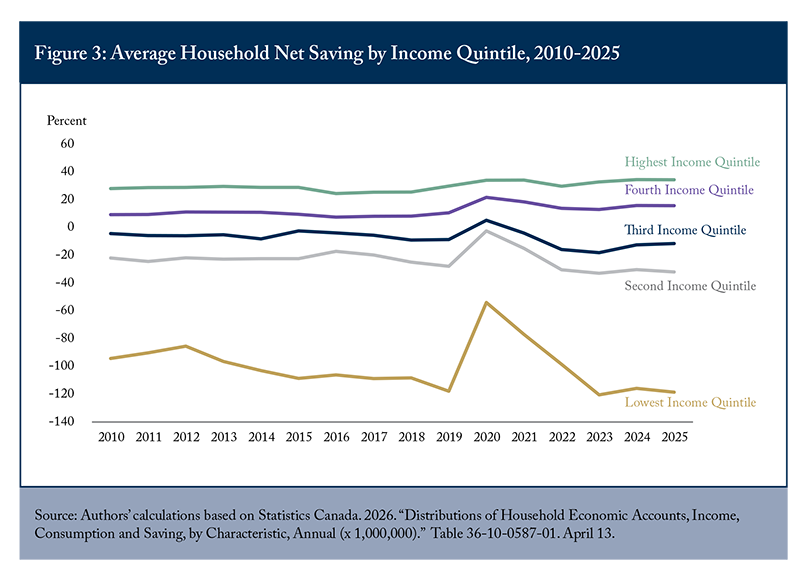
Aggregate measures obscure how sharply household financial outcomes have diverged across income groups. The Canadian economy has exhibited a K-shaped recovery, with economic and financial outcomes diverging across income groups – a growing pattern across North America. In 2025, households in the highest income quintile saved 34 percent of their disposable income and those in the fourth quintile 16 percent (Figure 3). The middle, second, and lowest quintiles, by contrast, recorded net saving rates of -12, -32, and -119 percent, respectively. In other words, the average household in the middle quintile spent 12 percent more than its disposable income, the second quintile 32 percent more, and the lowest quintile more than twice its disposable income. The gap is financed by drawing down savings, selling assets, or borrowing.88 In the lowest quintile, this partly reflects older households drawing on accumulated wealth, such as pension assets, rather than relying on wages. Since 2010, saving rates have risen in the top two quintiles and fallen in the bottom three. The pandemic widened the gap: every quintile saved more in 2020, but by 2023 the bottom three had fallen below their pre-pandemic rates while the top two remained above theirs. That pattern persisted in 2025 (Statistics Canada 2026a).
Negative net saving does not by itself establish insolvency, as households may draw down assets or borrow to smooth consumption. As we saw above, a saving rate below 0 percent means measured consumption exceeds disposable income. But persistent dissaving reduces their capacity to absorb a mortgage renewal, job loss, or unexpected expense. The aggregate saving rate can therefore appear relatively stable (4.3 percent in 2010 and 4.9 percent in 2025 on this measure) even while financial resilience is moving in opposite directions across the income distribution. This is the arithmetic behind our central claim that saving at the top offsets dissaving at the bottom in the national accounts, so the average conceals the split.
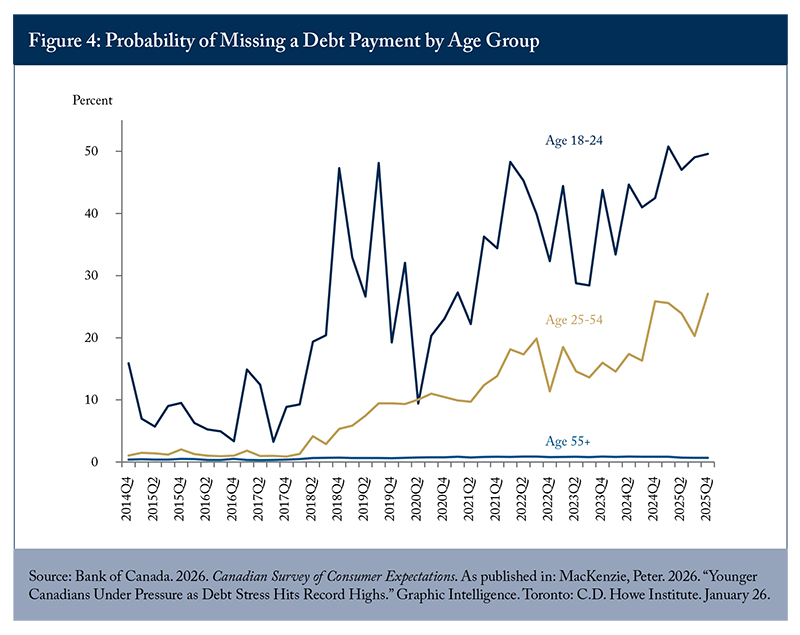
The divergence also runs across generations (Figure 4). The Bank of Canada’s Canadian Survey of Consumer Expectations asks respondents to report the probability that they will miss a debt payment over the next three months. In the fourth quarter of 2025, Canadians aged 25 to 54 reported a record 27 percent probability, and respondents aged 18 to 24 reported close to 50 percent. Respondents aged 55 and older reported 0.7 percent (Bank of Canada).[mfn9 Bank of Canada. 2026. Canadian Survey of Consumer Expectations. As published in: MacKenzie, Peter. 2026. “Younger Canadians Under Pressure as Debt Stress Hits Record Highs.” Graphic Intelligence. Toronto: C.D. Howe Institute. January 26.[/mfn]
This generational divergence coincides with record aggregate household net worth. Canadian household net worth rose to just over $19.1 trillion in the second quarter of 2026, but this increase accrued largely to the top 20 percent of households, and younger Canadians who do not yet own homes have participated little in the gains (Statistics Canada 2026b). The burden of debt service therefore falls disproportionately on two groups: the first is highly leveraged homeowners heavily concentrated in Toronto and Vancouver renewing mortgages at higher rates than when their loans were originated, a point we return to later. The second is younger Canadians carrying credit card and other unsecured debt who have not accumulated the home-equity gains held by older cohorts.
A similar distributional question arises in the insolvency data, but the published statistics do not allow it to be answered. The Office of the Superintendent of Bankruptcy reports monthly volumes of consumer proposals and bankruptcies, along with a periodic Canadian Consumer Debtor Profile, but does not separate cash-flow insolvency from balance-sheet insolvency (Ambler and Kronick 2019).910 Because a consumer proposal lets a debtor repay part of what is owed without liquidating assets such as a home, the published proposal-versus-bankruptcy split does not reveal whether filers are actually balance-sheet insolvent (Ambler and Kronick 2019).
The distinction matters for policy. A cash-flow insolvent household with substantial home equity is often best served by refinancing or temporary payment relief, while a balance-sheet insolvent household requires debt restructuring. The OSB collects the underlying information but does not publish the split.1011 See Office of the Superintendent of Bankruptcy Canada. 2025. Canadian Consumer Debtor Profile 2024; previous edition: Canadian Consumer Debtor Profile 2021. Without it, neither policymakers nor outside analysts can determine whether the recent rise in filings reflects mortgage renewals squeezing otherwise solvent households or a deeper erosion of household balance sheets.
Geographic Considerations: Household Financial Strain in Major Housing Markets
Economic opportunity in Canada is concentrated in a small number of expensive cities, particularly Toronto and Vancouver, where housing supply has not kept pace with population and income growth. Individuals, whether newcomers or Canadians, who move to these cities for work take on larger mortgages than they would in less supply-constrained markets, joining the highly leveraged segment of the distribution. The pattern appears to extend to metropolitan regions across the Organisation for Economic Co-operation and Development (OECD), as households in these regions spend much more than the national average to cover their housing costs.1112 See regional disparities in housing costs: https://www.oecd.org/en/topics/housing.html.
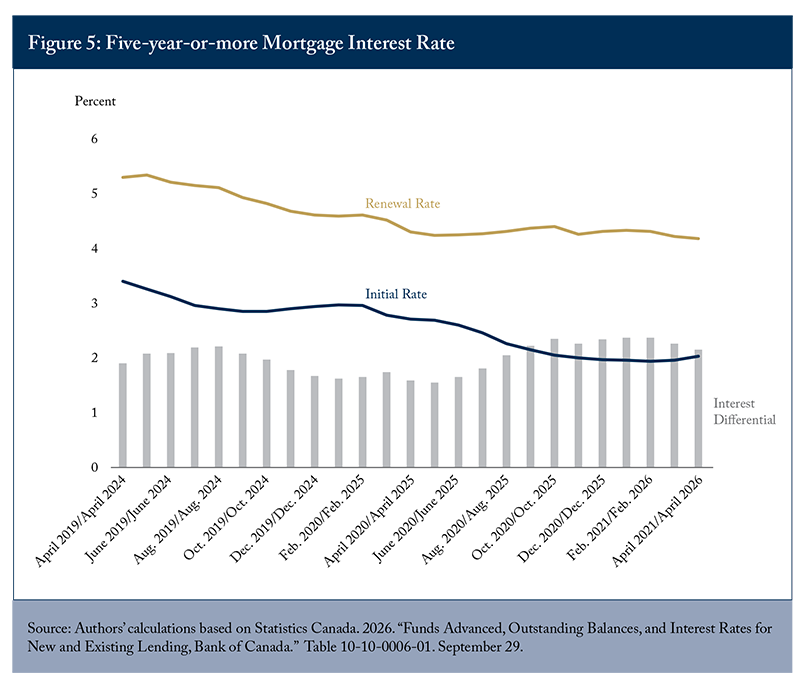
The strain is already visible: mortgage arrears in the Toronto area have more than quadrupled from their post-pandemic lows, and the Bank of Canada finds renewal stress most acute among Toronto borrowers who took out mortgages in 2022/23, with pressures greatest in the Toronto and Vancouver condominium markets (Bank of Canada 2026; CMHC 2026). That stress is compounded by the rate cycle (Figure 5). Borrowers who locked in near 2 percent in 2020/21 are renewing at roughly twice that today, lifting payments sharply for a cohort that borrowed at the peak of the market. As long as the best-paying jobs remain concentrated in these two supply-constrained markets, new entrants will keep joining the leveraged tail, and the tail-risk problem will be structural rather than cyclical.
Standard demand-side responses (taxes on foreign buyers, restrictions on investor mortgages, first-time-buyer incentives) can redistribute pressure across buyers but cannot reduce it because they do not address the supply constraint. Kronick and Beaudry (2025) argue that adding supply only in Canada’s largest cities will not resolve affordability either. Marginal improvements in Toronto or Vancouver draw migration from smaller centres, and the national price gap is sustained. A durable response therefore works on the supply side in two ways: more housing where the jobs are and, over a longer horizon, more cities with the labour-market depth, infrastructure, and amenities to compete internationally for workers and firms.
Policy Recommendations
Reduce Leveraged Borrowers’ Exposure to Rate Resets
The rate cycle reached household budgets through renewals. Most Canadian mortgages reprice every five years or sooner, so a rise in rates passes through within a few years. When a homeowner has high debt relative to income, this short pass-through period can be especially challenging. The federal government and OSFI should therefore keep the minimum qualifying rate and the loan-to-income (LTI) limits OSFI introduced in 2025, which cap the share of each lender’s new uninsured mortgages that exceed 4.5 times the borrower’s income. The qualifying rate tests whether a borrower can service the debt, while the LTI limit constrains its size, guarding against a build-up of highly leveraged borrowers in low-rate environments.
The federal government should explore making mortgage terms longer than five years viable, thereby reducing pass-through risk. If more borrowers locked in for longer, fewer mortgages would reprice in any one rate cycle, directly slowing the pass-through (Poloz 2019). Such terms are rare: just 2 percent of mortgages issued in 2018 were fixed-rate loans with terms over five years (Poloz 2019). In April 2021, about 400 borrowers chose a 10-year term, compared with roughly 80,000 who chose a five-year term (Rogers 2024). The main reason is section 10 of the Interest Act, which lets borrowers repay a mortgage at any time after its fifth anniversary with a penalty of no more than three months’ interest. Lenders must price that open option into the rate, making long terms uncompetitive (Jean and Figueiredo 2024).
Ottawa should amend section 10 so that lenders can charge a full prepayment penalty after year five, while preserving a short redemption window for borrowers, such as 30 days once every five years, during which the penalty stays capped at three months’ interest (Feldman 2020). Provinces with parallel legislation, such as Ontario’s Mortgages Act, would need to follow.
Broaden the Geography of Economic Opportunity
The persistent source of the leveraged tail is the gap between where the best-paying jobs are and where housing can be built. Toronto and Vancouver draw workers and firms for reasons beyond the size of their labour markets, including dense networks of employers and suppliers, universities, and amenities that people value. The first priority is to let housing supply in these cities respond to demand by easing zoning restrictions (Dachis and Thivierge 2018) and lowering development charges on new housing (Sancton 2026). Measures that act only on housing demand cannot do this, nor would winding down the federal mortgage insurance backstop, since rationing credit to marginal buyers does not change why they need so much of it.
Additional supply in the largest cities is necessary but, as Kronick and Beaudry (2025) argue, not sufficient because it draws further migration and sustains the national price gap. Increasing housing supply in Toronto or Vancouver may reduce prices in the very short term, but migration drawn by lower prices could quickly reverse the trend. Over a longer horizon, governments should also build the capacity of a small number of mid-sized cities to compete for workers and firms. The goal is for these cities to attract a larger share of new arrivals by offering comparable opportunities, not to push anyone out of Toronto or Vancouver.
One way to build that capacity is through infrastructure investments such as high-speed rail along the Toronto-Québec City corridor, since cities that gain a high-speed link to a larger centre have grown faster than comparable cities without one (Jones and Fariha 2025). The United States has successfully grown mid-sized cities like Austin, TX, and Raleigh-Durham, NC, which grew 33 and 25 percent between 2010 and 2020, respectively, placing them among the three fastest-growing US metropolitan areas with over one million people (US Census Bureau 2021). The United Kingdom illustrates the opposite: its economy is concentrated in London, while other large cities are less productive than the national average (OECD 2020).
Raising incomes is the other side of the ledger. The DSR falls when incomes grow faster than debt payments, while weak business investment per worker has held back Canadian productivity and wage growth (Robson and Bafale 2025). Policies that raise investment per worker, including competitive business taxation and the removal of internal trade barriers, would ease household debt burdens more durably than credit measures.
Distinguish Types of Financial Distress in Insolvency Statistics
The Office of the Superintendent of Bankruptcy should publish a breakdown of consumer insolvency filings by cash-flow and balance-sheet cases, drawing on the asset and liability information it already collects on Form 79. The two require different policy responses, but the headline insolvency series cannot identify which type is driving the recent rise in filings. The marginal cost of publishing the breakdown is low, while its value to Parliament and outside analysts is high.
Conclusion
Canada has a real but concentrated debt problem, located among highly leveraged homeowners in Toronto and Vancouver, among younger Canadians who carry consumer debt without offsetting home equity, and among lower-income households whose saving rates have turned persistently negative. It does not have an aggregate household debt crisis that calls for extraordinary intervention. The aggregate debt-service ratio is not an outlier as a measure of servicing capacity, and it has eased from its 2023 peak. The banking system has absorbed the rate cycle without distress, in part because the highest-risk lending is government-insured. That diagnosis is contingent on inflation and economic conditions: uncertainty could push up bond yields and mortgage rates, and renewed inflationary pressure could force the Bank of Canada back into tightening. Either situation could push the ratio up again.
Over the long run, the federal government should address the structural source of the tail risk. As long as economic opportunity in Canada is concentrated in two supply-constrained cities, new entrants will keep taking on large mortgages to participate in those labour markets. Growing a small number of mid-sized cities into realistic alternatives would address the root cause rather than the symptoms. At present, the federal government does not need an emergency response. However, Parliament should measure household stress where it actually sits and, over time, build more places where Canadians can pursue good careers without borrowing to their limits.
References
Ambler, Steve, and Jeremy Kronick. 2019. “What to Make of Rising Consumer Insolvency.” Intelligence Memo. Toronto: C.D. Howe Institute. February. https://cdhowe.org/publication/ambler-kronick-what-make-rising-consumer-insolvency/.
Bank of Canada. 2026. Financial Stability Report – 2026. Ottawa: Bank of Canada. May. https://www.bankofcanada.ca/publications/financial-stability-report/financial-stability-report-2026/.
Canada Mortgage and Housing Corporation. 2026. Residential Mortgage Industry Report. Ottawa: CMHC. Spring.
Dachis, Benjamin, and Vincent Thivierge. 2018. Through the Roof: The High Cost of Barriers to Building New Housing in Canadian Municipalities. Commentary 513. Toronto: C.D. Howe Institute. May. https://cdhowe.org/publication/through-roof-high-cost-barriers-building-new-housing-canadian-municipalities/.
Drehmann, Mathias, Anamaria Illes, Mikael Juselius, and Marjorie Santos. 2015. “How Much Income Is Used for Debt Payments? A New Database for Debt Service Ratios.” BIS Quarterly Review: 89–103. September.
Feldman, Michael K. 2020. “One More Case for Longer-Term Mortgages: Financial Stability.” E-Brief 299. Toronto: C.D. Howe Institute. January. https://cdhowe.org/publication/one-more-case-longer-term-mortgages-financial-stability/.
International Monetary Fund. 2025. Canada: Financial System Stability Assessment–Press Release and Staff Report. IMF Country Report 25/220. Washington: International Monetary Fund. July.
Jean, Jimmy, and Tiago Figueiredo. 2024. “In Short Supply: Long Mortgage Terms.” Economic Viewpoint. Desjardins Economic Studies. May 13. https://desjardins.com/en/savings-investment/economic-studies/canada-long-mortgage-terms-may-13-2024.html.
Jones, David, and Tasnim Fariha. 2025. All Aboard: The Benefits of Faster, More Frequent Passenger Trains between Ontario and Québec and The Costs of Delay. Commentary 676. Toronto: C.D. Howe Institute. February. https://cdhowe.org/publication/all-aboard-the-benefits-of-faster-more-frequent-passenger-trains-between-ontario-and-quebec-and-the-costs-of-delay/.
Kronick, Jeremy, and Paul Beaudry. 2025. Making Housing More Affordable in Canada: The Need for More Large Cities. Commentary 674. Toronto: C.D. Howe Institute. January. https://cdhowe.org/publication/making-housing-more-affordable-in-canada-the-need-for-more-large-cities/.
Kronick, Jeremy, and Steve Ambler. 2020. Predicting Financial Crises: The Search for the Most Telling Red Flag in the Economy. Commentary 564. Toronto: C.D. Howe Institute. February. https://cdhowe.org/publication/predicting-financial-crises-search-most-telling-red-flag-economy/.
OECD. 2018. Taxation of Household Savings. OECD Tax Policy Studies 25. Paris: OECD Publishing.
______. 2020. Enhancing Productivity in UK Core Cities: Connecting Local and Regional Growth. OECD Urban Policy Reviews. Paris: OECD Publishing.
Office of the Superintendent of Bankruptcy Canada. 2026. “Insolvency Statistics in Canada – 2025.” Ottawa: Innovation, Science and Economic Development Canada.
Poloz, Stephen S. 2019. “Risk Sharing, Flexibility and the Future of Mortgages.” Remarks to the Canadian Credit Union Association and Winnipeg Chamber of Commerce, Winnipeg. Bank of Canada. May 6. https://www.bankofcanada.ca/2019/05/risk-sharing-flexibility-future-mortgages/.
Robson, William B.P., and Mawakina Bafale. 2025. Canada’s Investment Crisis: Shrinking Capital Undermines Competitiveness and Wages. Commentary 699. Toronto: C.D. Howe Institute. https://cdhowe.org/publication/canadas-investment-crisis-shrinking-capital-undermines-competitiveness-and-wages/.
Rogers, Carolyn. 2024. “Canada’s Mortgage Market—A Question of Balance.” Remarks to the Economic Club of Canada, Toronto. Bank of Canada. November 6. https://www.bankofcanada.ca/2024/11/canadas-mortgage-market-a-question-of-balance/.
Sancton, Andrew. 2026. Growing Pains: Rethinking Development Charges in Canadian Municipalities. Commentary 723. Toronto: C.D. Howe Institute. July. https://cdhowe.org/publication/growing-pains-rethinking-development-charges-in-canadian-municipalities/.
St-Arnaud, Charles, and Oriane Kacoutie. 2026a. “Insolvencies Increased in April and Are Close to Their Highest Since the Financial Crisis.” Economic Commentary. Servus Credit Union. June 9.
_____________. 2026b. “Households’ Debt Burden Continues to Rise.” Economic Commentary. Servus Credit Union. June 12.
Statistics Canada. 2024. “Research to Insights: Disparities in Wealth and Debt Among Canadian Households.” Catalogue 11-631-X. February 28.
Statistics Canada. 2026a. “Distributions of Household Economic Accounts for Income, Consumption, Saving and Wealth of Canadian Households, 2025.” The Daily. April 13.
Statistics Canada. 2026b. “National Balance Sheet and Financial Flow Accounts, Second Quarter 2026.” The Daily. September 11.
US Census Bureau. 2021. 2020 Census Redistricting Data (Public Law 94-171) Summary File, Metropolitan Statistical Area Totals Compared with 2010. Washington, DC: US Census Bureau.
This E-Brief is a publication of the C.D. Howe Institute.
The authors retains responsibility for any errors and the views expressed.