



by Parisa Mahboubi
- Using data from the 2023 Programme for the International Assessment of Adult Competencies (PIAAC), this Commentary finds that immigrants in Canada score lower, on average, than non-immigrants on measures of literacy, numeracy, and adaptive problem-solving, with the largest gap in literacy.
- Although immigrants are more likely than non-immigrants to hold a university degree, higher educational attainment does not close the skills gap. Immigrants score lower in literacy at every education level, with university-educated immigrants scoring about the same as non-immigrants with only a high school diploma. Immigrants with foreign credentials also tend to earn less and are less likely to work in high-skill occupations than comparable non-immigrants, even after accounting for measured skills.
- The findings point to opportunities to improve immigrant selection and labour-market integration. The federal Express Entry program may have scope to raise its minimum language threshold and place greater emphasis on advanced official-language proficiency. Faster, more consistent credential recognition and measures to improve how employers assess foreign qualifications also warrant attention. Post-arrival support, particularly employment-focused language training, should be rigorously evaluated to ensure resources go to programs that improve outcomes.
The author extends gratitude to Alexandre Laurin, Mikal Skuterud, Christopher Worswick, Rosalie Wyonch, Tingting Zhang, and several anonymous referees for valuable comments and suggestions, and to Zachary Andom for research assistance. The author retains responsibility for any errors and the views expressed.
This project is funded by the Government of Canada’s Future Skills program.
Ce projet est financé par le gouvernement du Canada dans le cadre du programme Compétences futures.
The Future Skills Centre (FSC) is a forward-thinking centre for research and collaboration dedicated to driving innovation in skills development so that everyone in Canada can be prepared for the future of work. We partner with policymakers, researchers, practitioners, employers and labour, and post-secondary institutions to solve pressing labour market challenges and ensure the benefits of lifelong learning are accessible to all. We are founded by a consortium whose members are Toronto Metropolitan University, Blueprint, and Signal49 Research, and are funded by the Government of Canada’s Future Skills Program.
Le Centre des Compétences futures (CCF) est un centre de recherche et de collaboration avant-gardiste qui se consacre à l’innovation dans le domainedu développement des compétences afin que toutes les personnes au Canada soient prêtes pour l’avenir du travail. Nous travaillons en partenariat avec des personnes chargées de l’élaboration des politiques, des personnes chargées de la recherche, des spécialistes, des employeurs et des travailleuses et travailleurs, ainsi qu’avec des établissements d’enseignement postsecondaire, afin de résoudre les problèmes urgents du marché du travail et de veiller à ce que chacun puisse bénéficier de possibilités pertinentes d’apprentissage tout au long de la vie. Nous sommes fondés par un consortium dont les membres sont l’Université métropolitaine de Toronto, Blueprint et Signal49 Recherche, et nous sommes financés par le Programme du Centre des compétences du gouvernement du Canada.
Introduction
Foundational skills largely contribute to individuals’ employment and wage levels.11 This Commentary uses “skills” specifically to mean literacy, numeracy, and adaptive problem-solving abilities, which are basic competencies essential for full participation in the economy and society. This is also true for immigrants (Green and Riddell 2003; Ferrer, Green, and Riddell 2006; Barrett 2012). Higher levels of foundational skills are strongly associated with better employment and earnings outcomes by making it easier for workers to acquire and apply job-specific technical skills, enhancing productivity and supporting immigrants’ labour market integration (Clarke and Skuterud 2016). Immigrants with higher skill levels can also contribute to better economic outcomes for all residents, consistent with broader evidence linking adult skill levels to productivity (Andrews et al. 2025).
Canada’s economic immigration system is designed to select newcomers who can integrate quickly and successfully into the labour market, yet questions persist about whether immigrants’ educational qualifications and skills translate into positive labour-market outcomes once they arrive. This Commentary examines two interrelated empirical questions using the 2023 PIAAC survey. First, how large are the skills gaps between immigrants and non-immigrants in literacy, numeracy, and adaptive problem-solving (APS)? Related to this first question, what factors are associated with these gaps, and how has the literacy gap evolved over the past decade? Second, once differences in measured skills and background characteristics are taken into account, do immigrants and non-immigrants experience different employment, earnings, and occupational outcomes?
The results show that immigrants continue to have lower measured skills than non-immigrants, with the largest difference in literacy. Language background is strongly associated with these differences: among adults who speak English or French at home, immigrants and non-immigrants have similar skills. Immigrants’ higher educational attainment does not close the gap, which is present at every education level. Where immigrants obtained their highest credential is also strongly associated with measured skills. Meanwhile, the estimated literacy gap in the 2023 survey is smaller than the first PIAAC cycle a decade earlier, although the change is not statistically significant.
The labour market results are less straightforward than the skills differences alone might suggest. Immigrants and non-immigrants with similar characteristics have comparable employment rates, and immigrants report using their skills at work at least as often as non-immigrants. However, immigrants whose highest credential was obtained abroad tend to earn less and are less likely to work in high-skill occupations than comparable non-immigrants. Immigrant earnings are also more closely tied to their measured skills than those of non-immigrants. These findings point to the importance of distinguishing educational credentials, including where they were obtained, from directly measured skills when assessing immigrants’ labour-market integration.
These patterns matter because immigration is a central way Canada adds to its workforce and because immigrants are more likely than non-immigrants to hold a university degree. When immigrants’ skills fall short of what their credentials suggest, or when their foreign qualifications are discounted, the consequences likely show up as lower earnings for immigrants and forgone productivity for the broader economy.
The gap between immigrants’ credentials and their measured skills suggests room to improve how the immigration system assesses skills at selection and helps immigrants develop them after arrival. Selection, credential recognition, and settlement services are the main policy levers for these outcomes.
This Commentary makes three policy recommendations, one for each lever. First, Express Entry has scope to raise its minimum language threshold and place greater emphasis on advanced official-language proficiency, with ongoing evaluation of the effects on longer-term outcomes. Furthermore, measured skills are closely associated with language background, and university-educated immigrants have literacy skills similar to non-immigrants with only a high school diploma. Together with existing evidence on the earnings of economic principal applicants, these findings support stronger language selection.
Second, governments should continue working toward faster and more consistent credential recognition along with policies that address how employers assess foreign qualifications and help newcomers gain Canadian work experience. Immigrants with foreign credentials still earn less and face poorer occupational outcomes than non-immigrants, even after accounting for measured skills.
Third, because many immigrants are not selected on the basis of language or skills, post-arrival support, particularly employment-focused language training, remains important. Existing programs, however, warrant rigorous evaluation so that resources go to those that demonstrably improve outcomes.
To place these findings in context, the next section reviews what the first PIAAC cycle and subsequent research have established about immigrant skills and their relationship to labour-market outcomes before turning to what the 2023 data add to that evidence (see Box 1).
What We Know About Immigrant Skills and Labour-Market Outcomes
Previous C.D. Howe Institute research using the first PIAAC cycle identified a sizable gap in measured literacy skills between immigrants and non-immigrants in Canada. Mahboubi (2017a) found that immigrants scored, on average, 24 points below non-immigrants in literacy in the 2012 PIAAC. That study also found that Canada’s immigrant literacy gap was considerably larger than Australia’s despite the two countries’ similarities as major immigrant-receiving countries with points-based selection systems. Its analysis pointed particularly to language background and the location in which education was obtained as factors associated with immigrants’ measured literacy, raising questions about how well formal educational attainment alone captures the skills immigrants bring to the Canadian labour market.
This pattern is consistent with broader Organisation for Economic Co-operation and Development (OECD) evidence: across PIAAC-participating countries, immigrants’ literacy proficiency lags that of native-born adults, with the gap persisting even when comparing immigrants and native-born adults with the same level of education. The OECD’s cross-country comparison also highlights the role of language – specifically, whether immigrants speak the host-country language at home or learned it as a child – in explaining immigrants’ skills gaps (OECD 2017).
Subsequent research has reinforced the importance of distinguishing educational credentials from directly measured skills, while also showing considerable variation within immigrant populations. Using the first Canadian PIAAC cycle, Annen (2018) found that numeracy was positively associated with labour-market success and that obtaining one’s highest qualification abroad was associated with weaker labour-market outcomes.
Meanwhile, Mueller and Truong (2021), who distinguished immigrants by admission category, found that economic immigrants generally had higher literacy and numeracy scores and wages than other immigrant groups. Returns to these skills (the earnings gain associated with higher skills) were economically significant across the earnings distribution and broadly similar for immigrants and non-immigrants. Consistent with this, Cukier and Stolarick (2020) found that immigrants remained more likely to be unemployed than Canadian-born, even after accounting for literacy and numeracy scores, suggesting that measured skills narrow, but do not fully close, the gap in labour-market outcomes.
Broader PIAAC literature also demonstrates that directly measured skills are associated with labour-market outcomes, even among people with the same level of formal education (Richwine 2022; Tverdostup and Walter 2026). Across countries, higher numeracy has been associated with greater employment and higher earnings (Hanushek et al. 2015; Anghel and Balart 2017; Stijepic 2020; OECD 2024). When literacy and numeracy are included in the same model, numeracy generally retains a significant association with wages, while literacy’s independent contribution is small (Lancee and Bol 2017).
Canadian evidence similarly indicates that measured skills help account for differences in immigrants’ earnings and labour-market outcomes. For example, Truong and Sweetman (2018) found that a one-standard-deviation increase in problem-solving skills in technology-rich environments was associated with a 7 percent increase in earnings, with no significant difference in this return between immigrants and the Canadian-born.
Meanwhile, more recent research using the second PIAAC cycle has examined the relationship between immigrants’ measured skills and the work they perform: Tverdostup and Walter (2026), for example, find that immigrants in several European countries perform less cognitively demanding tasks than non-immigrants within occupations, but that these differences disappear after accounting for measured skills.
This Commentary contributes to the literature by examining the new PIAAC cycle to identify skills gaps between immigrants and non-immigrants – and the characteristics associated with differences in measured skills – and by investigating how PIAAC skills relate to labour-market outcomes.
What the 2023 PIAAC Data Reveal
This Commentary’s analysis uses the 2023 PIAAC Canadian public-use file, which directly assesses adults’ literacy, numeracy, and adaptive problem-solving skills. The file also collects information on their demographic characteristics, education and training, language background, immigration status, and labour-market experience (Box 1).
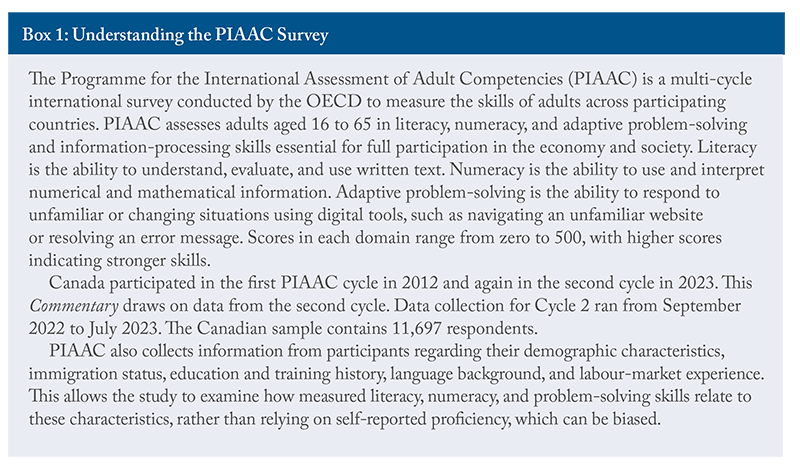
The analysis proceeds in two stages. It first compares the measured skills of immigrants and non-immigrants and examines how those differences change after accounting for characteristics including education, language background, age, and other observable factors. It then examines immigrants separately to assess how characteristics such as language background, where the highest credential was obtained, and years since immigration are associated with measured skills.
The second part of the analysis turns from skills as outcomes to their relationship with labour-market outcomes, examining whether differences between immigrants and non-immigrants in employment, earnings, occupational skill level, and overqualification persist after measured skills and other observable characteristics are taken into account.22 Appendix Table B1 summarizes descriptive statistics for key variables and characteristics.
The analysis accounts for PIAAC’s complex survey design and the uncertainty associated with its proficiency measures. Because the data are cross-sectional, the relationships identified should be interpreted as associations rather than causal effects. The online Appendix C provides further details on the samples, variables, estimation methods, and robustness checks.
The public-use data also impose important limitations. Most notably, they do not identify immigrants’ admission category or province of residence, measure official-language proficiency directly,33 The language measure used reflects whether respondents’ home language matches the test language. or allow the timing of immigration to be matched precisely with when the highest credential was obtained. The results, therefore, describe the foreign-born population as a whole and cannot establish whether the same relationships apply specifically to immigrants selected through Express Entry or other admission streams. These and other data limitations are discussed further in online Appendix C.
With these limitations in mind, the 2023 PIAAC shows clear differences in measured skills between immigrants and non-immigrants.44 Throughout this Commentary, immigrants are respondents born outside Canada, and non-immigrants are those born in Canada. Immigrants in Canada, on average, score lower than non-immigrants in all three PIAAC domains, but the size of the gap varies considerably. The literacy gap is the largest, at 20 points, followed by adaptive problem-solving at 16 points, and numeracy at just 7 points (Figure 1).55 “All Respondents” in Figure 1 includes 90 doorstep-interview cases (0.77 percent of the sample). The Doorstep Interview is an administrative mechanism introduced in PIAAC Cycle 2 to minimize non-response among individuals facing severe official language barriers – a category the OECD classifies as “literacy-related non-response.” These respondents have very low imputed proficiency scores. Among the 86 Doorstep Interview respondents for whom country of birth is reported, 85 were born outside Canada and would, therefore, be classified as immigrants under this study’s definition. Including these respondents according to birthplace increases the estimated immigrant/non-immigrant literacy gap from approximately 20 to 26 points. However, because these respondents lack other information required for the analysis, they are excluded from the immigrant/non-immigrant comparisons.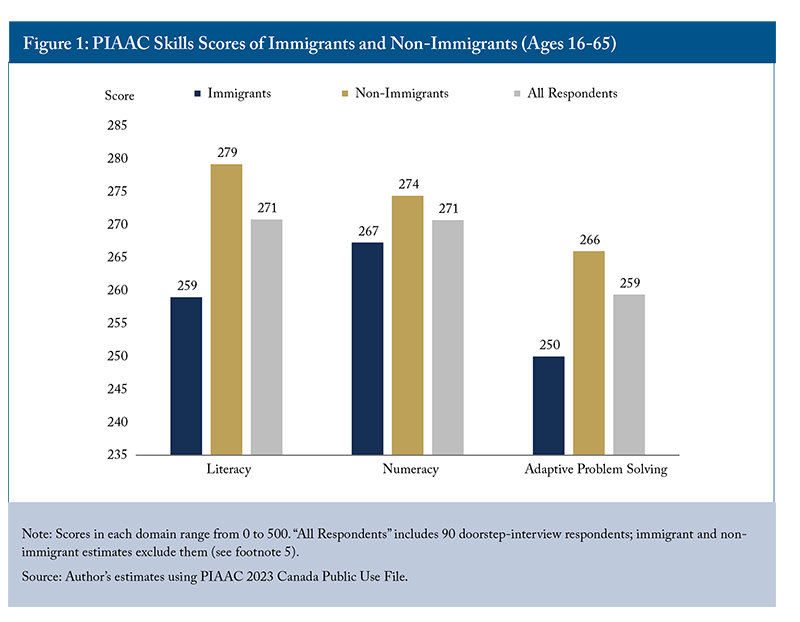
Because literacy shows the largest gap of the three domains, it is the primary focus of the analysis that follows. Numeracy and adaptive problem-solving are also examined but only reported in several sections later in this Commentary.
Canada’s Immigrant Literacy Gap in International Context
Table 1 compares Canada’s literacy performance with that of other major immigrant-receiving countries and the OECD average. In the 2023 cycle, Canada’s overall literacy score exceeds both the OECD average and that of the US, although it remains slightly below that of England.66 Differences between Canada and the OECD average and the US are statistically significant across all groups and both cycles. Canada’s difference from England is not statistically significant, except among immigrants in Cycle 2, where Canada scores higher. England was the only constituent nation of the United Kingdom to participate in Cycle 2 of PIAAC, so results for England should not be taken to represent the UK as a whole. More importantly, Canada’s immigrant/non-immigrant gap (20 points) is smaller than that in the US (48 points) and England (29 points), and below the OECD average (30 points).
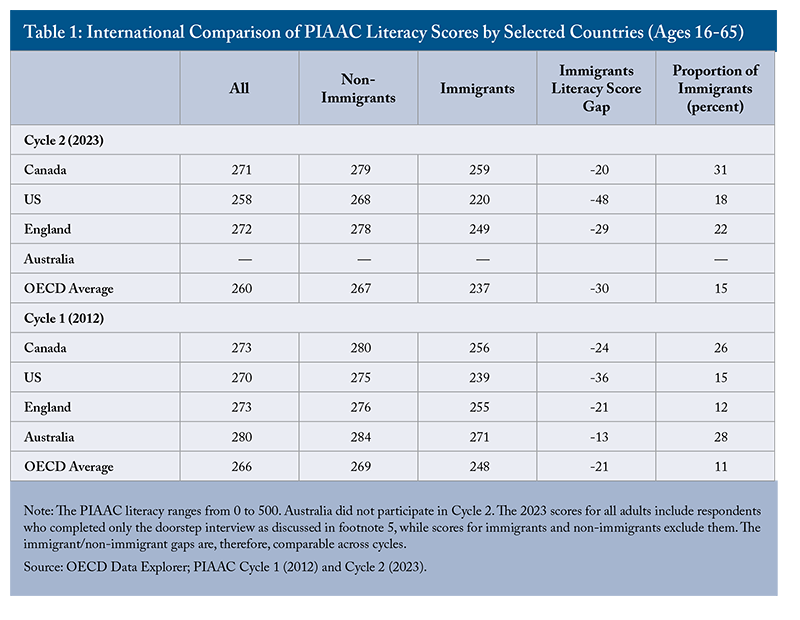
The comparison across the two PIAAC cycles highlights two important patterns. First, in 2012, Canada’s 24-point immigrant/non-immigrant literacy gap was not large by international standards: it was smaller than in the US (36 points) and close to the OECD average (21 points). Australia’s performance highlighted the possibility of achieving strong literacy outcomes among immigrants despite high immigration levels (Mahboubi 2017a).77 Australia did not participate in the 2023 cycle, so its current standing cannot be directly compared.
Second, by 2023, Canada’s position improved in absolute terms: the gap narrowed from 24 to 20 points, even as the proportion of immigrants in the population rose from 26 to 31 percent. However, this change is not statistically significant.
Since PIAAC does not identify immigrants by admission class, it is impossible to isolate the role of each program – especially the introduction of Express Entry in 2015, which placed greater emphasis on applicants’ human capital characteristics – from shifts in the composition of participants across immigration. Nevertheless, Canada’s 2023 immigrant literacy gap remains substantially larger than Australia’s 2012 gap, the most recent Australian estimate available, suggesting that there remains considerable scope to further improve immigrant literacy outcomes.
Factors Associated with Immigrant Skills Gaps
Table 2 shows that Canadian immigrants aged 25-65 scored, on average, 22 points lower than non-immigrants on the 2023 PIAAC literacy test – a gap that declines only modestly to 19 points after accounting for language background, education, age, parental education, gender, and training.88 Results for adults aged 16-65 are shown in Appendix Table B2. Including adults aged 16-24, some of whom have not yet completed their education, yields immigrant gaps up to three points smaller in all specifications, with no change in sign or statistical significance.
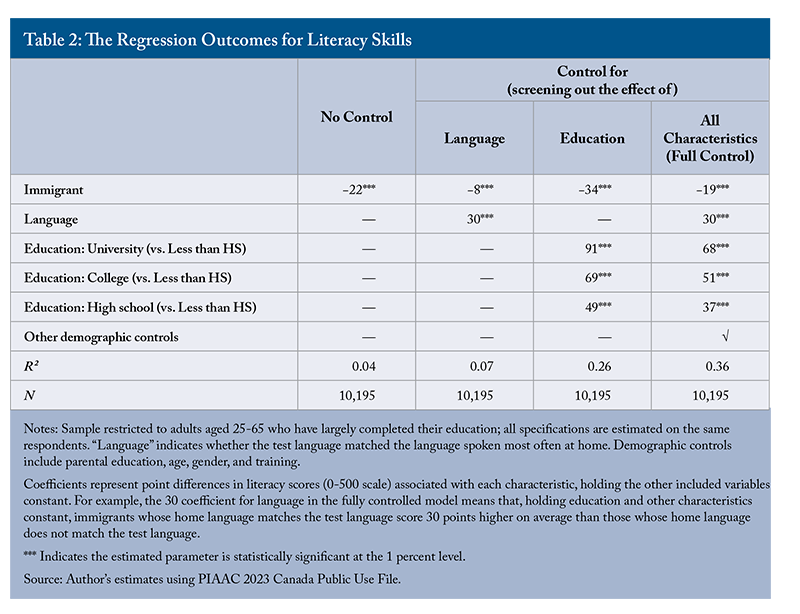
However, the characteristic most strongly associated with the gap is language background. Accounting for whether the language of the test (English or French) matches the language most often spoken at home – a proxy for language background – the literacy-score gap between immigrants and non-immigrants shrinks by more than half from 22 points to eight.99 Among the language variables – whether the test language matches the language most often spoken at home, whether it matches the respondent’s native language, and whether the respondent is either native-born or a native speaker of an official language – the home-language measure has the strongest association with literacy scores and provides the best model fit (see Figure A1 in online Appendix A). Therefore, it is used as the language proxy throughout the regression analysis. No other characteristic available in the data reduces the gap as much when taken into account on its own. Because the PIAAC test in Canada is administered in English or French, literacy results are inherently tied to proficiency in an official language.
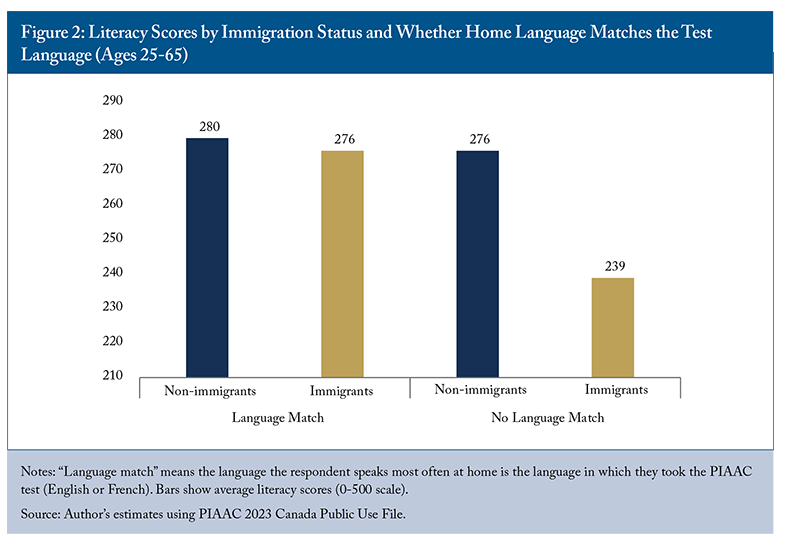
Language use differs markedly between the two groups: about half (49 percent) of immigrants aged 25-65 most often speak English or French at home, compared with nearly all (97 percent) non-immigrants. Among immigrants, those whose home language matches the test language score 37 points higher, on average, than those whose home language does not, while the equivalent difference among non-immigrants is negligible (three points) and not statistically significant.
Among those whose home language matches the test language, immigrants and non-immigrants show no statistically significant difference in literacy (a four-point gap).1010 The same holds for numeracy and adaptive problem-solving. The immigrant-non-immigrant literacy gap is, therefore, concentrated among those who do not speak an official language at home, where it amounts to a statistically significant 37 points (Figure 2).
Educational attainment is also strongly associated with literacy scores, but it tells a different story. Counterintuitively, controlling for education widens the immigrant literacy gap to 34 points rather than narrowing it.1111 The same pattern holds in proportional terms (in models of log literacy scores). This reflects the fact that immigrants aged 25-65 are, on average, more highly educated than non-immigrants: 57 percent of these immigrants hold at least a university degree compared to 31 percent of non-immigrants in the same age group. Therefore, accounting for differences in education levels between immigrants and non-immigrants removes a difference in favour of immigrants that had been offsetting part of the underlying literacy gap.1212 Controlling for education and language together (not shown) leaves a gap of about 20 points, close to the 19-point gap in the fully controlled model. The remaining characteristics (parental education, age, gender, and training), therefore, make little additional difference to the gap.
A statistically significant literacy gap between immigrants and non-immigrants remains at every education level. Immigrants score between 29 and 39 points lower than non-immigrants with the same level of education, or roughly 12 to 20 percent lower (Figure 3).1313 The size of the gap does not differ significantly across education levels, whether measured in points (p = 0.20) or in logs (p = 0.44), based on tests of equal immigrant/non-immigrant gaps across the four education levels (adults aged 25-65). University-educated immigrants score, on average, about the same as non-immigrants with only a high school diploma (273 and 268 points).
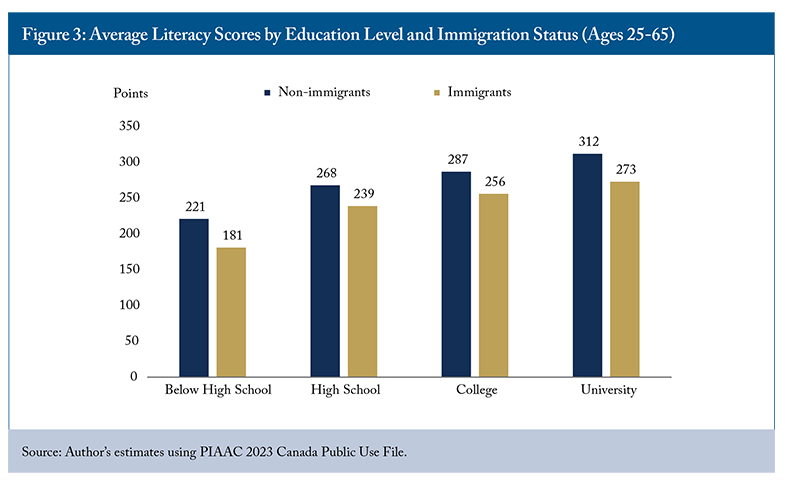
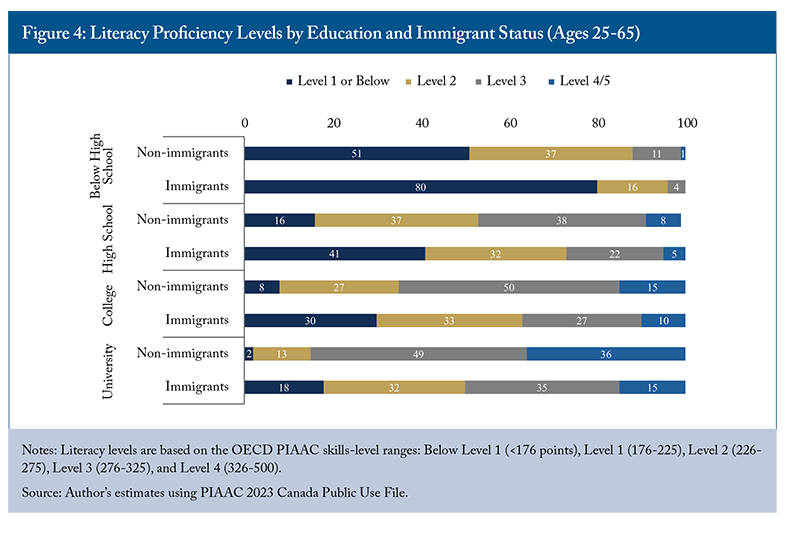
The gap reflects a broad shift across proficiency levels not driven by a small group of very low scorers (Figure 4). Half of university-educated immigrants score at the two lowest literacy levels (Level 2 or below) compared with 15 percent of university-educated non-immigrants. Among university graduates, only 15 percent of immigrants reach Level 4 or 5, compared with 36 percent of non-immigrants. Literacy rises with education for both groups and by a similar amount: the gap between university graduates and those without a high school diploma is about 90 points for both immigrants and non-immigrants (Figure 3). However, because immigrants score lower at every education level, the same credential is associated with lower literacy proficiency.
For its part, Canada’s Express Entry system awards points for higher education, reflecting the expectation that it is associated with stronger skills. These results suggest that, for immigrants, educational credentials alone may overstate literacy proficiency relative to the same credentials held by non-immigrants.
A Blinder-Oaxaca decomposition of the literacy gap1414 The Blinder-Oaxaca decomposition is a statistical technique that splits the average score gap between two groups into the part associated with differences in measured characteristics, such as education or language background, and the part that remains after accounting for them. These are statistical associations and do not imply that the characteristics cause the differences. shows that differences between immigrants and non-immigrants in measured characteristics account, on balance, for only about three of the 22 points (Appendix Table B3). This is because two factors pull in opposite directions and largely offset each other: immigrants’ less frequent use of an official language at home is associated with a nine-point larger gap, while their higher rate of university completion is associated with an 18-point smaller gap. The remaining 19 points are not accounted for by the characteristics in the data, which are too broad to capture differences in the depth of language proficiency in an official language, the quality and content of credentials, and whether these credentials were earned in Canada or abroad.
This finding suggests that improving immigrants’ observable characteristics alone – for example, further raising educational attainment – is unlikely to close the literacy gap unless differences in language proficiency and in the quality or transferability of education are also addressed.
Turning to other domains, adaptive problem-solving follows a pattern similar to literacy: controlling for language narrows the gap from 16 points to six, though the fully adjusted gap returns to 16 points once all other controls are added (Table B4 in online Appendix B). Meanwhile, numeracy differs. The unadjusted gap is smaller (nine points) and disappears once language is accounted for (Table B5 in online Appendix B).
Language matters for numeracy because many PIAAC numeracy tasks are text-based, real-life problems that require reading in the test language. But it matters less than for literacy: in the full models, language background is associated with a difference of about 19 points in numeracy compared with 30 points in literacy. As a result, the widening effect of education outweighs the narrowing effect of language, and the fully adjusted numeracy gap (13 points) is larger than the unadjusted gap.
These analyses leave open what factors are associated with stronger or weaker skills among immigrants themselves, such as where credentials were obtained, region of birth, and time spent in Canada. The next section examines these factors within the immigrant population.
Factors Associated with Skills Among Immigrants
Table 3 shows that language background remains one of the characteristics most strongly associated with skills among immigrants (aged 25-65): those whose home language matches the test language score 16 points higher in literacy and 11 points higher in adaptive problem-solving than otherwise similar immigrants whose home language does not match. For numeracy, the difference (six points) is not statistically significant.
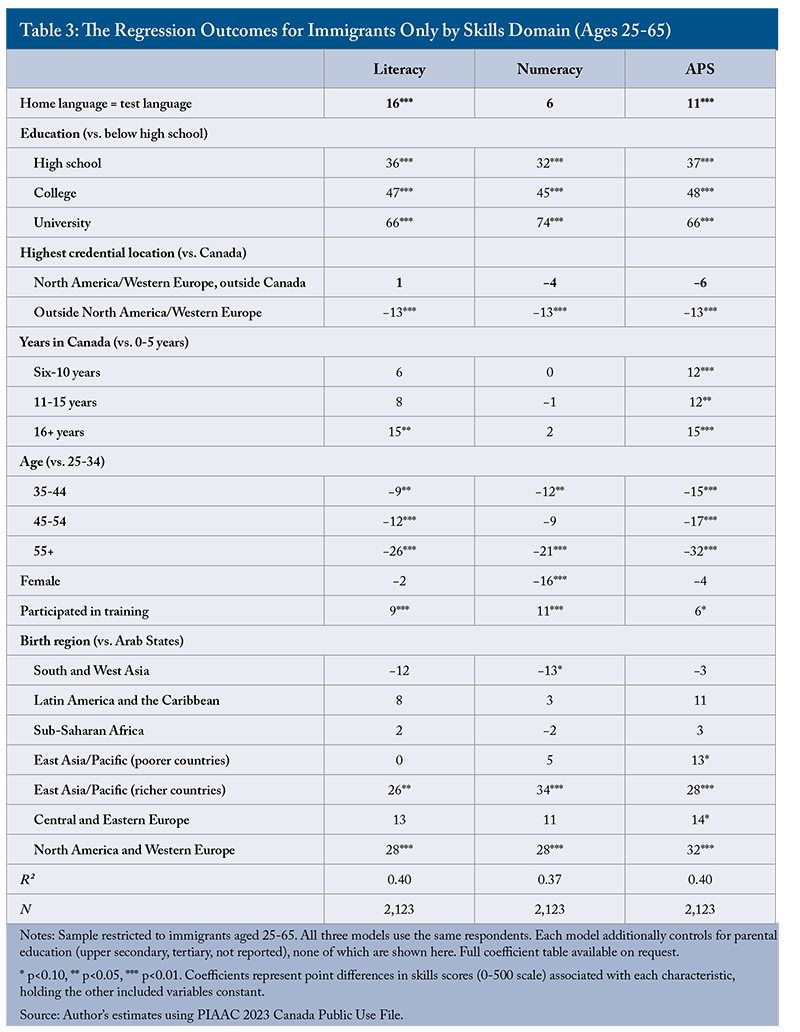
Where the highest credential was obtained is similarly associated with skills, which is relevant to Canadian immigration policy because Express Entry’s system awards additional points for a credential obtained in Canada. Immigrants whose highest credential is from North America or Western Europe score about the same as those with a Canadian credential in all three domains. However, this group size is small, and most of its members were born in North America or Western Europe and speak English or French at home. The result, therefore, mainly compares immigrants from those regions and cannot show whether a credential from North America or Western Europe is associated with skills similar to immigrants born elsewhere with a Canadian credential.
In contrast, immigrants whose highest credential was obtained outside North America and Western Europe score about 13 points lower in each of literacy, numeracy, and adaptive problem-solving than those with a Canadian credential. Birth region is held constant, so this compares immigrants born in the same region but with different credential locations: for example, those educated in Canada with those educated in their region of origin. About 45 percent of immigrants aged 25-65 hold their highest credential from Canada, drawn from every birth region, while 43 percent hold it from outside North America and Western Europe, a group with lower measured skills.1515 The remaining 12 percent hold their highest credential from elsewhere in North America or Western Europe. Of these, 62 percent were born in that region, and 73 percent speak English or French most often at home, compared with 26 percent of those credentialed outside North America and Western Europe.
Time in Canada is associated with skills differently across domains. Immigrants who have lived in Canada more than five years score 12 to 15 points higher in adaptive problem-solving than recent immigrants. In literacy, a significant difference appears only for those in Canada for 16 years or more (15 points), and there is none in numeracy. Because the data are cross-sectional, these differences may reflect skill development after arrival, differences between immigrants who arrived in different periods, or both.
Several other characteristics are also associated with immigrants’ measured skills. For example, older immigrants perform less well than those aged 25-34 in all three domains. This is consistent with evidence that skills erode with age (Mahboubi 2017b), although cross-sectional data may also reflect generational differences in education and experience. Immigrants who participated in training score higher in all three domains.
Women score similarly to men in literacy and adaptive problem-solving but 16 points lower in numeracy. Immigrants born in North America and Western Europe or in higher-income East Asian economies outperform those born in Arab states, even after accounting for credential location and other characteristics. Birth region and credential location, therefore, capture distinct information.
Overall, within the immigrant population, where the highest educational credential was obtained is consistently associated with skills across all three domains, while language background is associated with literacy and adaptive problem-solving but not numeracy.
Skills and Labour Market Outcomes
This section examines whether differences in skills between immigrants and non-immigrants are associated with different labour-market outcomes. Literacy and employment likely reinforce one another: stronger skills improve employment prospects, while employment helps maintain skills through regular use; time outside the labour market may depreciate skills.
On the surface, immigrants aged 25-65 are doing well in Canada’s labour market: they are employed at about the same rate as non-immigrants (81 percent versus 79 percent), and immigrant employees are more likely to work in high-skill occupations (62 percent versus 57 percent). However, they are also more likely to report being overqualified for their jobs (34 percent versus 28 percent) – which at first glance suggests that immigrant talent is being underused.1616 Overqualification is based on respondents’ own assessment of the education level needed to get their current job, compared with their highest qualification. As a self-reported measure, it may be affected by differences in how immigrants and non-immigrants perceive job requirements.
Gaps After Accounting for Skills and Other Characteristics
Table 4 examines whether the differences in labour-market outcomes persist when immigrants are compared with non-immigrants who have similar skills, education, and other characteristics.1717 All labour-market analyses exclude respondents aged 16-24. Outcomes other than employment (top earnings quintile, earnings-quintile position, high-skill occupation, and overqualification) further restrict the sample to employed respondents, excluding the self-employed and those whose employment type was not reported.
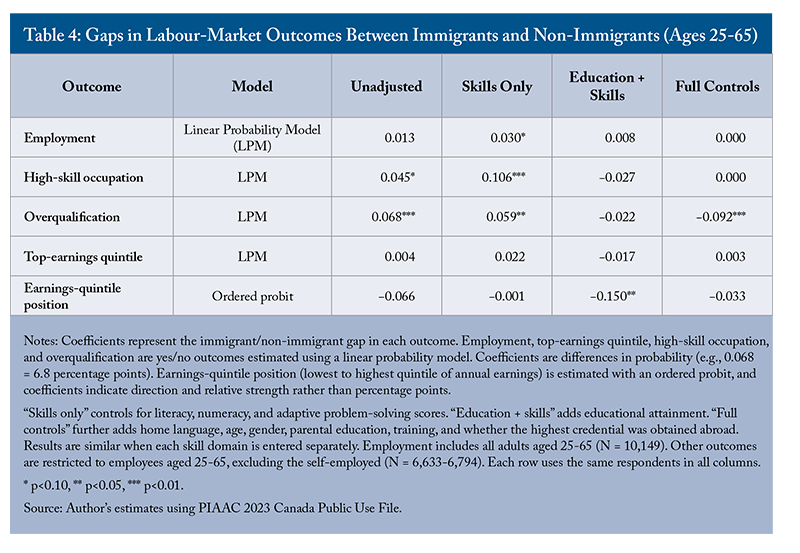
Three patterns stand out. First, there is little evidence of an employment gap between immigrants and non-immigrants (only a small, marginally significant difference in favour of immigrants of 3 percentage points when only skills are controlled for).
Second, measured skills do not explain the unadjusted differences, and accounting for them enlarges the gaps for some outcomes. Immigrant employees are 11 percentage points more likely than non-immigrant employees with the same skills to work in a high-skill occupation, and 6 percentage points more likely to be overqualified. Measured skills, therefore, do not account for the unadjusted differences.
Third, the picture changes once education is taken into account. Because immigrants are more highly educated, comparing them with equally educated non-immigrants with the same skills removes their high-skill-occupation advantage and their overqualification disadvantage. It also reveals an earnings gap: immigrants rank significantly lower in earnings distribution than non-immigrants with the same education and skills. That gap is no longer significant once the remaining controls are added, including whether the highest credential was obtained abroad. With all controls, immigrants are 9 percentage points less likely to be overqualified than otherwise similar non-immigrants.
The absence of significant employment and earnings gaps in the unadjusted and fully adjusted models may partly reflect survey timing: PIAAC was conducted during a period of exceptionally tight labour market conditions when widespread labour shortages may have reduced barriers to employment.
Sample composition may also play a role. Immigrants who are hardest to reach for a lengthy, language-demanding assessment are likely underrepresented in the sample (see online Appendix C). If they face greater labour market barriers, the observed employment and earnings gaps would understate those in the wider immigrant population.
How Credential Origin Relates to Labour-Market Outcomes
The fully adjusted estimates in Table 4 include whether an immigrant’s highest credential was obtained abroad. Table 5 separates immigrants by the location where their highest credential was obtained to further estimate the role of credential origin.
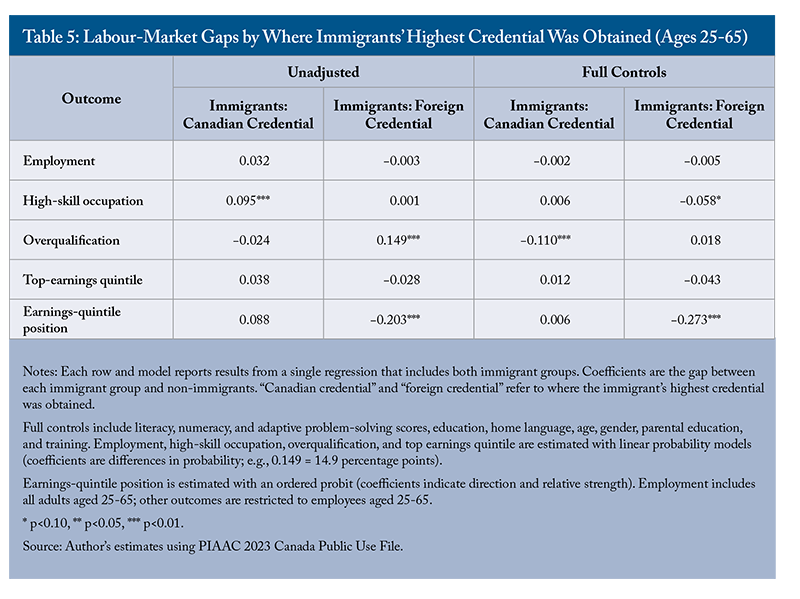
In the fully controlled model, immigrants who obtained their highest credential from Canada have labour-market outcomes similar to comparable non-immigrants and are 11 percentage points less likely to be overqualified.
Immigrants with foreign credentials show a different pattern. Compared with non-immigrants with similar education, measured skills, and other characteristics, they tend to earn less and are about 6 percentage points less likely to work in a high-skill occupation but are about as likely to be overqualified. Neither group differs from non-immigrants in employment.
Before accounting for these differences, immigrants with foreign credentials are 15 percentage points more likely to be overqualified, while those with Canadian credentials are not. Because overqualification compares a person’s education with their job requirements, and immigrants tend to be more highly educated, comparing them with non-immigrants with similar education and measured skills narrows the gap.
However, because skills are measured in English or French, the test may understate immigrants’ skills. Comparing immigrants with non-immigrants who have the same measured skills may, therefore, understate the overqualification gap, making them appear better matched to their jobs than they are.
Among immigrants with Canadian credentials, the results may also reflect how Canadian education and work experience help them enter the labour market. For those with foreign credentials, the combination of lower earnings and being less likely to access high-skill occupations, despite similar overqualification rates after adjustments, is consistent with literature on immigrants’ difficulties translating foreign credentials into comparable labour-market outcomes (Mahboubi and Zhang 2024).
Several reasons may explain these difficulties: gaps in occupation-specific skills, employers’ limited ability to assess foreign credentials and experience, or both. Because PIAAC measures foundational rather than job-specific skills, these difficulties may not be reflected in the data.
Unlike US evidence that the difficulties facing foreign-educated immigrants fall substantially once measured skills are taken into account (Richwine 2022), the disadvantages confronting foreign-educated immigrants in Canada appear to persist after adjusting for skills, education, and other characteristics.
Earnings by Skill Level and Across the Distribution
The average labour-market gaps in Table 4 also conceal differences across the earnings distribution (Figure A2). Immigrant employees are about 5 percentage points more likely than non-immigrants to be in the second-lowest earnings quintile and somewhat less likely to be in the upper-middle quintiles, while their shares in the top and bottom quintiles are similar. Immigrants are, therefore, concentrated in the lower-middle of the earnings distribution rather than at the bottom.1818 In PIAAC 2012, the distribution was less favourable to immigrants: immigrant employees aged 25-65 were over-represented in the bottom two earnings quintiles and under-represented in the top two. None of the changes between cycles is statistically significant (Figure A3). This is consistent with the possible role of the tight labour market at the time of the 2023 survey. After adjustment, none of these differences is statistically significant, although the estimates are uncertain because confidence intervals are wide.
Earnings differences by years since immigration are also small. Immigrants who have lived in Canada 10 years or fewer are somewhat less likely than non-immigrants to be in the top earnings quintile and somewhat more likely to be in the bottom quintile, but few of these differences are statistically significant. For example, those in Canada for six to 10 years are 7 percentage points less likely to be in the top quintile, a difference significant only at the 10 percent level. None of these differences remain after adjusting for skills and other characteristics, and no difference is found for immigrants who have lived in Canada more than 10 years (Appendix Table B6). Because the data are cross-sectional, differences across these groups may reflect differences between arrival cohorts as well as time spent in Canada.
The absence of large average gaps also masks variation by skill level (Figure 5). Among adults with literacy at Level 1 or below, immigrants are 10 percentage points more likely than non-immigrants to be employed, although this difference is not significant after adjustment; at higher literacy levels, employment rates are similar.
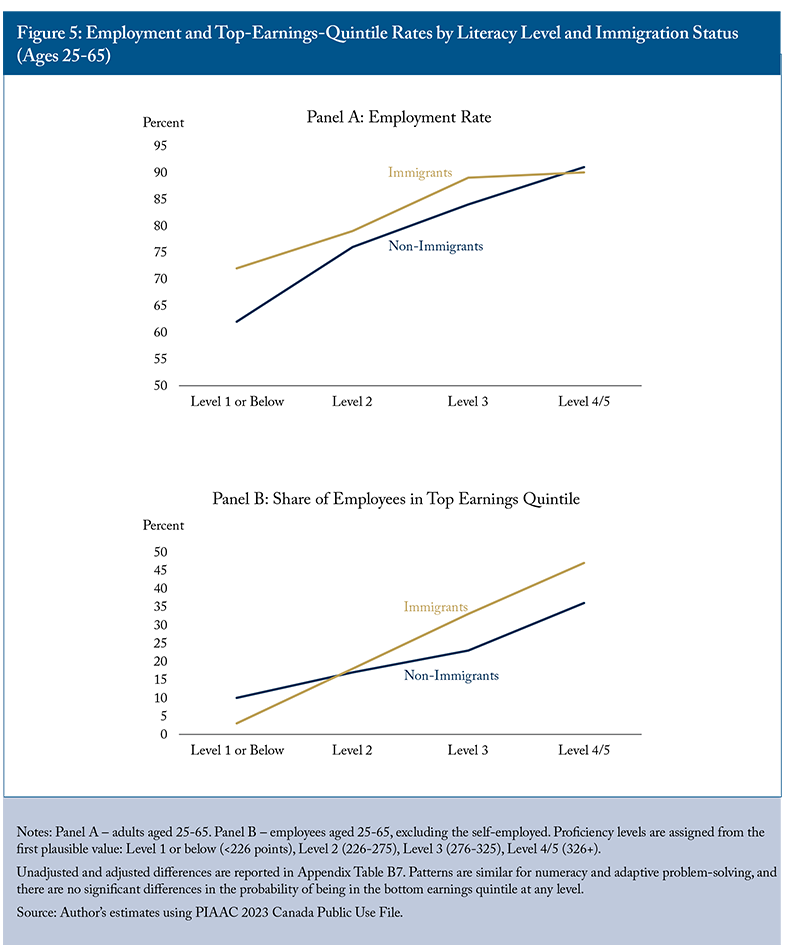
Earnings show a different pattern. Among employees at literacy Level 1 or below, 3 percent of immigrants are in the top earnings quintile, compared with 10 percent of non-immigrants. At Level 4 or above, the pattern reverses: 47 percent of immigrants are in the top quintile, compared with 36 percent of non-immigrants. Both differences remain after adjustment, although the advantage at the highest level is significant only at the 10 percent level (Appendix Table B7). These results suggest that immigrants’ earnings are more closely tied to their literacy skills than for non-immigrants: low literacy is associated with a lower likelihood of being a top earner for immigrants, and high literacy with a higher likelihood.
Regression estimates confirm this pattern. A one-standard-deviation increase in literacy, numeracy, or adaptive problem-solving is associated with a 5 to 7 percentage point larger increase in the probability of being in the top earnings quintile for immigrants than for non-immigrants. Higher literacy and adaptive problem-solving scores are also associated with a larger improvement in immigrants’ overall earnings position (Appendix Table B8). Immigrants’ earnings are, therefore, more closely tied to their measured skills than those of non-immigrants, unlike earlier Canadian studies using the first PIAAC cycle that found broadly similar returns for the two groups (Truong and Sweetman 2018; Mueller and Truong 2021). Immigrants with weaker skills fare worse than comparable non-immigrants, while those with stronger skills fare better, and this offsetting pattern is consistent with the average earnings gaps in Table 4 being close to zero.
When literacy, numeracy, and adaptive problem-solving are considered together, numeracy is the only domain that remains significantly associated with most labour-market outcomes, consistent with earlier PIAAC research (Appendix Table B9).1919 It is important to note that literacy, numeracy, and adaptive problem-solving are highly correlated with one another (Appendix Table B10), so including all three in the same model makes it difficult to separate their individual contributions.
Skill Use at Work
A further test of skill utilization examines how often immigrants and non-immigrants reported using literacy, numeracy, and technology skills at work (Table 6). Immigrant employees, on average, reported more frequent use of reading, writing, and information and communications technology (ICT) skills than non-immigrant employees, and similar use of numeracy skills. Compared with non-immigrants with the same PIAAC scores and similar characteristics, they reported more frequent use of all four types of skills.
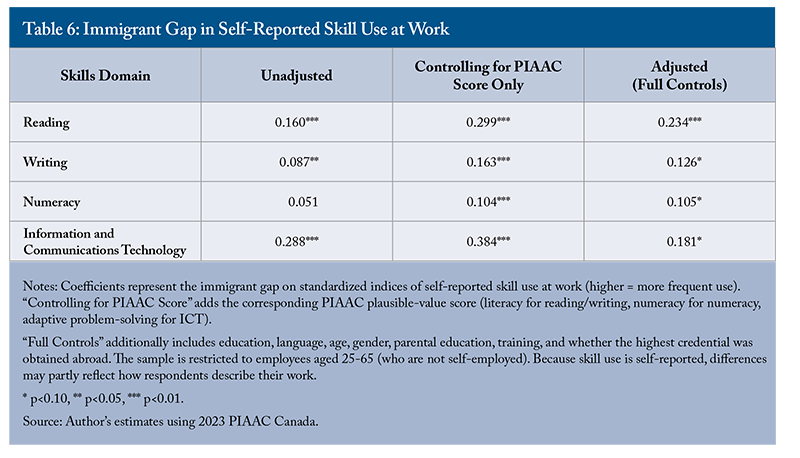
Overall, there is no evidence that immigrants use their measured skills at work less often than non-immigrants with similar skills and backgrounds. Where significant differences remain, they indicate more frequent reported skill use among immigrants. Because these measures are based on self-reported task frequency, however, they may reflect differences in reporting behaviour or perception of job tasks as well as differences in actual tasks. They also do not capture whether immigrants fully use their credentials at work, while earlier results suggest those with foreign credentials may not.
Policy Discussion and Implications
This Commentary’s findings can be summarized in four points. First, immigrants’ measured skills remain lower than those of non-immigrants, especially in literacy, and the gap is concentrated among immigrants who do not speak English or French at home.
Second, immigrants’ higher education levels do not close the gap, which is present at every education level.
Third, in the labour market, immigrants and non-immigrants with similar characteristics have similar employment rates, and immigrants report using their skills at work at least as often. However, immigrants with foreign credentials earn less and are less likely to work in high-skill occupations than comparable non-immigrants, while those with Canadian credentials have similar earnings and occupational outcomes and are less likely to be overqualified.
Fourth, immigrants’ earnings are more closely tied to their measured skills than those of non-immigrants: those with strong skills do better than comparable non-immigrants, and those with weaker skills do worse.
These results were obtained during an exceptionally tight labour market. Canada’s labour market has since cooled, and workers with weaker skills may be more affected when labour-market conditions soften. At the same time, Canada’s immigration system has changed significantly in recent years and continues to evolve, making it timely to consider what the evidence implies for selection, credential recognition, and settlement. The implications discussed below should be read in light of the data limitations discussed earlier and in online Appendix C.
Language Proficiency in Immigrant Selection
Language background is the characteristic most strongly associated with the immigrant skills gap in this study. Among adults whose home language matches the test language, immigrants and non-immigrants show no significant difference in any skill domain, and among immigrants, home language is associated with substantially higher literacy. This is consistent with previous research linking official-language proficiency to immigrants’ literacy (Mahboubi 2017a). Studies using more direct measures of proficiency also find it associated with immigrants’ employment and earnings outcomes (Ferrer, Green, and Riddell 2006; Chiswick and Miller 2010; Xu and Hou 2023).
Mahboubi (2017a) found that Canadian immigrants performed relatively worse in literacy than Australian immigrants in PIAAC Cycle 1 and attributed part of the gap to differences in immigration policy between the two countries, particularly in language requirements. A direct update of this comparison is not possible in Cycle 2 since Australia did not participate, nor is it possible to isolate the effect of language requirements and other policy changes, especially the introduction of Express Entry a decade ago. Canada’s immigrant literacy gap is about 20 points in PIAAC Cycle 2, compared with 13 points for Australia in Cycle 1, the smallest gap among traditional immigrant-receiving countries in that cycle.2020 The comparison should be interpreted cautiously, given the different survey cycles and differences in immigrant composition and immigration systems.
Australia, nevertheless, remains a useful descriptive policy benchmark because its skilled-migration language-selection framework has remained largely unchanged since Cycle 1. As shown in Table 7, it treats competent English (Canadian Language Benchmark [CLB] 7 equivalent) primarily as a minimum eligibility requirement and awards language points only for applicants with proficient and superior English (CLB 9 and above). Canada’s system also rewards higher proficiency, with points increasing through CLB 10, but it awards 18 to 26 percent of maximum language points to applicants below competent proficiency (roughly conversational ability, below the CLB 7 threshold most post-secondary institutions require of international students) and permits lower minimum language requirements in some Express Entry programs (Appendix Table B11).
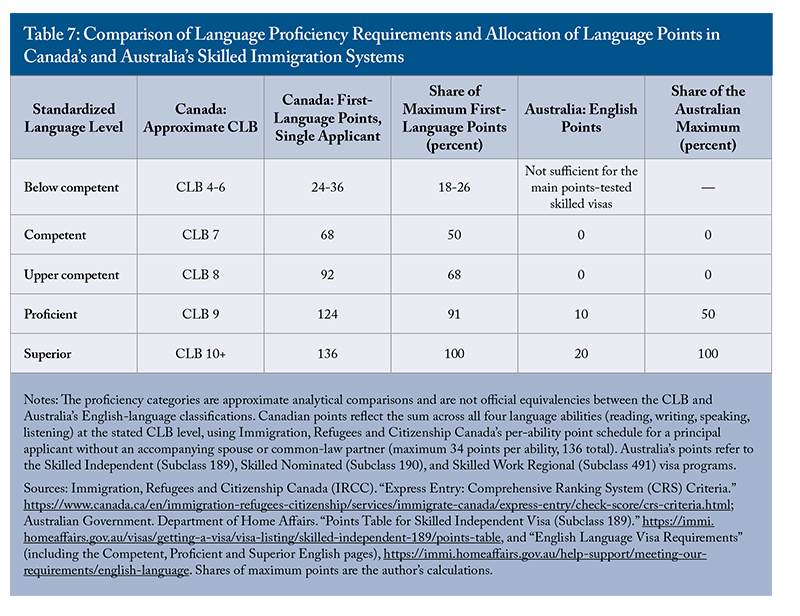
Direct evidence on Express Entry principal applicants further supports this point. Administrative data show that Express Entry’s human-capital-based selection performs well overall: principal applicants admitted through Express Entry have higher employment rates and earnings than other economic immigrants, even after accounting for their characteristics (Zhang and Zhong 2026). Within Express Entry, Xu and Hou (2023), using test-based CLB scores linked to tax records, find that tested official-language proficiency matters as much as pre-immigration Canadian work experience and more than education or age in predicting immigrants’ initial earnings.
Earnings rise with proficiency from around CLB 7 upward, while there are no clear earnings differences across the lowest levels – the range in which Canada currently awards a meaningful share of language points. Combined with this Commentary’s finding that language background is the characteristic most strongly associated with immigrants’ measured skills, these findings provide a basis for considering whether Express Entry should raise its minimum language threshold and concentrate more language points at higher proficiency levels, consistent with earlier calls to place greater weight on quality in Canada's immigrant selection (Mahboubi 2024). Because Xu and Hou’s analysis covers only the first few years after arrival and finds little association between language proficiency and employment, continued evaluation using administrative data could assess whether such a change is associated with improved longer-term labour market outcomes.
Credential Recognition and Labour-Market Integration
Where immigrants obtained their highest credential is associated with both their measured skills and their labour-market outcomes. Immigrants educated outside North America and Western Europe have lower measured skills than otherwise similar immigrants educated in Canada, including those born in the same region. In the labour market, immigrants with foreign credentials tend to earn less and are less likely to work in high-skill occupations than comparable non-immigrants, even after accounting for measured skills, education, and other characteristics, while immigrants with Canadian credentials have outcomes similar to comparable non-immigrants.
These differences may reflect factors the data cannot distinguish, including the content or labour-market relevance of credentials, difficulties having foreign credentials recognized, differences in Canadian experience and networks, and employer practices, including discrimination (Oreopoulos 2011). In addition, PIAAC measures foundational skills, such as literacy and numeracy, rather than the occupation-specific and workplace skills employers look for, so part of the remaining gap may reflect differences in job-specific skills that PIAAC does not capture or employers’ difficulty recognizing immigrants’ skills.
The persistence of these differences after accounting for measured skills suggests that barriers beyond those skills warrant continued attention, since these barriers are unlikely to be addressed through selection and settlement policy alone. Faster and more consistent credential recognition would help, as would policies that address how employers assess foreign qualifications, for example, by giving employers better information about foreign credentials and work experience or encouraging skills-based hiring practices that rely less on where qualifications were obtained.
The results also support Express Entry’s emphasis on Canadian education, which awards additional points for Canadian educational credentials. Administrative evidence suggests, however, that Canadian study is more strongly associated with favourable outcomes when combined with meaningful Canadian work experience: former temporary residents with low earnings before admission, mostly those who held study permits, have lower earnings after admission than those with no Canadian work history (Zhang and Zhong 2026). This raises the question of whether Canadian education should be considered alongside evidence of labour-market attachment rather than on its own.
Post-Arrival Support and Integration
Selection criteria apply only to economic principal applicants. Spouses and dependants, family-class immigrants, and refugees are not selected on language or human capital, and about half of immigrants aged 25-65 in PIAAC do not speak English or French at home. For these groups, post-arrival support is the main policy lever.
This Commentary’s findings suggest three areas for future improvement. First, employment-focused language training is especially valuable, particularly for immigrants whose home language is neither English nor French, given the strong association between language background and measured skills and the close relationship between skills and immigrants’ earnings. Immigration, Refugees and Citizenship Canada’s research similarly finds that economic immigrants with no knowledge of an official language at admission have significantly weaker outcomes and points to the need for strengthened language training for this group (Zhang and Zhong 2026).
Second, ensuring newcomers access the right services at the right time matters. Existing evidence suggests that many newcomers do not make full use of available settlement services, with university-educated immigrants among the least likely to participate. Since limited awareness of available programs appears to be one barrier, improving awareness and accessibility may, therefore, matter as much as expanding services (Mahboubi and Zhang 2024). Low take-up may also reflect newcomers’ own judgment that some programs offer limited returns, particularly if they are not closely tied to employment.
Third, given that credible evidence on the effectiveness of settlement programs remains limited, the quality and effectiveness of existing language training should also be rigorously evaluated. One approach would be to examine linking program participation to later employment and earnings in administrative data so that resources can be directed to programs that demonstrate improvement.
Conclusion
This Commentary updates a decade-old picture of the skills gap between immigrants and non-immigrants in Canada, using the 2023 PIAAC survey. Immigrants’ measured skills remain lower than those of non-immigrants, especially in literacy. The gap is concentrated among immigrants who do not speak English or French at home, and it is present at every education level.
In the labour market, immigrants and non-immigrants with similar characteristics have similar employment rates, and immigrants’ earnings are more closely tied to their skills than those of non-immigrants. However, immigrants whose highest credential was obtained abroad have lower earnings and are less likely to work in high-skill occupations than comparable non-immigrants, while those with Canadian credentials fare as well as comparable non-immigrants and are less likely to be overqualified.
These findings have three broad policy implications. First, the close association between language background and immigrants’ measured skills, along with existing evidence on the earnings of economic principal applicants, suggests that the Express Entry program has scope to raise its minimum language threshold and place greater emphasis on advanced official-language proficiency, with ongoing evaluation of its effects on longer-term outcomes.
Second, the lower earnings and occupational outcomes of immigrants with foreign credentials, which persist after accounting for measured skills, support continued efforts toward faster and more consistent credential recognition and employer-side measures.
Third, because many immigrants are not selected based on language or skills, post-arrival support remains important, particularly employment-focused language training. However, the effectiveness of existing programs should be rigorously evaluated so that resources go to those that improve outcomes.
References
Andrews, Dan, Balázs Égert, and Christine de La Maisonneuve. 2025. Adult Skills and Productivity: New Evidence from PIAAC 2023. OECD Economics Department Working Paper 1834. Paris: OECD Publishing.
Anghel, Brindusa, and Pau Balart. 2017. “Non-Cognitive Skills and Individual Earnings: New Evidence from PIAAC.” SERIEs 8(4): 417–473.
Annen, Silvia. 2018. “Measuring Labour Market Success: A Comparison between Immigrants and Native-Born Canadians Using PIAAC.” Journal of Vocational Education & Training 71(2): 218–238.
Barrett, Garry. 2012. “The Return to Cognitive Skills in the Australian Labour Market.” Economic Record 88(280): 1–17.
Chiswick, Barry, and Paul W. Miller. 2010. “Occupational Language Requirements and the Value of English in the US Labor Market.” Journal of Population Economics 23 (1): 353–372.
Clarke, Andrew, and Mikal Skuterud. 2016. “A Comparative Analysis of Immigrant Skills and Their Utilization in Australia, Canada, and the USA.” Journal of Population Economics 29: 849–882.
Cukier, Wendy, and Kevin Stolarick. 2020. Immigrant Labour Market Outcomes and Skills Differences in Canada. Toronto: Higher Education Quality Council of Ontario.
Ferrer, Ana, David Green, and W. Craig Riddell. 2006. “The Effect of Literacy on Immigrant Earnings.” Journal of Human Resources 41(2): 380–410.
Green, David, and W. Craig Riddell. 2003. “Literacy and Earnings: An Investigation of the Interaction of Cognitive and Unobserved Skills in Earnings Generation.” Labour Economics 10(2): 165–184.
Hanushek, Eric A., et al. 2015. “Returns to Skills around the World: Evidence from PIAAC.” European Economic Review 73: 103–130.
Lancee, Bram, and Thijs Bol. 2017. “The Transferability of Skills and Degrees: Why the Place of Education Affects Immigrant Earnings.” Social Forces 96(2): 691–716.
Mahboubi, Parisa. 2017a. Power of Words: Improving Immigrants’ Literacy Skills. Commentary 486. Toronto: C.D. Howe Institute. May. https://cdhowe.org/publication/power-words-improving-immigrants-literacy-skills/.
———. 2017b. “Talkin’ ’Bout My Generation: More Educated but Less Skilled Canadians.” E-Brief 267. Toronto: C.D. Howe Institute. November. https://www.cdhowe.org/wp-content/uploads/2024/06/e-brief_267_web.pdf.
———. 2024. Quality Over Quantity: How Canada’s Immigration System Can Catch Up With Its Competitors. Commentary 654. Toronto: C.D. Howe Institute. February. https://cdhowe.org/publication/quality-over-quantity-how-canadas-immigration-system-can-catch-its/.
Mahboubi, Parisa, and Tingting Zhang. 2024. Harnessing Immigrant Talent: Reducing Overqualification and Strengthening the Immigration System. Commentary 672. Toronto: C.D. Howe Institute. December. https://cdhowe.org/publication/harnessing-immigrant-talent-reducing-overqualification-and-strengthening/.
Mueller, Richard E., and N. T. Khuong Truong. 2021. “Wage and Basic Skills Inequality between Immigrants by Immigration Admission Categories and Canadian Non-Immigrants.” Empirical Economics 62(3): 1327–1361.
OECD. 2017. Why Are Immigrants Less Proficient in Literacy than Native-Born Adults? Adult Skills in Focus 6. Paris: OECD Publishing. May.
———. 2024. Survey of Adult Skills 2023: Canada. Paris: OECD Publishing. December.
Oreopoulos, Philip. 2011. “Why Do Skilled Immigrants Struggle in the Labor Market? A Field Experiment with Thirteen Thousand Resumes.” American Economic Journal: Economic Policy 3(4): 148–171.
Richwine, Jason. 2022. “Skill Deficits among Foreign-Educated Immigrants: Evidence from the U.S. PIAAC.” PLOS ONE 17(8): e0273910.
Stijepic, Damir. 2020. “Employment Effects of Skills around the World: Evidence from the PIAAC.” International Labour Review 159(4).
Truong, N. T. Khuong, and Arthur Sweetman. 2018. “Basic Information and Communication Technology Skills among Canadian Immigrants and Non-Immigrants.” Canadian Public Policy 44(S1): S91–S112.
Tverdostup, Marina, and Dora Walter. 2026. Beyond Occupational Sorting: How Skills Shape Task Allocation and Immigrant Disadvantage. wiiw Working Paper 271. Vienna: Vienna Institute for International Economic Studies. March.
Xu, Li, and Feng Hou. 2023. “Official Language Proficiency and Immigrant Labour Market Outcomes: Evidence from Test-Based Multidimensional Measures of Language Skills.” Economic and Social Reports 3(1). Ottawa: Statistics Canada. Catalogue no. 36-28-0001. January 25. https://doi.org/10.25318/36280001202300100002-eng.
Zhang, Haozhen, and Jianwei Zhong. 2026. Labour Market Outcomes of Express Entry and Non-Express Entry Economic Immigrants. Ottawa: Immigration, Refugees and Citizenship Canada.