





by Peter MacKenzie and Mark Zelmer
- Although private credit funds remain a limited source of financing for Canadian businesses, Canadian financial institutions have substantial exposures to foreign private credit funds. This Commentary examines whether the rapidly growing global private credit market could pose systemic risks to Canada’s financial system.
- An illustrative stress test finds that direct losses to Canada’s major banks would be manageable, even under extreme assumptions. The most severe scenario produces losses of approximately 6 percent of aggregate Common Equity Tier 1 capital in the base case and 11 percent in the upper exposure case. That said, drawdowns of $53 billion to $95 billion in committed credit facilities could constrain lending to other borrowers if bank access to funding markets was strained more generally.
- Systemic risks could grow as private credit expands, yet gaps in disclosure and official statistics make these risks difficult to monitor. This highlights the need to enhance transparency around private credit exposures and loan valuations, review capital requirements for exposures to these funds, and expand stress testing to capture potential disruptions to credit supply.
The authors extend their gratitude to Mawakina Bafale, Colin Busby, Alex Ciappara, Bryan Radeczy, William B.P. Robson, and several anonymous referees for valuable comments and suggestions. The authors retain responsibility for any errors. Mark Zelmer is a former Deputy Superintendent at OSFI and currently a director of State Street Trust Company of Canada. The views expressed in this paper are his own and should not be attributed to any organization where he is, or has been, an employee or director.
1. Introduction
Over the past 20 years, private credit investment funds have emerged as a significant source of financing for middle-market business investment in the United States.11 Most of the borrowers from these funds appear to be concentrated in the software, health, and consumer cyclical sectors. That said, private credit funds have also become significant financiers of AI infrastructure, notably data centres. Their exposures are typically structured as asset-based or infrastructure credit rather than the corporate direct lending that dominates middle-market portfolios, and they sit largely outside the rated universe discussed below. Some of the larger funds attracted public attention in 2026 when they experienced large redemption requests from investors in response to rising loan delinquencies. While the private credit investment fund sector in Canada remains fairly small, Canadian banks have significant exposure to the global private credit fund sector because they have extended more than $180 billion in committed credit facilities to both private equity and private credit funds through a variety of channels.22 Unfortunately, data on the split between credit extended to private credit funds versus that to private equity funds are not publicly available.
In this Commentary, we assess whether stress in the global private credit fund market could potentially generate systemic risk in the Canadian financial system. For this analysis, we define systemic risk as the possibility that disruptions in the global private credit market could impair the supply of credit to the Canadian economy without public intervention to stabilize the situation.
We focus on two bank-lending channels through which stress in the private credit fund market could reach the Canadian financial system.
- The first is cross-border: the six major Canadian banks’ credit lines to private equity and private credit funds, most of which operate in the United States.
- The second is domestic: lending by the six major banks to Canadian non-bank lenders, a category that is broader than the private credit investment funds market.
We combine available public exposure statistics with surveillance data from Morningstar DBRS to construct an illustrative stress test of direct bank losses and the additional lending that potential drawdowns of credit facilities would require. Our results illustrate the potential scale of these effects under the stated assumptions. The results also shed some light on how sensitive they are to assumptions regarding inputs that public disclosures do not fully reveal, such as advance rates (which cap loans at a percentage of collateral), drawdown behaviour, collateral values, and facility types.
Overall, our analysis suggests that direct losses through the two bank-lending channels appear manageable in aggregate. We estimate a base case of total private credit loan value and an upper bound case which combines all private equity and credit activity. In the most severe scenario examined, losses amount to roughly 6 percent of aggregate Common Equity Tier 1 (CET1) capital (or roughly 80 basis points in terms of bank CET1 ratios) in the base case, and 11 percent (or roughly 150 basis points in terms of bank CET1 ratios) in the upper exposure case. Banks should be able to absorb these losses, particularly given their strong annual profitability, with returns on equity currently exceeding 13 percent.
The assumed drawdowns of credit facilities in the stress test would also require the six major banks to extend $53 billion to $95 billion in new credit. This, too, should be manageable in normal market conditions. However, if private credit stress coincided with broader stress in bank funding markets, it might constrain banks’ ability to supply credit elsewhere in the financial system.
On balance, global private credit markets do not appear to pose a serious systemic risk to the Canadian financial system at this stage. That does not mean that we should ignore the issue. Global private credit markets are continuing to expand fairly rapidly as a source of financing for firms around the world. Thus, we encourage policymakers to continue working on:
- establishing consistent definitions and disclosure requirements for private credit and private equity exposures through investment funds and closing the existing gaps in official credit statistics;
- reviewing whether bank capital requirements adequately reflect the risks of extending credit to these investment funds. Supervisory stress tests should also incorporate the potential wider effects of stress on funding and credit supply; and
- encouraging private credit funds to publish more information about their loan valuation practices and the share of income consisting of accrued interest added to loan principal rather than received in cash.
2. Defining Private Credit
Discussions on private credit can be confusing because different commentators often employ different definitions of what they mean by private credit. Here in Canada, Canadian life insurers and pension plans have been profitably extending credit directly to businesses in Canada and abroad for decades. While such lending is often included in some definitions of private credit, it is not the main focus of this paper. Instead, we are focused on a narrower definition of private credit: specifically, credit extended to businesses by investment funds that mainly lend directly to businesses (i.e., private credit funds). To be clear, this definition excludes more conventional investment funds that arguably lend indirectly to firms through their acquisition and holding of publicly traded corporate debt securities as part of their investment portfolios. Private credit funds are mainly sponsored and operated by independent asset managers, although in some cases these funds are now also being offered by Canadian banks and life insurers through their asset management affiliates.33 The assets held in investment funds managed by the asset management affiliates of banks and insurers are not included in the assets of the parent bank and insurers because those funds are legally owned by their investors, not by the parent bank or insurer. Hence, they are not counted as part of credit extended by the parent bank or insurer in official credit statistics.
Private credit funds have grown into a roughly US$2 trillion global market (Jang et al. 2025).44 The IMF estimated the global private credit investment fund market at US$2 trillion in assets and committed capital in 2023, about three-quarters of it in the United States, where private credit now rivals broadly syndicated loans and high-yield bonds in size (IMF 2024). On direct lenders’ middle-market focus, see: Jang et al. (2025). Such funds remain a relatively limited source of financing for Canadian businesses, while Canadian financial institutions have substantial exposures to private lending abroad. Using a broader definition that includes direct lending by pension funds and insurers as well as investment-fund lending and bank credit extended to private credit funds, the Bank of Canada estimates Canadian financial institutions’ private credit exposures at about $500 billion at the start of 2026, most of which has been lent in the United States (Chan et al. 2026).
That broader total is not the fund-financing exposure modelled in this Commentary. We take a narrower focus, looking specifically at private credit funds and the credit lines that Canada’s six major banks extend to them and to Canadian non-bank lenders. Our own range for the exposure modelled here runs from roughly $54 billion, our base estimate of the major banks’ committed lines to private credit funds, to $181 billion, an absolute upper bound that treats every dollar of the banks’ committed lines to private equity and private credit funds as private credit (section 5).
Business credit has traditionally come from financial institutions, either directly from their balance sheets or through their underwriting of debt issues in capital markets. Private credit investment funds (Box 1), sponsored and managed by asset managers, lend outside that framework and now finance a substantial share of American middle-market business investment. Three features complicate the assessment of risks in private credit funds: the valuation of illiquid loans, uneven disclosure, and financing structures that connect funds to other financial institutions.
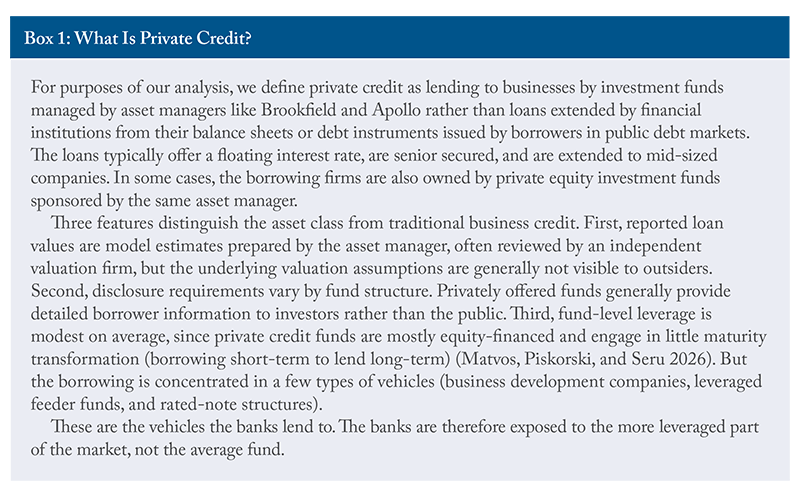
As with other illiquid loans, fund loans are generally valued using models rather than observable market prices. Adding unpaid interest to a loan balance can delay recognition of borrower distress; this practice also occurs in bank lending. Investors and supervisors may have access to information that is not publicly disclosed. Bank credit lines, rated notes, and feeder funds can create several claims backed by the same underlying loans. These features can make it difficult for outside observers to assess the funds’ risks and the links through which stress might spread.
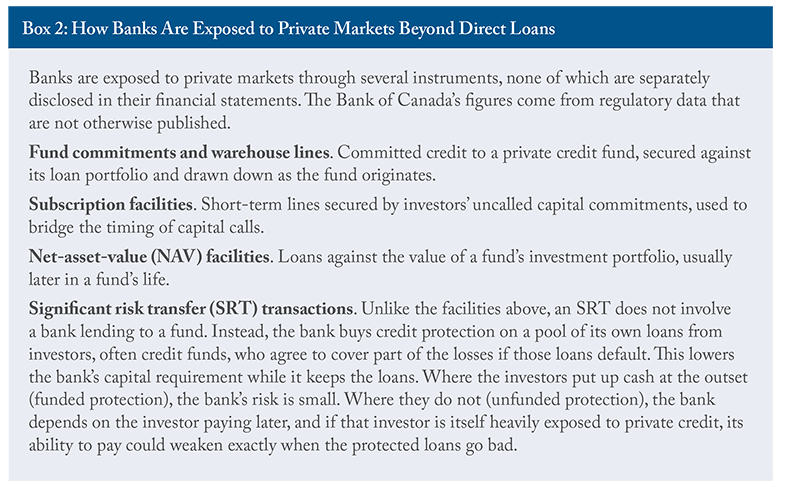
Canada’s domestic private credit investment fund market remains small.55 Precise estimates of the size of the Canadian private credit fund market are hard to come by because Canadian credit statistics do not identify private credit funds separately as a source of funding. Loans extended by domestic private credit funds are captured in aggregate credit statistics. In Statistics Canada Table 36-10-0640, they sit inside the non-bank portion of non-mortgage loans, pooled with finance companies and other non-bank lenders; so the credit is counted but the lender type is not identified. Canadian pension plans, life insurers, and the six major banks nevertheless have substantial exposures to private lending both in Canada and abroad through different channels (Chan et al. 2026).66 The authors use a broader definition of private credit than this study. Much of the exposure for pension funds and insurers comes from direct lending, including lending undertaken with private credit managers. Banks finance private equity and private credit funds through commitments, warehouse lines for loans and subscription facilities, and some also sponsor funds through their asset management affiliates (Box 2). At the end of 2024, the six major banks had $181 billion of committed credit to both private equity and private credit funds. Unfortunately, data are not available to identify what portion is accounted for by private credit funds.
Recent redemption pressures at some large retail-oriented funds brought the private credit fund market risks into sharper focus. Surveillance by Morningstar DBRS of more than 500 rated middle-market borrowers found the trailing default rate reached almost 4 percent in early 2026 and 17 borrowers were downgraded in 2025 versus nine in 2024 (Dimler and Desai 2026). Because the underlying loans cannot be sold quickly, some funds limited payouts to their pre-set quarterly redemption limits.77 Apollo Debt Solutions BDC received redemption requests equal to 11.2 percent of outstanding units in the first quarter of 2026 and capped the payout at 5 percent. Private credit funds managed by Blackstone, Blue Owl, BlackRock, and Morgan Stanley faced similar pressures. See Nicoll (2026) and Su (2026). See also Financial Stability Board (2026).
The policy challenge is to assess the scale and quality of financial institution exposures to these funds despite inconsistent definitions and incomplete public disclosure. Bank financing of funds also raises a question about capital requirements. A bank’s senior facility to a private credit fund can attract a lower capital requirement than direct lending because investor capital absorbs losses first. The policy question is whether that treatment adequately reflects the risks of the exposure. Public information does not consistently reveal the collateral quality, lending terms, or loss-absorbing protection behind these facilities, limiting independent assessment.
3. How Private Credit Funds Work
Part of the challenge with private credit investment funds is that the debt obligations held by those funds do not trade like bonds issued in public debt markets. Consequently, there are no readily observable market prices to discipline the values that their asset managers and sponsors assign to them. Instead, the asset managers value their fund assets using sophisticated pricing models that may not fully capture all of the nuances of the assets. Having third-party valuation is, undoubtedly, good practice, but the inputs, the frequency of review, and the share of the portfolio covered are not visible to anyone outside the fund. In accounting terms, these are Level 3 assets, valued using unobservable inputs; the share of a pension fund’s or insurer’s assets reported at Level 3 is one of the few public indicators of how much of its balance sheet is marked by model rather than by market. Valuations can also lag, especially when market prices are volatile.
Another potential issue is that when a borrower runs into trouble, the fund managers often agree to add unpaid interest to the loan balance, a payment-in-kind (PIK) arrangement, instead of collecting it in cash. Therefore, a first visible sign of stress might be a rising loan balance in the private credit fund rather than a payment that fails. Fund fees are also commonly charged against income earned by the private credit fund, including interest accrued but never received, which blunts the incentive to recognize problems promptly.
While most of those funds have traditionally been sold to knowledgeable institutional investors, some of the newer funds have sought to attract retail investors with promises of periodic redemptions even though the debt obligations held by the funds cannot be sold quickly. These funds therefore set redemption limits in advance, commonly 5 percent of net assets per quarter and disclose them, so that the liquidity offered to investors matches the liquidity of the assets. However, there is a cost to having these limits in place. Investors who know a limit exists have an incentive to get their requests in before it binds, so a known redemption cap can bring a run forward rather than prevent it (Financial Stability Board [FSB] 2017, 2023).
None of these features are improper on their own. But when combined, they may allow credit problems to build behind the scenes and surface late.88 Private-credit managers have increasingly used “continuation vehicles” to transfer still-outstanding loans from an older fund into a newly capitalized vehicle, allowing investors in the older fund to cash out even where extensions of the underlying loans would otherwise exceed the fund’s life. These transfers may occur at a discount to the older fund’s reported net asset value. See: Deane, Stephen, and Ken Robinson. 2025. “Continuation Funds: Ethics in Private Markets, Part I.” CFA Institute Research and Policy Centre. September, pp. 1, 16–17, 29; PGIM. 2026. “From Niche to Mainstream: Continuation Vehicles Redefine Private Markets.” February 26, pp. 1–3.
4. Private Credit in Canada
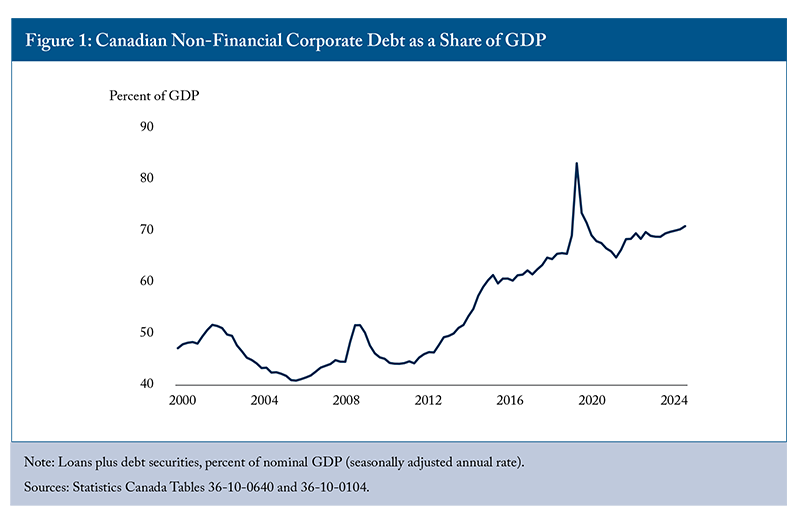
Canadian businesses carry considerably more debt than they did two decades ago. Loans and debt securities sat between roughly 40 and 50 percent of GDP through the 2000s and are now approaching 70 percent of GDP today (Figure 1). The 2020 spike reflected the collapse in GDP during the COVID-19 shutdowns. International comparisons point the same way. The Organisation for Economic Co-operation and Development (OECD) puts the gross debt of Canadian non-financial corporations at 163 percent of GDP in 2024, high relative to other OECD countries (OECD 2025).99 The OECD figure is a broader, non-consolidated measure that includes intercompany lending and other debt instruments, which is why it sits well above the loans-plus-securities measure in Figure 1. See OECD (2025), Figure 1.16.
We are primarily concerned with non-mortgage loans in this paper. These loans have now reached about $1 trillion in value and are extended by both bank and non-bank entities. The Bank of Canada estimates that non-bank lenders have supplied a broadly stable 15 percent of Canadian businesses’ external financing over the past decade (Chan et al. 2026), so the growth of private credit abroad has not yet changed how Canadian businesses are financed.
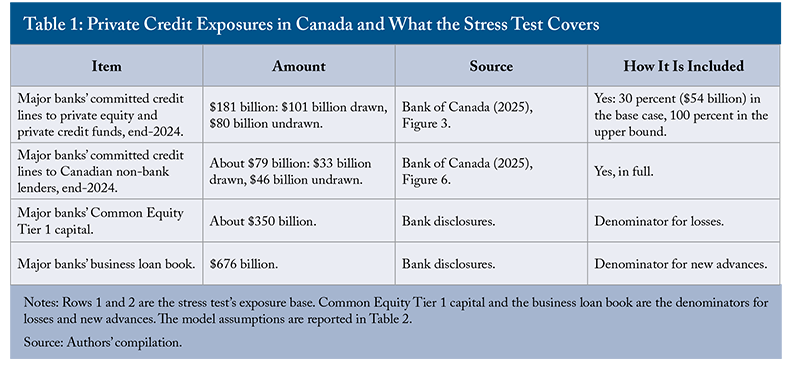
We first look at the banks (Box 2). The Bank of Canada’s Financial Stability Report 2025 shows that the six domestic systemically important banks (D-SIBs) had committed $181 billion in lending to private equity and private credit funds globally at the end of 2024. Of that amount, $101 billion had been drawn. The remaining $80 billion consisted of undrawn warehouse and credit-line capacity – funds the banks had committed but not yet advanced. The $181 billion represents slightly more than a quarter of the $676 billion in business loans held by the banks, though the Bank of Canada estimates that loans to private credit fund managers account for only about 1 percent of their total lending (Chan et al. 2026). Canadian delinquency data for these facilities are not publicly available. US supervisory data show that bank credit lines to private credit vehicles have carried lower probabilities of default and lower delinquency rates than their other lending to non-bank financial institutions (Berrospide et al. 2025).
Now one might wonder, why would private credit and equity funds be leaving so much undrawn capital? Basically, they treat committed bank lines as their liquidity backstop. When markets tighten, fundraising slows, exits stall, and funds draw on those lines. Unfortunately for the banks, private credit funds are likely to draw on this capital in times of financial stress, which usually corresponds to greater economic uncertainty and possibly strain in bank wholesale funding markets. Banks may be required to “pay up” at precisely the moment they are trying to conserve their balance sheet strength.
Banks are far from the only Canadian institutions in this private credit ecosystem. The eight largest Canadian pension managers oversee more than $2 trillion in assets, with disclosed private equity allocations exceeding $400 billion and private credit of $100 billion.
The Bank of Canada, using a broad definition that counts any loan from a non-bank to a business, puts the large pension funds’ private credit at about $215 billion at the end of 2025, roughly 9 percent of their invested assets (Chan et al. 2026). The $215 billion exceeds the $100 billion the managers themselves disclose because the Bank counts any loan from a non-bank to a business, while the managers’ own disclosures cover only what each labels private credit. Much of this money is lent directly by the pension funds themselves rather than through investment funds offered by other asset managers, and most of it is deployed abroad.1010 See Moody’s (2026); Achrekar (2025), p. 3; and Gonzales (2026). Direct lending gives the pension funds a clearer view of the credit risk than they would have as investors in a private credit fund, and their long investment horizons and limited reliance on short-term funding allow them to carry illiquid assets through periods of stress (Chan et al. 2026; Macklem 2026). Their experience during the Global Financial Crisis, where some pension funds held sizeable positions in asset-backed commercial paper that had to be restructured, as well as in the March 2020 market turmoil, when the largest pension funds managed sizeable liquidity demands from margin calls and currency hedges, is the best Canadian evidence of that resilience (Bédard-Pagé et al. 2021).
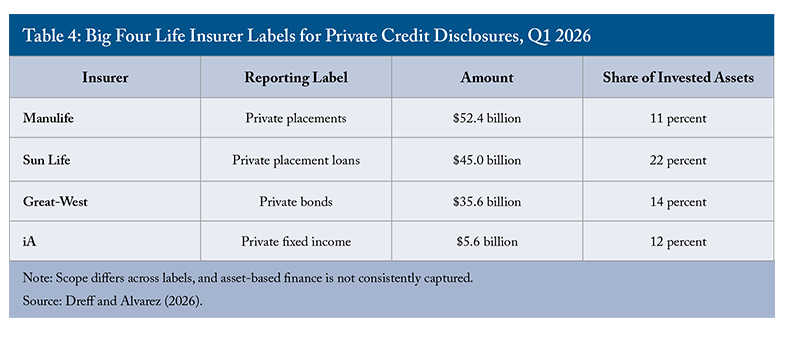
Canadian life insurers have also been active players in the private credit ecosystem. The largest insurers have extended credit privately for decades, using both their general account and segregated fund assets. The Bank of Canada estimates that the three largest life insurers hold just over $200 billion of private credit directly on their balance sheets, about 22 percent of their invested assets.1111 To be clear, these data do not include any private credit loans that are held in investment funds managed by their asset management affiliates. The share of their assets in private credit has been very stable for five years and is overwhelmingly investment grade (Chan et al. 2026). However, the life insurers’ own disclosures are under different labels and add up to much less than the Bank of Canada number (Table 4).
Dreff and Alvarez (2026) find the portfolios of major life insurers are more traditional than many critical observers feared but less comparable across insurers, due to varying definitions of private credit. Life insurers typically hold private credit assets directly, including loans originated or managed by external private credit managers, rather than through fund units. The Office of the Superintendent of Financial Institutions (OSFI) capital rules treat a limited partnership interest in a private credit fund much like equity unless the insurer can look through to the underlying assets, which makes fund units expensive to hold. Due to this capital treatment, the major insurers have generally partnered with fund managers and lent directly.1212 Office of the Superintendent of Financial Institutions, Life Insurance Capital Adequacy Test – Guideline (2025), sections 3.1.2, 3.1.5, 5.2.1, and 5.4. See also Dreff and Alvarez (2026), noting that a limited partnership interest in a third-party private credit fund is treated as equity-like under the Canadian capital regime and receives more punitive treatment than a rated bond, and Torys (2026), which recommends look-through treatment for such investments.
Together, the pension and life insurance estimates exceed $415 billion under Chan et al.’s broad definition. These holdings span domestic and foreign private credit and do not include publicly traded corporate bonds. The article does not provide the borrower-location breakdown needed to calculate these institutions’ share of Canadian corporate debt. Dividing their private credit holdings by a Canadian corporate-debt total would therefore be misleading.
The largest banks and life insurers are also getting more involved in the private market ecosystem through their asset management affiliates. This allows them to transfer some of the loans they originate off their balance sheets and into private credit and private equity investment funds managed by their affiliates or to other market participants.1313 BMO, for example, has partnered with Oak Hill Advisors and, since early 2025, Canal Road Group; while Sun Life, for example, acquired a 51 percent stake in Crescent Capital Group, a global alternative credit manager with roughly US$50 billion under management, in 2021, and purchased the remaining 49 percent for $829 million in a transaction completed on March 31, 2026. See: O’Hara, Clare. 2026. “Sun Life to Pay Almost $3-Billion for Stakes in Private Credit and Real Estate Management Firms.” The Globe and Mail. March 30.
4.1 Emerging Signs of Strain in Private Credit Funds
The Canadian financial system’s exposure to the global private credit fund sector is only really a problem if the funds are not valued correctly and the underlying borrowers are at risk of defaulting. This raises the question of how the underlying credit is performing. Public data are scarce because loans supplied by private credit funds are, by construction, not actively traded. Surveillance data from Morningstar DBRS, which maintains private credit ratings on more than 500 middle-market borrowers across North America and Europe, offers some insight (Dimler and Desai 2026).
Credit rating agencies assign borrowers letter grades ranging from AAA through C-. The share of borrowers that Morningstar DBRS rated from CCC (high) to C, the tiers indicating high financial stress and greatest risk of default, rose from under 13 percent to about 16 percent in early 2026. At their peak, downgrades outnumbered upgrades by a factor of 3.3. Notably, 94 percent of downgrades to default over the past year were distressed exchanges rather than payment defaults. Distressed exchanges often involve payment-in-kind deferrals, meaning unpaid interest is added to the loan balance instead of being paid in cash (Gao and Dimler 2026).
These developments suggest that now is a good time to assess whether the Canadian financial system’s links to the global private credit fund sector could potentially be a source of systemic risk.
5. A Two-Channel Stress Test
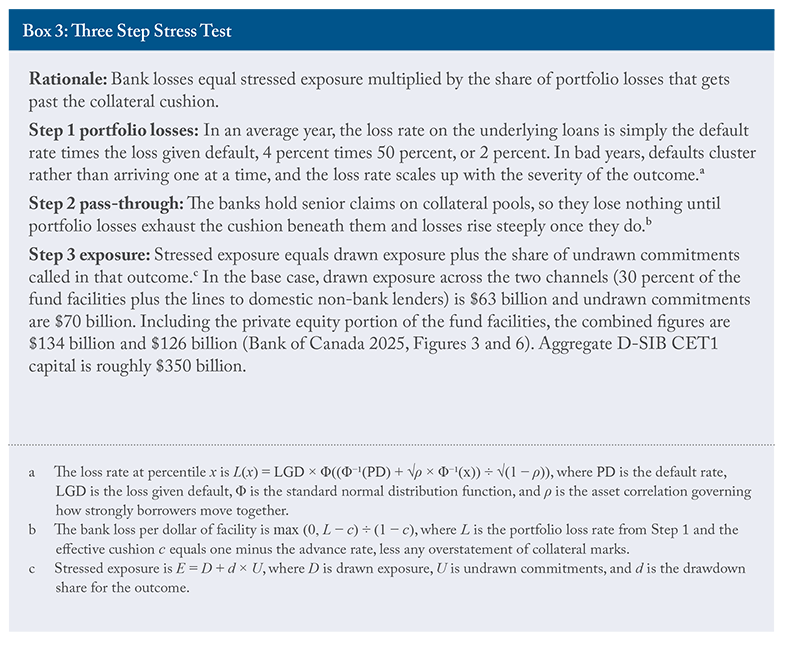
Though we cannot conduct a detailed stress test due to a lack of data, we attempt to show some illustrative scenarios using the public data that are available. The test asks how much Canada’s six largest banks would lose, and how much new lending they would have to provide, if borrowers from private credit funds ran into trouble. We estimate that the funds’ loans lose about 2 percent of their value in a typical year, 11 percent in a severe (1-in-100) year, and 17 percent in an extreme (1-in-1,000) year. Banks typically lend about 70 cents per dollar of those loans, so fund investors absorb the first 30 cents of any loss. Because that cushion may be thinner than reported, we also test cushions of 10 cents and zero. Funds also draw on unused credit lines as stress builds, which raises the banks’ exposure. The rest of this section sets out the exposures included and the results, and Box 3 gives the technical details.
First, we need to decide the scope of exposures to be included in the stress test. Table 1 shows the exposures and balance sheet totals included in the stress test. We exclude pension funds and life insurers from the loss calculation. Both lend directly rather than through private credit funds, so the risk of the underlying loans is theirs to underwrite rather than a layered claim on a fund manager’s collateral marks. Both pension funds and insurers also have stable long-term funding from pension plan beneficiaries and life insurance policyholders, which significantly limits the risk of a run on their liabilities in times of stress and certainly relative to what a bank might experience in such circumstances. A pension plan that loses money on private credit would typically absorb the loss through adjustments to future contribution rates or benefits; its members cannot withdraw, so the loss stays inside the plan rather than propagating to its counterparties in the financial system.
Losses large enough to raise questions about the stability of the pension system would be a serious public policy problem, but a different one from the systemic risk examined here and are therefore outside the scope for purposes of this analysis. Insurers can fail, but Canada’s insurer resolution arrangements, including the Assuris policyholder protection fund, are designed to resolve a failing insurer without imposing any significant losses on other parts of the financial system or the public. Hence, we have also excluded life insurer holdings of private credit from our analysis. In light of these two decisions, one can consider our stress test estimates as a lower-bound estimate of an economy-wide impact of a private credit market crash.
We also exclude from the stress test credit extended by the asset management affiliates of the major banks and life insurers via the investment funds they sponsor. Here, our rationale is that investors in private credit funds offered by those asset management affiliates are the ones that legally bear the risks inherent in these funds, not the parent bank or life insurer that owns the asset manager. Having said that, a parent bank or life insurer might become exposed to litigation and reputational risk if evidence were to emerge that their asset management affiliates that sponsored the affected private credit funds had behaved inappropriately.
Accordingly, the stress test covers two exposures on the banks’ balance sheets. The first is the credit lines described in Box 2 that the major banks extend to private equity and private credit funds, most of which operate in the United States: $181 billion committed at the end of 2024, $101 billion of it drawn. These lines are extended to the funds themselves rather than to their managers, and are secured on fund assets or on investors’ uncalled commitments. The second is the banks’ committed lines to Canadian non-bank lenders, about $79 billion, $33 billion of it drawn (Bank of Canada 2025, Figure 6).
The Bank of Canada reports bank lending to private equity and private credit funds as a single $181 billion figure and does not publish the split. However, relative market size in the United States provides a guide. In the US, there is US$1.5 trillion to US$2 trillion of private credit (FSB 2026) against roughly US$5 trillion of private equity (Preqin 2026). That implies a private credit share of a quarter to 30 percent. Credit actually extended gives the same answer: US banks had committed about US$95 billion to private credit vehicles at the end of 2024 (Berrospide et al. 2025) against roughly US$300 billion to private equity and private credit funds combined (Levin and Malfroy-Camine 2025), and the Bank of Canada puts Canadian banks’ loans to private credit fund managers at no less than $40 billion (Chan et al. 2026), 22 percent of the $181 billion committed and 40 percent of the $101 billion drawn. We use 30 percent as the base case, which puts roughly $54 billion of the committed fund facilities with global private credit funds.
The 30 percent share for private credit funds remains an estimate, so we present results two ways.
- The base case scales the fund channel to its estimated private credit share.
- An upper bound applies the full combined private equity and private credit exposure in case the split is wrong.
5.1 Modelling Portfolio and Bank Losses
Next, we estimate a distribution of losses on the underlying loan portfolios using a standard single-factor credit model, the same class of model, albeit a simpler implementation, used by the Basel capital framework (BCBS 2005). The model’s normal factor structure is known to understate how fat the tails are in a real crisis; we compensate by reporting the 1-in-1,000 outcome and a full pass-through case in which the collateral provides no protection at all, rather than relying on the model’s tails alone.
The normal-distribution assumption applies to the common economic factor and borrower-specific risk factors, not to defaults or portfolio losses. Conditional on the common factor, borrower-specific shocks are independent; exposure to the shared factor nevertheless makes defaults cluster. Given limited public data, we use this Basel-style structure as a transparent benchmark that produces comparable stress scenarios from a small set of inputs (BCBS 2005, section 4.2). Unusually severe shocks or stronger dependence can make losses worse than the model implies. The “1-in-100” and “1-in-1,000” labels are therefore model-implied percentiles rather than verified crisis frequencies. The severe percentile and full pass-through case test sensitivity to stress severity and collateral protection; we do this to try to account for the possibility of larger tails than the normal distribution assumption would normally include.
Our model takes the current Morningstar DBRS default rate and a stressed recovery rate and estimates how portfolio losses behave when a common economic shock pushes many borrowers into default at the same time. The correlation in the model is between the borrowers and the economy, not between the borrowers themselves.
Then, we translate portfolio losses into bank losses. Bank facilities are senior claims on collateral pools, so the banks lose money only after the capital beneath them is exhausted, and the protection that seniority provides depends on advance rates, which limit loans to a maximum percentage of an asset’s or collateral’s value, and on whether reported collateral values are accurate. We make sure to take into account payment-in-kind accrual in two ways: the DBRS default rate counts distressed exchanges, including PIK deferrals, as defaults, and the cushion-erosion case assumes that accrued interest and stale valuation marks have inflated reported collateral values by 20 points.
Finally, we allow drawdowns on undrawn commitments, which raise the exposure base in the outcomes where losses are largest.
Table 2 reports the parameters, including a case in which stale valuations and payment-in-kind accrual have eroded the collateral cushion by 20 points. The default and recovery assumptions are anchored to the DBRS record, while the advance rate, the drawdown shares, and the share of private credit are our own estimated scenarios.1414 We apply a single middle-market corporate loss distribution to both channels. The domestic non-bank lenders in Figure 6 of the Bank of Canada’s 2025 Financial Stability Report lend against consumer, equipment, and property collateral, so their loss behaviour differs from that of rated middle-market borrowers. We use the common distribution rather than two separate distributions so that both channels are stressed under the same scenarios.
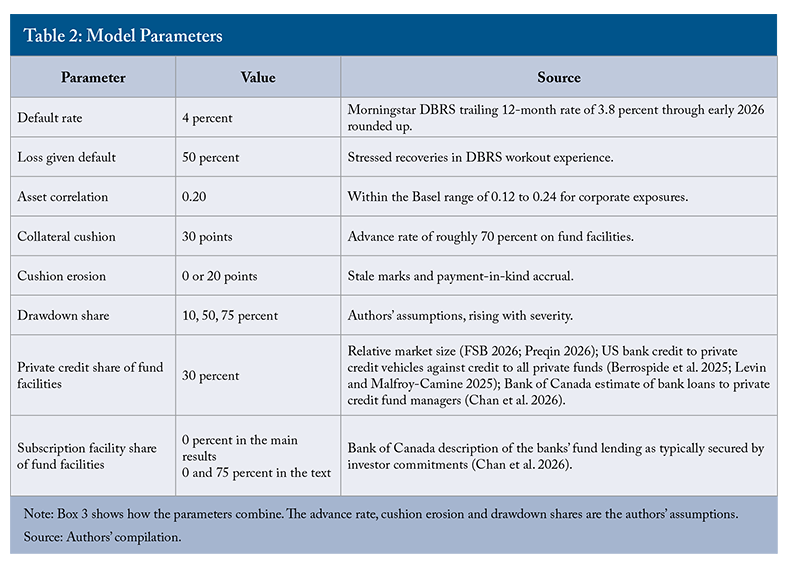
Table 3 reports the stress test results in two panels. The base case scales the fund channel to its estimated private credit share, and the upper bound applies the combined private equity and private credit exposure in full. In an average year, portfolio losses run about 2 percent, and the banks lose little under any structural assumption.
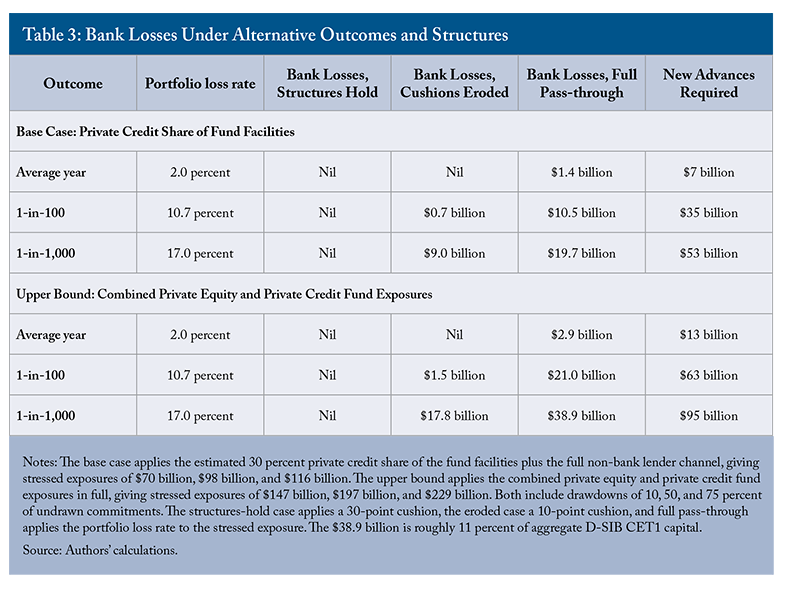
In a 1-in-100 outcome, portfolio losses reach just under 11 percent, yet the banks essentially lose nothing if structures hold, because losses of that size are absorbed by the capital beneath them. If cushions have eroded, the banks lose between $0.7 billion and $1.5 billion. If structures fail entirely, they lose $10.5 billion to $21 billion. In a 1-in-1,000 outcome, the base case produces losses of roughly zero, $9 billion, and $20 billion across the three structures, and even the upper bound tops out at $38.9 billion, about 11 percent of aggregate Common Equity Tier 1 (CET1) capital or 150 basis points in terms of a bank CET1 ratio. Even that extreme should be absorbable, especially given the inherently strong returns on equity (13 percent and more) that major banks post from one year to the next. These are aggregates across the six banks, and the exposures from one bank to another are uneven. Disclosed non-bank lending runs from about 11 percent of BMO’s loan book to 4 percent at Scotiabank (The Logic 2026), so a concentrated bank would fare worse than the aggregate suggests. Bank losses are not proportional to portfolio losses; they stay near zero until portfolio losses exceed the collateral cushion, then rise steeply. Cross-exposures between the banks, the insurers, and the pension funds are not observable in public data and are not included, but should still be considered by policymakers when reading the results.
Table 3 treats every fund facility alike, while in practice they likely differ. Subscription lines, secured on investors’ uncalled commitments rather than on the fund’s loans, do not depend on how the underlying private credit performs and have historically produced negligible losses; the Bank of Canada describes the Canadian bank private credit fund lending as typically secured in this way (Chan et al. 2026). If half of the fund facilities are subscription lines, the 1-in-1,000 full pass-through loss falls from $19.7 billion to $15.6 billion in the base case and from $38.9 billion to $25.2 billion at the upper bound. The main results are conservative on this count. They are not conservative on the significant risk transfer exposures described above, and any cross-exposures among banks, insurers, and pension funds are outside the test and would add to losses in a stress.
In the extreme outcome, drawdowns alone require the banks to advance roughly $53 billion of new credit in the base case, and up to $95 billion if the full fund book is engaged, the latter equal to about 14 percent of their $676 billion business-loan book. The banks could accommodate it by raising more wholesale funds, or by tightening credit to everyone else if their own funding channels are constrained due to broader stresses in financial markets at the time of the stress test. Moreover, whatever committed capacity they decline to renew transmits the stress onward, since non-bank lenders fund $364 billion of credit partly on warehouse leverage. If the banks are looking to preserve liquidity, they might reduce or decline to renew these facilities, leading to non-bank lenders having less ability to refinance existing loans, let alone finance new ones. Even if the banks’ credit losses remain manageable, the stress from a market drawdown would be transmitted to businesses by making credit harder to get. That transmission to business credit, rather than the banks’ own losses, is the more plausible way for private credit stress to reach the Canadian economy.
5.2 The Measurement Challenge
The level of risk seems manageable from the Canadian perspective, at least based on the public data we have available. The stress test suggests the banks’ direct losses would be manageable. However, some of the inputs included – even in upper bound estimates – cannot be verified, because there is no accepted definition of private credit and each institution reports its exposures on its own terms. The result is that neither the authorities nor the market can say with confidence how large the exposure is or how it is secured.
Pension plan allocations to private credit are also inconsistently disclosed, and insurer exposure to direct lending is opaque. The major bank exposures have only appeared once in the Bank of Canada’s Financial Stability Report (Figures 3 and 6 in the 2025 report, using end-2024 data) and are not part of any regular data release. The 2026 report discusses private credit qualitatively but does not update the exposure breakdown, so end-2024 remains the most recent public vintage (Bank of Canada 2026). The Bank’s August 2026 staff article adds a time series of bank loans to private credit fund managers but not the breakdown of commitments (Chan et al. 2026). Statistics Canada does not publish business lending split by borrower size, and private credit fund assets in Canada are not reported in official statistics.
Canadian insurers’ private credit portfolios are no different, with each of the big four life insurers reporting their exposure under a different label, with a different scope (Table 4). The same underlying investment can also be reported and capitalized entirely differently depending on structure. A limited partnership interest in a private credit fund is treated as equity-like, while the same exposure routed through a rated feeder-fund note can be reported as a bond. Under OSFI’s capital rules, unrated exposures attract a 6 percent charge, whereas an A-rated public bond attracts roughly 2 percent, so the label can make a difference to the insurer. This encourages life insurers to participate as partners in lending by private credit funds rather than as investors in the private credit fund itself.
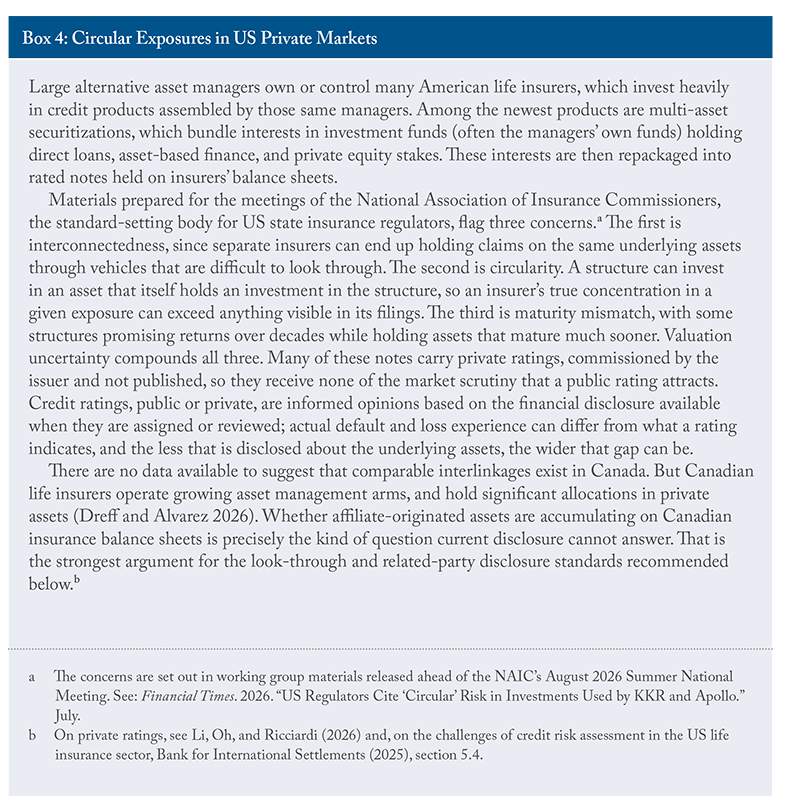
Canadian banks’ disclosures fare no better. Their private credit exposures span all the instruments described in Box 2, but no common taxonomy governs how they are reported. As a result, neither investors nor supervisors can compare exposures across institutions or aggregate them into a system-wide picture. The Financial Stability Board’s 2026 report on vulnerabilities in private credit and the Basel Committee’s 2024 guidelines on counterparty credit risk management both press banks and supervisors to understand their exposures to non-bank counterparties. But no common definition or disclosure template for private credit has been agreed. One of us has argued elsewhere, in a different context, that the best time to educate stakeholders about complex financial structures is when times are good (Zelmer 2025). The logic applies with at least equal force here. Recent regulatory attention in the United States shows the kind of problem that market opacity can hide (Box 4).
6. Recommendations
We offer five recommendations for policymakers, with the goal of increasing Canadian business investments, while also keeping the financial system safe from systemic risks in the private credit market.
1. Establish a consistent definitional and disclosure framework for private credit and private equity exposures.
Prudential regulators, working with the Bank of Canada and provincial securities regulators, are encouraged to consider adopting a common taxonomy for private markets exposures across banks and insurers, ideally extended to pension plans as well. We suggest that the taxonomy distinguish private placements, asset-based finance, direct lending, and exposures arising via independently managed investment funds. Consideration should be given to splitting committed amounts between drawn and undrawn, and to applying look-through so that the same underlying exposure is reported the same way regardless of the vehicle through which it is held.
Disclosure should also identify exposures originated or managed by affiliates, so that supervisors and investors can see whether the interlinkages now drawing US regulatory attention (Box 4) have Canadian counterparts. We recommend that disclosure of fund exposures also cover how the underlying assets are valued, including whether, and for how much of the portfolio, the manager’s valuations are reviewed by an independent valuation agent. Such standards would ideally be agreed internationally through the Financial Stability Board and the Basel Committee, but Canadian officials need not wait to set domestic expectations, especially in the current geopolitical environment where reaching any international agreements can be very challenging.
2. Close the gaps in official statistics.
Statistics Canada and the Bank of Canada are encouraged to publish business lending split by borrower size, decompose the non-bank lending pool, and make the Financial Stability Report’s chart of bank exposures to non-banks, and private credit funds in particular, a regular series.
3. Review capital incentives that steer credit into less visible channels.
A bank’s senior credit line to a private credit fund is a different exposure from a direct loan to the fund’s borrowers. The bank sits above a cushion of investor capital that absorbs the first losses, and its collateral is a diversified pool rather than a single credit, so there is a sound case for a lower risk weight. US evidence shows that structured lending to private credit funds can qualify for risk weights near 20 percent1515 OSFI (2026), Capital Adequacy Requirements, Chapter 4, section 4.1.7 for the corporate exposure class and Chapter 6 for the securitization framework. Chernenko, Ialenti, and Scharfstein (2026) document that US bank loans to private credit funds’ special purpose subsidiaries typically qualify as securitization exposures carrying the 20 percent floor risk weight under the US Simplified Supervisory Formula Approach, against 100 percent on the underlying middle-market loans. Pandolfo (2025) estimates a 29.2 percent return on equity on bank lending to private credit funds against 7.9 percent on comparable commercial and industrial loans. Under OSFI’s framework, the securitization risk weight is floored at 15 percent (OSFI 2026, Chapter 6). See also Financial Stability Board (2026). against 100 percent on direct loans to the same borrowers, and the same securitization treatment is available under OSFI’s framework, though the weights Canadian banks actually apply in practice are not directly observable given they are allowed by OSFI to use their own risk models to set their credit risk capital requirements. The cushion is only as good as the fund manager’s collateral valuations, and payment-in-kind accrual can erode it without a single missed payment; our stress test shows bank losses jumping from nil to material once that cushion is pierced. Drawdowns on the facilities are correlated across funds and arrive in a stress scenario. And the bank has given up control over underwriting and workout to a manager it does not supervise.
We encourage OSFI to review whether the securitization floor and the recognition of manager-reported collateral values reflect these features, and whether the gap between the two treatments is pulling credit out of the banks’ own loan books and into facilities to funds mainly for capital reasons (Chernenko, Ialenti, and Scharfstein 2026; Pandolfo 2025). The insurer side is similar, but the incentives go the other way around: treating fund units as equity pushes insurers toward direct lending, which is more visible, not less.
4. Build second-order effects into stress testing.
We encourage regulators to extend the framework in Box 3 with the supervisory data that outside analysts lack and run scenarios in which fund drawdowns, warehouse contraction, and valuation lag occur together. Those second-order effects must include the asset price channel. Forced selling and portfolio rebalancing by institutions under stress will move the prices of the assets that other institutions hold. Recent work on demand-system asset pricing offers a framework for tracing those effects through institutional balance sheets (Koijen and Yogo 2019; Gabaix et al. 2025). Building it into supervisory stress tests is beyond the scope of this paper, but it is a natural next step.
5. Require private credit funds to disclose how their loans are valued and how much of their income is actually being received.
The recommendations above concern the institutions that are exposed to private credit funds. The funds themselves fall largely to securities regulators, and the issues described in this paper, namely model-based valuations, interest capitalized rather than paid, and redemption terms that can bring a run forward, are matters of disclosure as much as of prudential regulation. For funds offered to Canadian investors, we encourage the Canadian Securities Administrators to require periodic disclosure of: the fund’s valuation policy and the share of the portfolio reviewed by an independent valuation agent; payment-in-kind and accrued-but-unpaid interest as a share of investment income and of assets; the share of loans on non-accrual or amended and extended in the period; fund-level leverage; and the redemption limits in place and whether they were applied. Public business development companies in the United States already report most of these items.
7. Conclusion
Based on our analysis, the Canadian banks’ direct exposure to the global private credit fund industry does not look like a current source of systemic risk. Even the most extreme outcome we model, a 1-in-1,000 event with full loss pass-through, would cost the big banks less than 6 percent of their Common Equity Tier 1 capital (roughly 80 basis points of their CET1 ratios) in our base case, and around 11 percent (roughly 150 basis points) even if every dollar of their fund lending were related to private credit rather than private equity. The more plausible route for stress to reach Canadian businesses is a withdrawal of bank credit from the funds and non-bank lenders that depend on it, not bank losses.
But the system is reorganizing itself around the edges of the regulatory perimeter. As global trends permeate Canada, it would be reasonable to expect that private credit investment funds managed by large asset managers that are either independent or linked to today’s financial institutions are likely to play a growing role in supplying financing to Canadian businesses. None of this can be monitored properly with today’s definitions and data. The reforms we propose are modest ones, including providing consistent definitions, comparable disclosure, regular official measurement, more rigorous stress testing, and disclosure by the funds themselves. Better to do that now, in relatively calm conditions, than to discover in a stress event that we have to fly blindly when time is of the essence because the numbers we need are not readily available.
References
Achrekar, Rita. 2025. “The Rise of Private Credit: Fueling Growth or Brewing Risk?” Global Risk Institute.
Bank for International Settlements. 2025. The Transformation of the Life Insurance Industry: Systemic Risks and Policy Challenges. BIS Papers 161. Basel: Bank for International Settlements. October.
Bank of Canada. 2025. Financial Stability Report 2025. Ottawa: Bank of Canada. May.
_____________. 2026. Financial Stability Report 2026. Ottawa: Bank of Canada. May.
Basel Committee on Banking Supervision. 2005. An Explanatory Note on the Basel II IRB Risk Weight Functions. Basel: Bank for International Settlements. July.
______________. 2024. Guidelines for Counterparty Credit Risk Management. Basel: Bank for International Settlements. December.
Bédard-Pagé, Guillaume, et al. 2021. “COVID-19 Crisis: Liquidity Management at Canada’s Largest Public Pension Funds.” Bank of Canada Staff Analytical Note 2021-11. Ottawa: Bank of Canada. May.
Berrospide, Jose M., Fang Cai, Siddhartha Lewis-Hayre, and Filip Zikes. 2025. “Bank Lending to Private Credit: Size, Characteristics, and Financial Stability Implications.” FEDS Notes. Washington, DC: Board of Governors of the Federal Reserve System. May 23.
Chan, Wendy, Cameron MacDonald, and Geneviève Vallée. 2026. “Private Credit in Canada.” Sparks at Bank Article 2026-18. Ottawa: Bank of Canada. August.
Chernenko, Sergey, Robert Ialenti, and David S. Scharfstein. 2026. “Bank Capital and the Growth of Private Credit.” SSRN Working Paper. March.
Deane, Stephen, and Ken Robinson. 2025. “Continuation Funds: Ethics in Private Markets, Part I.” CFA Institute Research and Policy Centre. September.
Dimler, Michael, and Krutang Desai. 2026. “Private Credit Rating Action Chartbook: Will the March Default Pause Last?” Commentary. Morningstar DBRS. April.
Dreff, Nadja, and Marcos Alvarez. 2026. “Canadian Life Insurers’ Private Credit Portfolios: More Traditional Than Feared, Less Comparable Than Needed.” Morningstar DBRS. July 8.
Financial Stability Board. 2017. Policy Recommendations to Address Structural Vulnerabilities from Asset Management Activities. Basel: Financial Stability Board. January 12.
______________. 2023. Revised Policy Recommendations to Address Structural Vulnerabilities from Liquidity Mismatch in Open-Ended Funds. Basel: Financial Stability Board. December 20.
______________. 2026. Report on Vulnerabilities in Private Credit. Basel: Financial Stability Board. May.
Gabaix, Xavier, Ralph S.J. Koijen, Robert Richmond, and Motohiro Yogo. 2025. “Asset Embeddings.” NBER Working Paper 33651. Cambridge, MA: National Bureau of Economic Research. April.
Gao, Candice, and Michael Dimler. 2026. “Private Credit Default Momentum Increasingly Tied to Distressed Debt Exchanges.” Morningstar DBRS. March 19.
Gonzales, Freschia. 2026. “Canadian Pension Giants Double Down on the American Dream.” Benefits and Pensions Monitor. February 18.
International Monetary Fund. 2024. “The Rise and Risks of Private Credit.” In Global Financial Stability Report, Chapter 2. Washington, DC: International Monetary Fund. April.
Jang, Young Soo, Dasol Kim, Amir Sufi, and Xiangyu Chen. 2025. “The Lending Technology of Direct Lenders in Private Credit.” NBER Working Paper 34500. Cambridge, MA: National Bureau of Economic Research.
Koijen, Ralph S.J., and Motohiro Yogo. 2019. “A Demand System Approach to Asset Pricing.” Journal of Political Economy 127(4): 1475–1515.
Levin, John, and Antoine Malfroy-Camine. 2025. “Bank Lending to Private Equity and Private Credit Funds: Insights from Regulatory Data.” Supervisory Research and Analysis Note 25-02. Boston: Federal Reserve Bank of Boston. May.
Li, Xuelin, Sangmin Oh, and Giacomo Ricciardi. 2026. “Rating Without Market Discipline.” Columbia Business School Research Paper. May 31.
The Logic. 2026. “Canadian Banks Are Ramping Up Lending to Non-Bank Financial Firms.” March 16.
Macklem, Tiff. 2026. “New Players, Old Risks: Financial Stability in a Changing Landscape.” Remarks to the Global Risk Institute, Toronto. Ottawa: Bank of Canada. March 4.
Matvos, Gregor, Tomasz Piskorski, and Amit Seru. 2026. “Private Credit, Balance Sheets and Financial Stability.” NBER Working Paper 34991. Cambridge, MA: National Bureau of Economic Research. March, revised August.
Moody’s. 2026. “Managing the Future of Risk for Canadian Public Pensions.” New York: Moody’s. May 13.
Nicoll, Alex. 2026. “Apollo Is Limiting Redemptions in Its Private Credit Fund After Investors Request 11% Withdrawals.” Business Insider. March 23.
OECD. 2025. OECD Economic Surveys: Canada 2025. Paris: OECD Publishing.
Office of the Superintendent of Financial Institutions. 2025. Life Insurance Capital Adequacy Test (LICAT) Guideline. Ottawa: Office of the Superintendent of Financial Institutions.
______________. 2026. Capital Adequacy Requirements (CAR) Guideline. Chapters 4 and 6. Ottawa: Office of the Superintendent of Financial Institutions.
Pandolfo, Jordan. 2025. “Banks and Private Credit: Competitors or Partners?” Federal Reserve Bank of Kansas City Economic Bulletin. August 6.
PGIM. 2026. “From Niche to Mainstream: Continuation Vehicles Redefine Private Markets.” February 26.
Preqin. 2026. Preqin Global Report 2026: Private Equity. London: Preqin.
Statistics Canada. 2026. “Credit Liabilities of Private Non-financial Corporations.” Table 36-10-0640-01.
Su, Eva. 2026. “Private Credit Funds Redemption Restrictions: Market Context and Policy Issues.” Congressional Research Service Insight IN12674. April 2.
Torys LLP. 2026. “More Capital, Less Friction: Rethinking OSFI Rules for Canadian Growth.” By Blair W. Keefe and Eli Monas. Toronto: Torys LLP. April 22.
Zelmer, Mark. 2025. Home Advantage: Helping Financial Institutions Prepare for Financial Distress Amidst Rising Geopolitical Tensions. Commentary 692. Toronto: C.D. Howe Institute. https://cdhowe.org/publication/home-advantage-helping-financial-institutions-prepare-for-financial-distress-amidst-rising-geopolitical-tensions/.