


by William B.P. Robson and Nicholas Dahir
- The budgets municipal governments present around the beginning of their fiscal years and the audited financial statements they publish after year-end are crucial for decision-making and accountability. This report card reviews the financial documents of 39 major Canadian municipalities and assesses whether they equip councillors and the public to understand, evaluate and hold governments accountable for their fiscal decisions. It does not judge whether municipalities tax or spend too much or too little – its grades reflect our judgement about how helpful their financial documents are to people who have such questions.
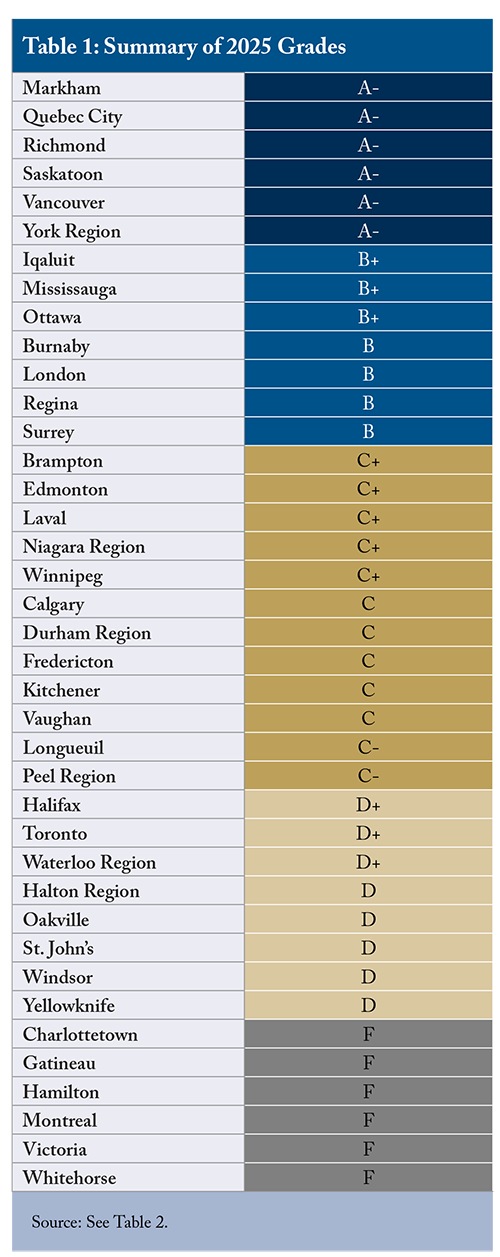
- The grades in our annual fiscal accountability report card for 2025 ranged from A- to F. Standing out with A- grades for clarity, completeness and timeliness were Markham, Quebec City, Richmond, Saskatoon, Vancouver and York Region. Richmond, along with Iqaluit, which earned a B+, stood out for presenting budgets that followed the same public sector accounting standards (PSAS) used in their financial statements. At the bottom were Charlottetown, Gatineau, Hamilton, Montreal, Victoria and Whitehorse. Their Fs reflected multiple problems with missing information, inconsistent accounting, and timeliness.
- Notwithstanding instances of late or missing information, most municipalities’ financial statements earned high scores for clarity and conformity with PSAS. But too many municipal budgets provided few PSAS-consistent numbers, and some presented none. Budgets were often fragmented, separating “operating” and “capital” outlays and tax- versus rate-supported activities. Too many late budgets meant councillors approved outlays after the fiscal year had already started.
- Poor financial reporting impedes democratic oversight and discourages engagement. Cities provide essential services and cost taxpayers significant amounts. Timelier presentations and budgets that match financial statements would raise their fiscal accountability to a more appropriate standard.
Fiscal Transparency and Accountability in Municipalities:
The Challenge
Canada’s cities provide infrastructure and services that affect the quality of Canadians’ lives and influence where people and businesses live, work and invest. Providing those services costs money, and the taxes and fees cities charge also affect quality of life and decisions about where to work and invest. Municipal governments should present financial information that is transparent, useful and timely.
This report card covers the 2025 budgets and 2024 financial statements of 39 major Canadian municipalities. For the first time, it includes Charlottetown, Fredericton, Iqaluit, St. John’s, Victoria, Whitehorse and Yellowknife, which expands its coverage to all provincial and territorial capitals. Unfortunately, it shows that the financial information provided by many cities falls short. The grades we awarded to 39 of Canada’s major municipalities are summarized in Table 1.
The problem lies least with their year-end financial statements. Although too many cities issue them late, these statements tend to be clear and informative, follow public sector accounting standards (PSAS) and get clean opinions from external auditors. Municipal budgets, however, typically present a fragmented view of operations and are not comparable with past results or with the financial statements the same municipality issues after year-end (see online Appendix 1 for details on how budgets typically depart from PSAS, including the use of cash accounting for capital projects that overemphasizes their up-front costs). This presentation makes simple questions, such as how much spending is forecast to rise or what the bottom line will be, hard to answer. Municipal budgets are also often late, asking councillors to ratify spending already committed instead of approving it in advance.
Better and timelier budgets and financial statements would elevate the financial oversight and management of Canada’s municipalities to a level more appropriate to their importance in Canadians’ lives.
Measuring Fiscal Accountability
Financial documents such as budgets and financial statements are central to accountability and decision-making. People need to know how governments plan to raise and spend money, and whether they did what they said they would do. Budgets set out fiscal plans for the coming year, while audited financial statements report results for the year just ended. Together, they help legislators and citizens make better decisions and monitor results.
At a minimum, a government’s financial documents should let a motivated and numerate, but non-expert, reader easily find consolidated revenues and expenses and the resulting surplus or deficit, and relate those numbers to changes in a government’s accumulated operating surplus or deficit – a key indicator of its capacity to deliver future services.11 The most comprehensive measure of a government’s capacity to deliver services is its accumulated surplus or deficit, which is equal to its accumulated operating surplus or deficit, plus accumulated remeasurement gains and losses. We focus on the accumulated operating surplus or deficit in this report card as we explain below.
Rating Budgets and Annual Reports
The concerned legislator or citizen will want to know what revenues and expenses the municipality plans to receive and incur in the coming year, or actually received and incurred in the year just past. These numbers help readers compare plans with past results, assess whether actual revenues and expenses matched projections, and identify and potentially investigate variances.
To answer these questions, non-expert users need budgets and financial statements that are timely, use PSAS-consistent accounting, present consolidated numbers early and clearly, and facilitate comparisons between intentions and results.
These essentials are the basis for the criteria we use to grade municipal budgets and financial statements (links to source documents are in online Appendix 2). We are not judging whether municipalities tax and spend too much, or too little or in the wrong ways. We are asking whether their financial documents equip councillors and the public to make such judgments. We score criteria related to timeliness, usefulness and clarity, and combine them into an overall grade weighted by their importance to fiscal transparency and accountability.22 The C.D. Howe Institute’s annual report card on the financial documents of the federal, provincial and territorial governments also reflects these important themes in the framework of the Public Sector Accounting Board (PSAB 2022). These report cards complement international measures of fiscal transparency such as the Organisation for Economic Co-operation and Development’s Best Practices for Budget Transparency (OECD 2002) and the Open Budget Survey (International Budget Partnership 2024).
Timeliness
Councillors should review and vote on their municipality’s budget well before the fiscal year begins.33 The fiscal years of municipalities in Nova Scotia and Prince Edward Island run from April 1 to March 31. The fiscal years of other Canadian municipalities coincide with calendar years. Spending without authorization from elected representatives violates a core principle of democracy. Public engagement after taxes are already being collected and money spent is meaningless. Passing a budget formally provides critical information that taxpayers, municipal departments and municipally funded organizations should have before the year starts. Timely year-end financial statements also help councillors and others react to deviations from plans and gather information needed to prepare the following year’s budget.
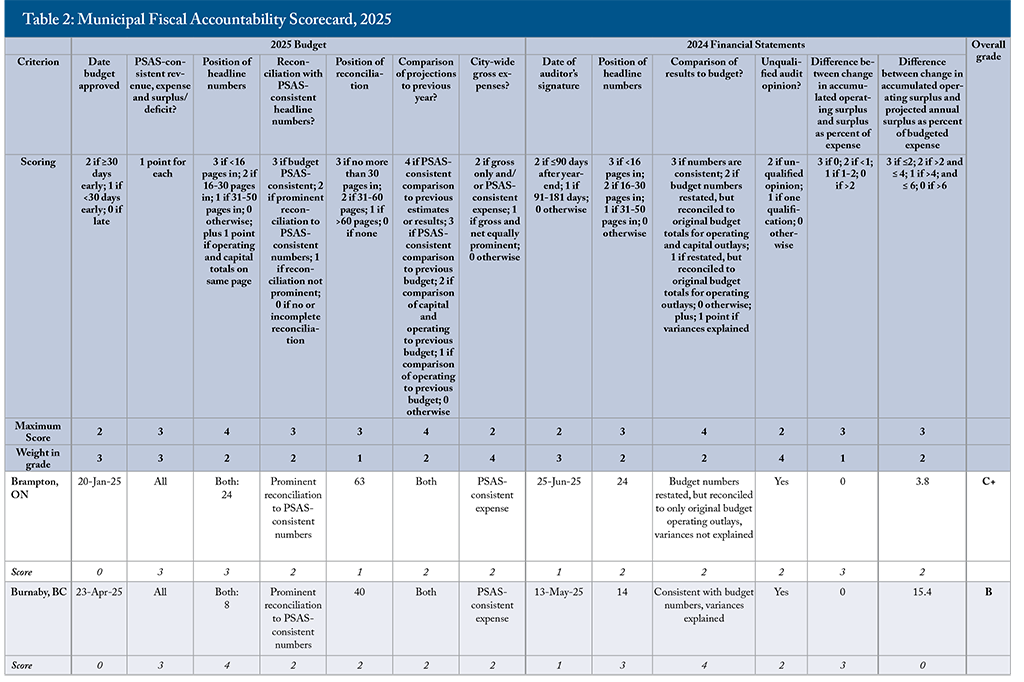
We awarded a top score of 2 points if a municipality approved its budget 30 days or more before its fiscal year started, 1 point if approval occurred fewer than 30 days before the year started and 0 if approval occurred after the year started.
For financial statements, we used the date of the auditor’s signature. This measure is not ideal since time can pass between signing and release, but the signature date is easier to verify than the publication date of financial statements or annual reports. We awarded 2 points to municipalities with an auditor’s signature no more than 90 days after year-end, 1 point to municipalities with a signature more than 90 days but no more than 181 days after year-end and 0 to municipalities with a signature more than 181 days after year-end.
Placement of Key Numbers
Key numbers should be easy to find and identify. If they are up front in a document, a user is less likely to give up or find wrong numbers before finding the right ones. We looked through the most prominently displayed budget documents on each municipality’s website, stopping at the first aggregate numbers identified as relevant totals. When similar-looking documents appeared equally prominently – for example, with similar fonts and colours on clickable links – we chose the first one in the list or menu.
We referenced the physical budget books and financial statements or annual reports, or their electronic PDF equivalents, for several reasons. Web pages can change without notice or date stamps, making verification hard. Links between web pages also create navigation challenges for users that do not lend themselves to quantification in a scoring system. And physical or PDF documents make page numbering straightforward. We began counting at the first physical or electronic page, omitting tables of contents and lists of tables and figures since they help readers navigate the document. We counted pages rather than using a measure such as a percentage that takes into account the overall length of the document because readers typically begin at the start of a document, and longer documents are more likely to discourage them.
For budgets, we awarded 3 points to municipalities that displayed consolidated revenues and expenses, and the surplus or deficit – or operating and capital totals for municipalities with separate operating and capital budgets – within the first 15 pages of the document. We awarded 2 points if those numbers appeared 16 to 30 pages in, 1 point if they appeared 31 to 50 pages in and 0 if they appeared more than 50 pages in or if the municipality did not display both operating and capital totals. We awarded a further point to municipalities that displayed operating and capital totals on the same page. Municipalities that presented PSAS-based consolidated totals automatically earned that point.
We also looked at the placement of any reconciliation between operating and capital totals and PSAS-consistent numbers. We awarded 3 points if the reconciliation appeared within the first 30 pages of the budget document, 2 points if it appeared 31 to 60 pages in, 1 point if it appeared after 60 pages and 0 if no reconciliation appeared.
For annual reports and financial statements, we used the same placement scores as for budgets, counting the pages to the first table that displayed consolidated revenue, expenses and surplus or deficit. If a municipality displayed similar information in multiple places – a comparison of budget projections with past results, for example, or a reconciliation between non-PSAS and PSAS-consistent numbers – we evaluated the version that appeared first.
Reliability and Transparency of Numbers
Financial statements that receive qualified audit opinions, by definition, do not conform to PSAS. We awarded 2 points to municipalities with unqualified audit opinions and 1 point to municipalities with one qualification. We awarded 0 to any municipality with more than one qualification or that explicitly did not conform to PSAS. We weighted this score relatively heavily in our overall grades.
Financial statements should show and explain the differences between results and budget plans. We awarded 3 points to municipalities that showed PSAS-consistent budget projections alongside results when the revenue, expense and bottom-line numbers in those budget projections matched those in the budget itself. We awarded 2 points when budget projections did not match the budget itself, but the statements reconciled the restated projections either to PSAS-consistent projections in the original budget or to the original budget’s operating and capital totals. We awarded 1 point to municipalities that restated budget projections but provided a reconciliation to the original budget numbers only for operating outlays. We awarded 0 to municipalities that either did not show budget projections beside results or presented different budget numbers without reconciliation. We awarded an additional point when statements explained variations between budget projections and the results.
Ideally, municipalities’ budgets would match their financial statements line-by-line, as many senior governments’ budgets do. Because PSAS-consistent numbers are so rare in municipal budgets, we do not require such matching in our scoring system. If we did, Iqaluit, Ottawa, Richmond and York Region would get higher marks for line-by-line consistency, while other cities would get lower marks. We hope that improvements in this area will let us take it into account in future editions of this report card.
We also examined whether a municipality’s budget displayed gross expenditures – both tax- and rate-supported – giving users a better view of operating spending’s claim on community resources. We awarded 2 points to municipalities that displayed gross expenditures as their main headline number, 1 to municipalities that displayed net and gross expenditures equally prominently and 0 to municipalities that displayed only net expenditures, failed to consolidate rate- and tax-supported expenditures or omitted municipal operations consolidated in their financial statements.44 Quebec amalgamated several municipalities, including Gatineau, Laval, Longueuil, Montreal and Quebec City, in the early 2000s. Municipalities that are part of a larger agglomeration typically present numbers for themselves and the larger entity. We awarded 2 to municipalities that showed both with equal prominence, since both numbers help users understand the scope and cost of municipal operations. Municipalities that displayed PSAS-consistent consolidated expenses got the top mark of 2 on this criterion.
We also looked at the prominence of PSAS-consistent numbers in budgets. We awarded 3 points to the two municipalities, Richmond and Iqaluit, that presented PSAS-consistent budgets. We awarded 2 to municipalities that did not show PSAS-consistent numbers as their primary exhibits but provided prominent reconciliations to PSAS-consistent numbers – meaning the reconciliation appeared in the table of contents, main budget tables or its own section rather than in an appendix or supplemental section. We awarded 1 to municipalities that provided a reconciliation but did not show it prominently. We awarded 0 to municipalities that showed no PSAS-consistent numbers or only incomplete numbers that did not help users anticipate what a full reconciliation would show.
Comparability of Numbers
Budget plans need context. Showing projections for the coming year alongside expected results for the current year – the year about to end – and audited results for at least one prior year lets users see whether their municipality expects revenue and expenses to rise or fall, and by how much. Canada’s senior governments do that. But most municipalities compared their budgets only to the previous year’s budget. That approach would strike most people managing businesses, not-for-profits and households as minimally useful, but it is so prevalent that we accommodated it, grudgingly, in our scoring system. We awarded 3 points to municipalities that compared the current year’s budget with the previous year’s using PSAS-consistent numbers. We awarded 2 to municipalities that showed comparisons to the previous year’s budget for operating and capital spending, 1 to municipalities that compared only operating spending and 0 to municipalities that showed no or incomplete comparisons. One municipality, Iqaluit, presented a PSAS-consistent budget alongside PSAS-consistent estimates for the prior year and previous audited results. We awarded Iqaluit 4 points.
Gaps Between the Annual and Accumulated Operating Surpluses
Financial results are easier to understand if the difference between revenues and expenses – the surplus or deficit – relates straightforwardly to the change in the government’s accumulated operating surplus or deficit over the fiscal year. (Since no municipalities ran deficits or have accumulated operating deficits, we refer to surpluses only in this discussion).
The accumulated operating surplus is a less comprehensive measure of a government’s capacity to deliver services than its accumulated surplus, which equals its accumulated operating surplus plus accumulated remeasurement gains and losses. We focus on the accumulated operating surplus because a motivated but non-expert user of municipal financial statements could likely find or calculate changes in accumulated operating surpluses but would be flummoxed by differences in how different municipalities presented their accumulated surpluses. We hope future presentations will let us focus on accumulated surpluses.
When the link between an annual surplus and the change in accumulated operating surplus is clear, legislators can see how fiscal plans and results affect a government’s capacity to deliver services. Adjustments between the two obscure that link. Gaps between what decision-makers can influence and changes in service capacity reduce accountability.
Our scoring system scrutinizes those gaps using two criteria. The first criterion focuses on the financial statements, and measures the absolute difference between the annual surplus and the change in accumulated operating surplus. We awarded a score of 3 to governments with changes in their accumulated operating surpluses equal to their annual surpluses in their financial statements, 2 to governments with gaps between the changes in their accumulated operating surpluses and their annual surpluses with absolute values less than 1 percent of their expenses, 1 to governments with gaps between 1 percent and 2 percent of expenses and 0 to governments with gaps greater than 2 percent. Since PSAS mandate some of these adjustments, the weight of this criterion in our overall grade is small. But large gaps still undermine transparency enough to justify its inclusion.
The second criterion looks at both plans and results, and measures the difference, also in absolute value, between the annual surplus in the budget projections and the change in accumulated operating surplus reported after year-end in the financial statements. These gaps can occur for many reasons, including economic fluctuations and natural disasters, but whatever the causes and justifications, they hurt legislators’ ability to oversee public finances and governments’ service capacity.55 Ideally, this comparison would use the numbers in the budgets themselves. Since most municipalities did not present PSAS-consistent budgets, we resorted to the restated PSAS-consistent budget numbers that appeared in their financial statements. This lenient approach overstates the usefulness of the budgets themselves for users seeking to anticipate changes in accumulated surpluses implied by the budget projections, and we look forward to applying a more stringent standard in the future. We awarded a score of 3 to governments with gaps between projected annual surpluses and actual changes in accumulated operating surpluses that were less than or equal to 2 percent of budgeted expenses, 2 to governments with gaps greater than 2 percent but no more than 4 percent of budgeted expenses, 1 to governments with gaps greater than 4 percent but no more than 6 percent and 0 to governments with gaps greater than 6 percent.
Arriving at Letter Grades
To produce an overall grade, we standardized each criterion score on a scale from 0 to 1, weighted the scores based on our judgment of the importance of each criterion to transparency and accountability and summed the weighted scores to produce percentages. We then converted those percentages into letter grades on a standard scale: A+ for 90 percent or above; A for 85-89 percent; A- for 80-84 percent; B+ for 77-79 percent; B for 73-76 percent; B- for 70-72 percent; C+ for 67-69 percent; C for 63-66 percent; C- for 60-62 percent; D+ for 57-59 percent; D for 53-56 percent; D- for 50-52 percent; and F for less than 50 percent.
The 2025 Report Card on Canada’s Major Municipalities
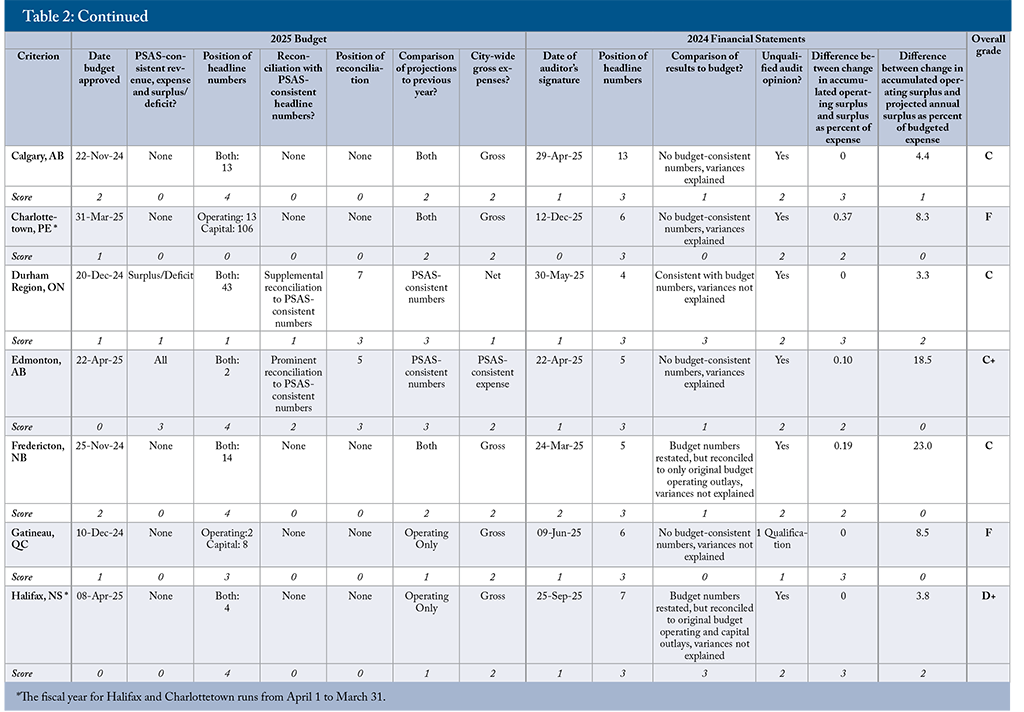
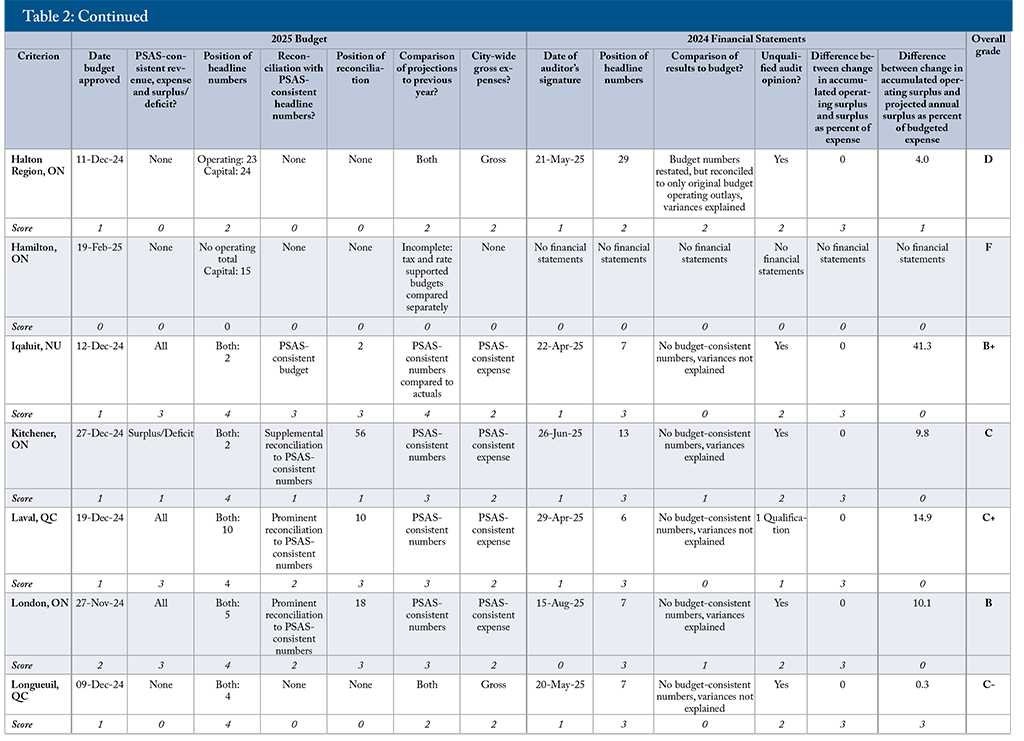
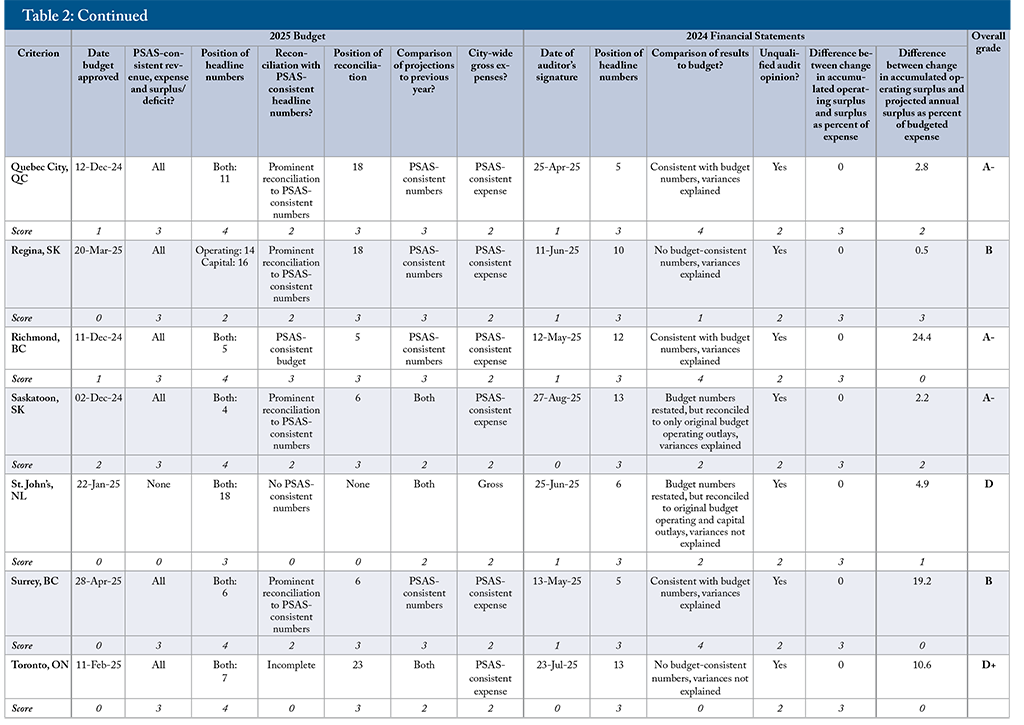
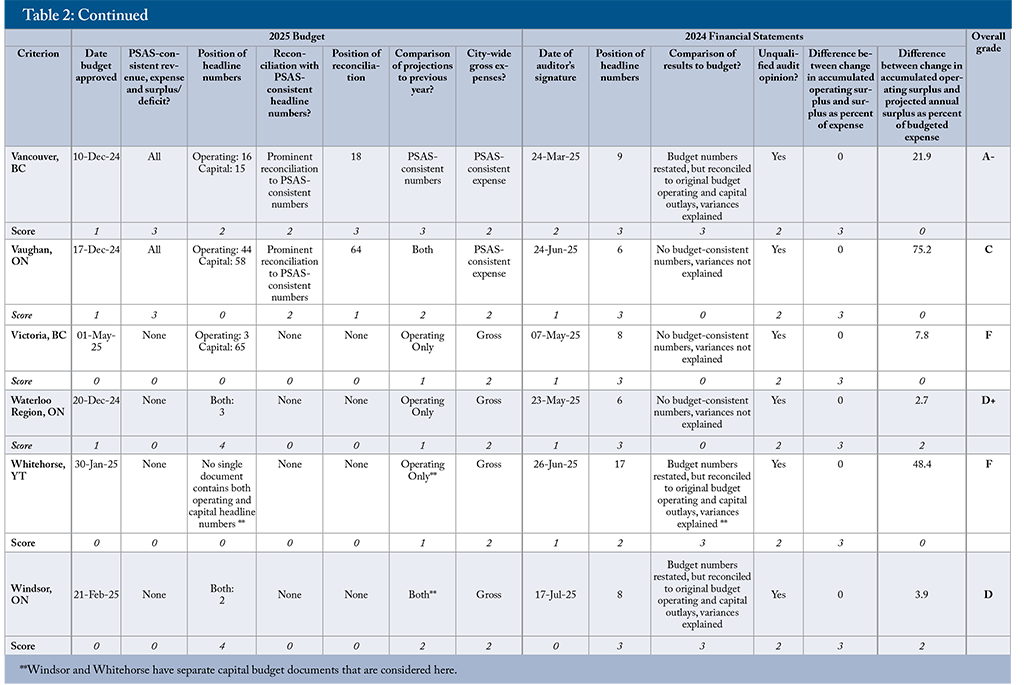
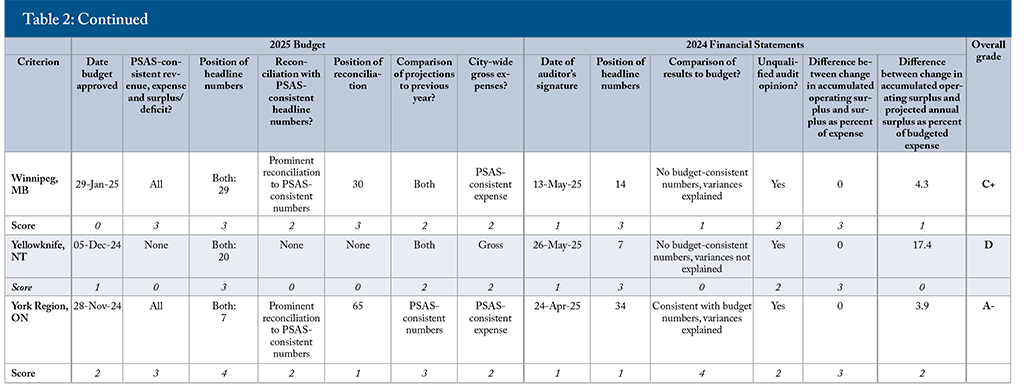
Our 2025 report card uses the scores on these criteria (seven for 2025 budgets and six for 2024 annual reports or financial statements) to assess the fiscal accountability of Canada’s 26 most populous municipalities, the seven provincial and territorial capitals not in that group and the six most populous regional municipalities in Ontario. Table 2 presents our assessments and resulting letter grades for each municipality.
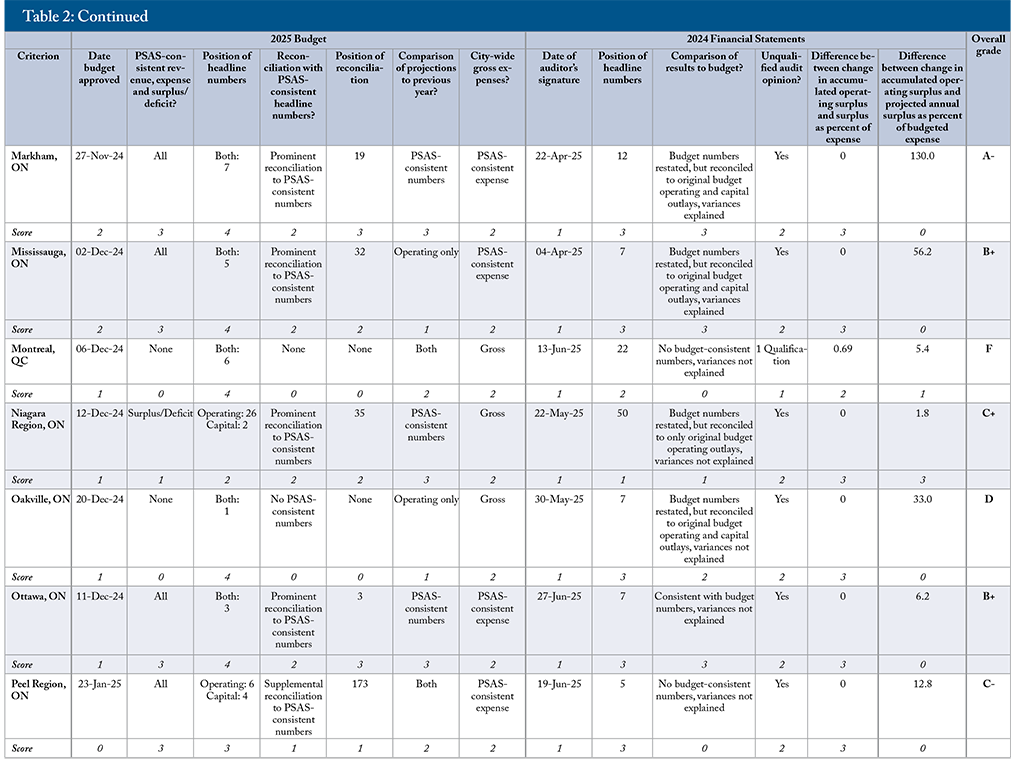
Best and Worst for Financial Reporting
The grades range from A- to F. Too many municipalities fell below the B range, mainly because their budgets were late and/or failed to show PSAS-consistent revenues, expenses and surpluses.
At the top of the class, with A- grades, were Markham, Quebec City, Richmond, Saskatoon, Vancouver and York Region. All had timely budgets. Their key numbers were up front and they prominently displayed PSAS-consistent numbers in their budgets. Richmond stood out as one of only two municipalities in our survey to produce a PSAS-consistent budget. Vancouver’s financial statements were signed within 90 days of year-end. Quebec City, Richmond and York Region compared results to budget projections consistent with their original budget documents.
In the B range were Iqaluit, Mississauga and Ottawa (B+), and Burnaby, London, Regina and Surrey (B). These municipalities typically displayed headline numbers early in their budgets and financial statements. They also prominently reconciled headline budget numbers with PSAS-consistent revenue, expense and surplus figures early in their documents and had no gaps between annual surpluses and changes in accumulated operating surpluses.
Iqaluit, like Richmond, produced a PSAS-consistent budget and deserves credit for showing PSAS-consistent projections alongside prior-year projections and audited results for the year before that. Mississauga approved its budget more than 30 days before the start of the fiscal year, but compared only operating budgets and had a large gap between projected and actual changes in accumulated operating surplus. Ottawa compared results to budget projections consistent with its original budget presentation, but also had a large gap between its projected and actual change in accumulated operating surplus.
Burnaby, Regina and Surrey displayed PSAS-consistent numbers early in their documents, but late budget approvals hurt their grades. London approved its budget well before the start of the fiscal year, but late financial statements and inconsistent budget comparisons lowered its grade.
Cities in the C group – Brampton, Calgary, Durham Region, Edmonton, Fredericton, Kitchener, Laval, Longueuil, Niagara Region, Peel Region, Vaughan and Winnipeg – typically approved budgets after the start of the fiscal year and either did not provide PSAS-consistent revenue, expense and surplus numbers in their budgets or buried them many pages in. Most did not compare budgets to previous years using PSAS-consistent numbers, and most restated budget projections in their financial statements.
Brampton’s budget presented the key numbers up front, but was late. Calgary’s budget was timely, but its financial statements restated budget projections without reconciliation. Durham Region’s financial statements were consistent with its budget projections, but it displayed gross and net city-wide expenses with equal prominence. Edmonton displayed key numbers early in its documents, but a late budget and a gap between its annual surplus and the change in its accumulated operating surplus hurt its grade. Fredericton was one of only two cities to have its auditor sign off on its financial statements within 90 days of year-end, but it had no PSAS-consistent numbers in its budget.
Laval had timely documents and prominent PSAS reconciliation in its budget, but received a qualified opinion from its auditor. Kitchener presented its PSAS-consistent surplus projection only late in the document. Longueil’s budget did not contain PSAS consistent projections. Niagara Region’s budget did not present PSAS consistent revenue or expenses. Peel Region’s budget was not timely and its reconciliation to PSAS-consistent projections was buried in a supplemental presentation. Vaughan approved its budget on time, but its key numbers were buried. Winnipeg’s budget was not timely, and its financial statements restated budget projections and revealed a large gap between its projected and actual changes in accumulated operating surplus.
Halifax, Halton Region, Oakville, St. John’s, Toronto, Waterloo Region, Windsor and Yellowknife achieved only D-range grades.
Halifax, St. John’s, Toronto and Windsor approved their budgets after the start of the fiscal year. They either did not display PSAS reconciliations in their budgets or, in Toronto’s case, showed an incomplete PSAS reconciliation that included only adjustments that hurt the bottom line while omitting those that helped it. Toronto’s financial statements were not timely.
Halton, Oakville, Waterloo Region and Yellowknife’s budgets showed no PSAS-consistent numbers. All restated the budget projections in their financial statements. Their financial statements did not explain variances between projections and results, and had large gaps between projected and actual changes in accumulated operating surpluses.
Charlottetown, Gatineau, Hamilton, Montreal, Victoria and Whitehorse were at the bottom of the group with failing grades of F.
All lacked PSAS-consistent numbers in their budgets. Montreal and Gatineau received qualified audit opinions. Hamilton’s budget did not present city-wide expenses or include a PSAS reconciliation. Its 2024 financial statements were not available at the time of publication – indeed, neither were its 2023 financial statements.66 We understand that a cyber attack compromised Hamilton’s ability to produce its financial statements. While we acknowledge that a cyber attack can be crippling, all organizations obliged to produce financial statements must produce them, using backup systems and workarounds when needed. The painful fact is that Hamilton’s council and ratepayers do not have crucial documents needed for fiscal accountability. Whitehorse’s budget contained no PSAS-consistent numbers and did not provide comprehensive operating and capital spending totals, instead separating general and utility totals across different operating and capital budget documents.
Victoria’s budget contained no PSAS-consistent numbers and presented key numbers separately, with capital outlays buried dozens of pages into the document. Charlottetown’s budget was timely, but its financial statements were not. Its budget contained no PSAS reconciliation, and its financial statements revealed significant gaps between its annual surplus and the change in its accumulated operating surplus, and between its projected surplus and the change in its accumulated operating surplus.
Weights in grading inevitably involve judgments on which reasonable people can differ. To test the sensitivity of the 2025 grades to the weights we chose, we compared them with results using equal weights for each criterion. That approach would produce an average absolute change across the 39 municipalities of one grade step – for example, from B to B-. The correlation between the rankings using weighted and unweighted criteria is 97 percent, while the correlation between the numerical grades is 98 percent.
Changes in Grading and Grades
Notwithstanding the disappointments in the scorecard results, municipal fiscal transparency has improved since the C.D. Howe Institute started publishing report cards 15 years ago (Dachis and Robson 2011).77 See online Appendix 3 for a full list of past report cards. Expanding coverage complicates comparisons over time – this is the first year we included the less populous provincial and territorial capitals – but more municipalities are presenting PSAS-consistent numbers in their budgets. Over the past five years, more than half have done so. Partly because of these improvements, we have adjusted our scoring system.
Following a recent PSAS change, we stopped focusing on below-the-line adjustments and looked instead at gaps between annual surpluses and changes in accumulated operating surpluses. This year, we raised the weight on the difference between surpluses projected in budgets and the changes in accumulated operating surpluses reported in financial statements, because large gaps reduce councillors’ ability to understand how budget decisions affect future service capacity.
Our current scoring system for PSAS-consistent budget numbers is very lenient, reflecting the generally low standard of municipal budgets in this area. This year’s report card featured a first: Iqaluit showed PSAS-consistent projections alongside PSAS-consistent numbers for prior years in its budget. We expect to adjust our scoring on this criterion in the future to more closely align with our scorecard of Canada’s senior governments, and hope more cities will join Iqaluit with top scores for PSAS-consistent budgets.
Table 3 compares each municipality’s 2025 grade with its previous grades, showing both the grade each municipality earned in the 2024 report card and the grade it would have received in 2024 if we had used the 2025 criteria and weights that year.
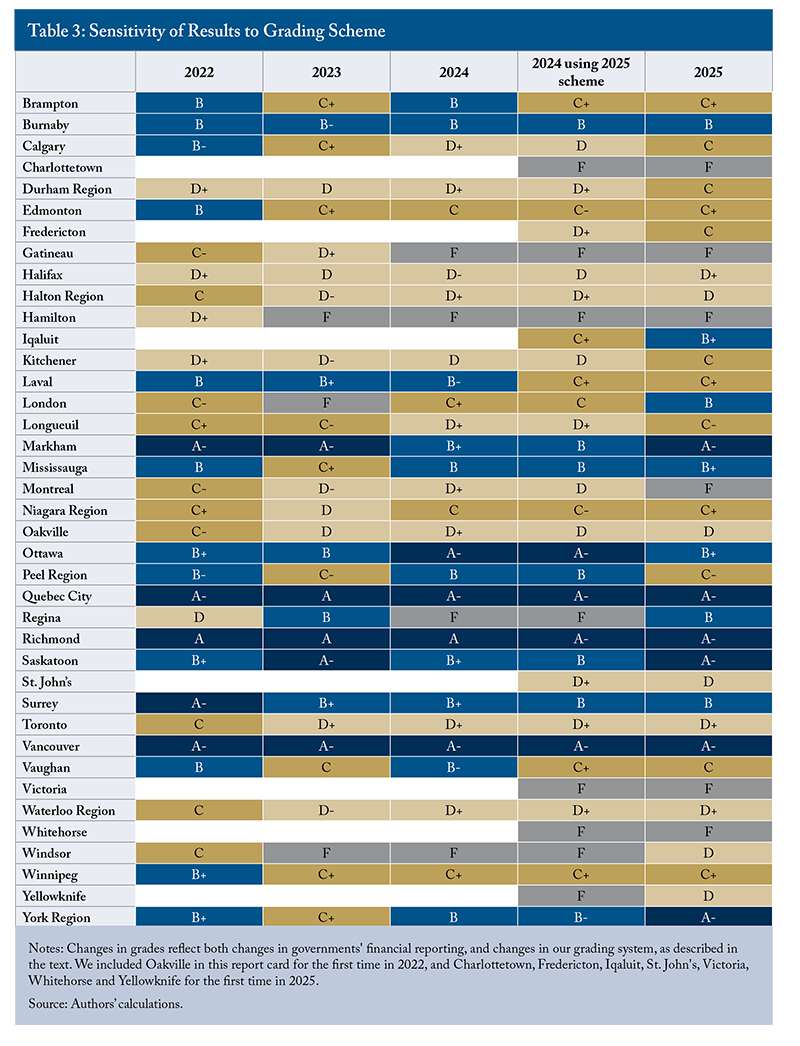
Comparing the 2025 results to the 2024 grades each municipality would have received using the 2025 system reveals some improvements in the timeliness and quality of municipal financial documents. Timelier releases of budgets helped some scores. York Region joined the top of the 2025 class by approving its budget before the start of the fiscal year. Earlier budgets also raised London’s grade to a B, let Yellowknife avoid a failing grade, and contributed to Iqaluit’s B+ grade.
More PSAS-consistent numbers also helped: Kitchener moved out of the D-range by including PSAS numbers in its budget. Regina jumped from an F to a B by including prominent PSAS-consistent numbers in its budget. A smaller gap between Saskatoon’s projected surplus and actual change in accumulated operating surplus moved it to the A-range. Calgary improved its grade by displaying operating and capital numbers on the same page in its budget and presenting results earlier in its financial statements.
We also see declines. Later budget approvals commonly hurt grades. Other factors included qualified audit opinions and large gaps between projected and actual changes in accumulated operating surpluses.
Happily, some strong performers maintained their place at the top of the class. Quebec City, Richmond and Vancouver stand out for consistently top-level results, and Markham, Ottawa and Saskatoon also achieve results other municipalities should emulate.
Why Does Municipal Fiscal Transparency Matter?
Timely, reliable and transparent financial reports alone cannot ensure that municipal governments will serve their citizens’ interests. However, they are an essential foundation for citizens and legislators to understand and act on problems the numbers may reveal.
Confusing Budgets Undermine Engagement
When readers cannot compare intentions with results, citizens, councillors, and the news media pay less attention to municipal finances. Why would citizens read reports, make representations to their councillors or attend public meetings if they think the numbers are confusing or misleading? Why would councillors struggle to understand a budget that experience suggests does not help them predict results? What journalist wants to start a budget story with an eye-glazing explanation of inconsistent accounting?
Consider what happens when a non-expert reader reviews a municipality’s operating and capital budgets and does what a motivated but naïve person might do to calculate spending: add the operating and capital totals together. Table 4 compares the numbers this approach would have produced during the 2024 budget round with the expenses that same reader would find reported in each city’s 2024 audited financial statements. Municipalities without PSAS-consistent headline budget expenses appear in regular font. Municipalities with PSAS- consistent expenses appear in italics.
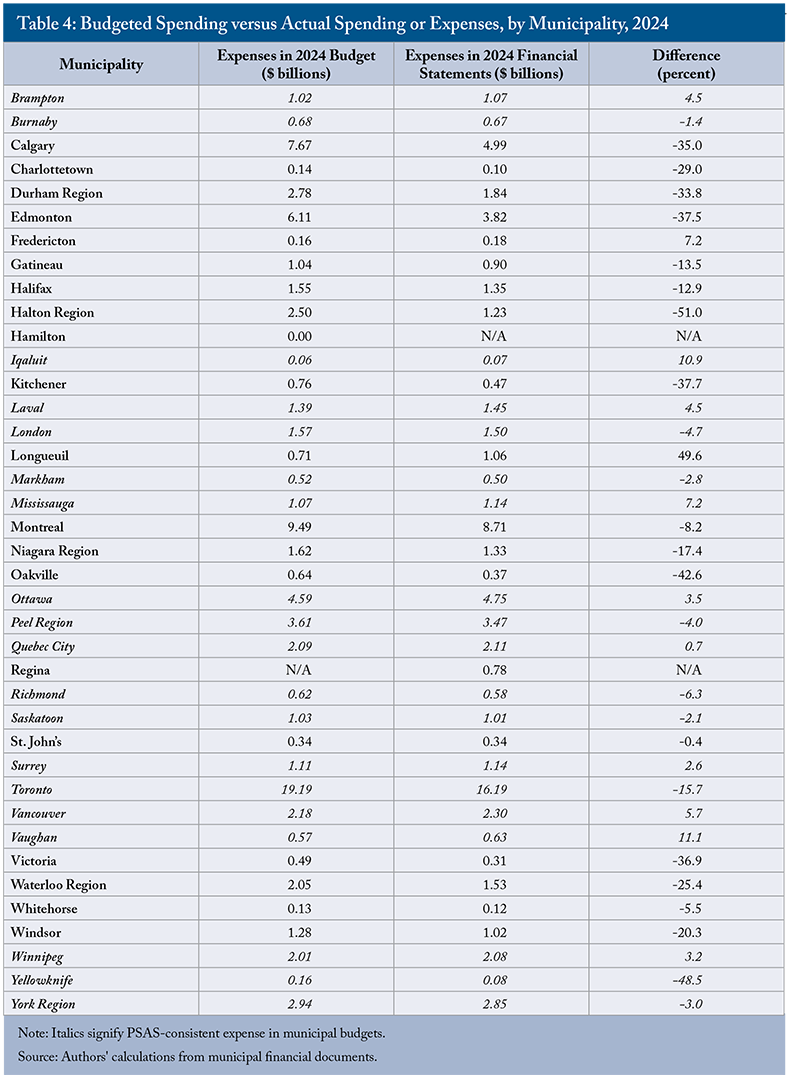
Charlottetown offers a dramatic example. Its 2024 budget appeared to anticipate $141 million in outlays, while its 2023 financial statements showed only $100 million in expenses. An expert who saw actual expenses so far below projections might suspect an accounting discrepancy and start to read the fine print. A non-expert reader, struggling to interpret financial reports and seeing that we assigned the city an F, might instead think the city is incompetent or publishing unreliable numbers. Many other municipalities also had discrepancies between their 2024 budgets and discrepancies so big that someone adding operating and capital budget numbers might think a city’s spending or disclosure was widely off. In nine of the 39 municipalities we examined, the gap between actual and budgeted expenses that a non-expert reader might calculate was more than 30 percent of budgeted expenses.
If the differences in Table 4 always reflected municipalities overspending or underspending relative to their budget commitments, councillors could question staff and explain the results to constituents. But inconsistent accounting explains most of the biggest differences. Municipalities that presented PSAS-consistent budgets or prominent PSAS reconciliations still had variances between projections and results, but the gaps tend to be smaller. For the 18 municipalities that presented PSAS-consistent expenses in their budgets, the average absolute variance was just over 5 percent. For the 19 that did not – excluding Hamilton, for which we have no financial statements, and Regina, which did not show total operating and capital outlays in its 2024 budget – the average was 27 percent.
Financial Presentations Can Affect Decisions
Aside from fostering the impression that city finances are incomprehensible or out of control, discrepancies between non-PSAS-consistent budgets and PSAS-consistent financial statements create specific problems.
Housing affordability concerns highlight one consequence of cash-based capital budgeting: the infrastructure charges some cities levy on developers. In recent years, these charges have raised home prices by as much as $100,000 in the Greater Toronto Area and almost $50,000 in some BC cities (Dachis 2020). New homebuyers pay these charges, but the infrastructure they cover provides benefits over wider areas and longer periods. To the extent that cash budgeting for capital encourages municipalities to levy these charges long before infrastructure delivers its services, it hurts current homebuyers unfairly.
The apparent high price tag on capital projects in cash-basis municipal budgets can discourage capital investments and encourage cities to charge too much up front for the projects they undertake. Focusing on cash transactions also encourages neglect of future obligations, including infrastructure repair and replacement. Some cities, notably in Ontario, have accumulated significant deferred revenue or reserves – money collected in advance for capital projects that will deliver services far into the future (Robson and Dahir 2024).
Cash accounting in municipal budgets persists partly because of institutional inertia, but it also has advocates. Commenting on past iterations of this report card, some municipal officials argued that the better-looking bottom lines in PSAS-consistent budgets might induce councillors to spend and borrow more. But shaping a budget presentation to produce a desired outcome is problematic in principle and, as just noted, can distort decisions in regrettable ways.88 Accounting’s potential to shape policy was clear when Ontario’s 2019 budget anticipated a provincial takeover of the Toronto subway. Although the province can support municipal investments with transfer payments, the budget said: “…provincial ownership of the assets would allow the Province to amortize its capital contributions…This ownership transaction ultimately creates the fiscal space to allow the Province to significantly deepen its commitment to transit and start projects immediately, not sometime in the distant future.” The illusion that the subway was cheaper to build if provincially owned existed only because the City of Toronto did not budget capital on an accrual basis (Robson 2019). While the proposal ultimately failed, it would never have come forward at all if Toronto had budgeted using PSAS.
A related point is the annual panic over balancing the city’s budget compared with the low profile of the sizable annual surpluses cities typically show in their financial statements. The 39 municipalities in this report card had surpluses totalling more than $15 billion in 2024 and accumulated operating surpluses of $280 billion (Table 5).
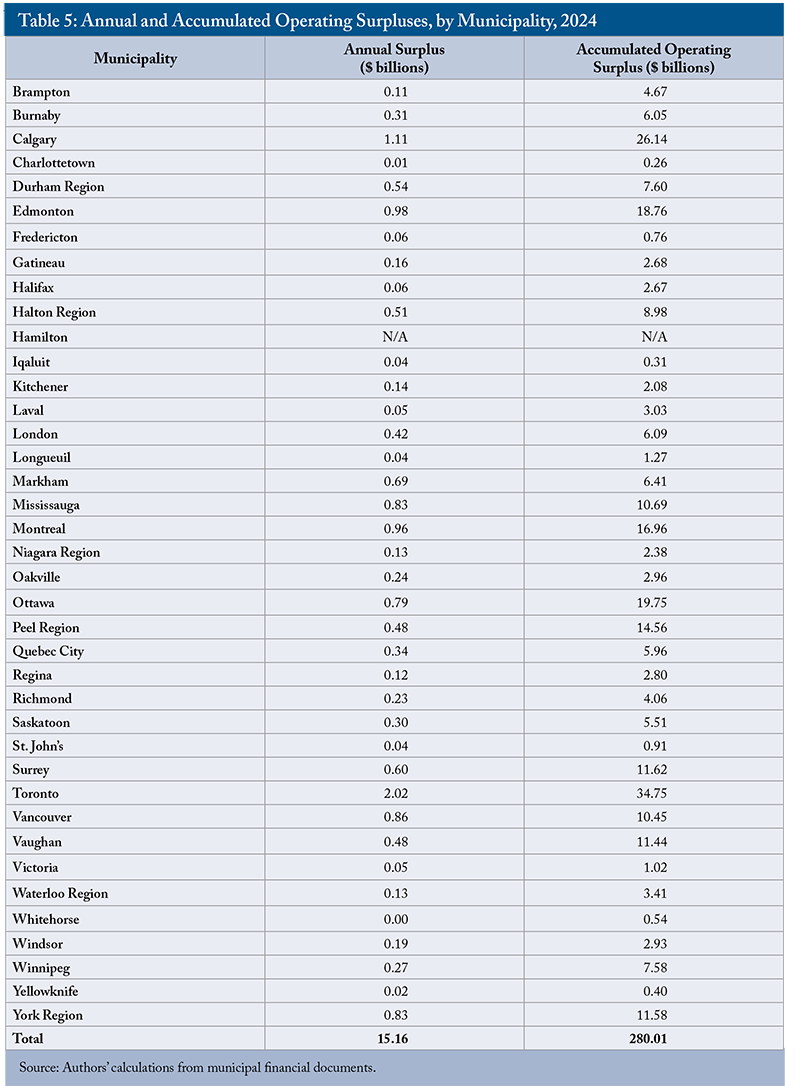
Discussions about potential changes in taxes, services or government transfers would be more fruitful if more people knew that Canada’s cities are in better financial shape than most budget debates suggest.
Improving Fiscal Accountability in Canadian Cities
Canadian senior governments once performed poorly on these measures, but their performance has improved over time (Robson and Dahir 2025). Municipal budgets and financial statements have also improved, but not enough – and not consistently. How can more of Canada’s municipalities do better?
Adopt PSAS-Consistent Accounting in Budgets
Municipalities should prepare budgets using the same PSAS-consistent accounting they use in their financial statements. Budgets should show the same consolidated measures of revenues and expenses – and the more meaningful surpluses – that appear in financial statements, including all entities that the municipal government controls and finances.
Some municipal officials argue that cash budgeting for capital is easier for councillors to understand and that separate presentations of tax- and rate-supported services are more meaningful for citizens.99 York Region’s 2025 budget argues that this approach “gives decision-makers and other readers a clear picture of where cash resources are expected to come from, how much tax levy will be required and how resources will be applied to all activities, including capital and operations, to meet current and future needs” (York Region 2024). Cities can provide that information as supplementary material. But for the main presentation, even cities that do not present PSAS-consistent budgets have noted the superiority of the PSAS framework. Toronto’s 2021 budget stated that complying with PSAS and producing an accrual budget “provides more information as to whether the government entity…is in a better or worse position than the previous year” (City of Toronto 2021). Brampton’s 2025 budget similarly noted that “full accrual budgeting provides stakeholders with a better reflection of the long-term financial health of the municipality for decision-making purposes” (City of Brampton 2025). We agree. Capital assets are critical to municipalities’ capacity to deliver services. Accrual accounting aligns revenues, expenses, costs and benefits better over time.
Provincial regulations create one barrier to PSAS-consistent budgets. Ontario requires its municipalities to balance operating budgets, including transfers to and from reserves. British Columbia requires municipalities to include debt principal repayments in their spending. Provinces should drop such archaic requirements.
Other measures could constrain municipal indebtedness without mandating confusing budgets. Most provinces follow PSAS in their own budgets, and none object to PSAS in municipal financial statements. Indeed, Quebec requires its municipalities to provide PSAS-consistent versions of their budgets to the province. Alberta’s Municipal Government Act explicitly states that a municipal budget presented in a format consistent with its financial statements satisfies provincial requirements with respect to operating and capital budgets.
Despite provincial obstacles, municipalities can and should put PSAS-consistent numbers in their budgets. Richmond’s and Iqaluit’s PSAS-based budgets matched their financial statements line by line, while Surrey produced PSAS-consistent numbers prominently and clearly.
Present Formal, Complete Budgets for Council Approval Every Year
Some cities do not present formal budgets each year, instead producing partial updates to previous multi-year plans. These updates are no substitute for a single document that shows annual consolidated revenue, expense and the bottom line, along with meaningful breakdowns of major revenue sources and programs. We note that Calgary’s new 2026 budget framework features an annual budget with prominently placed PSAS-consistent projections. We expect this change to improve Calgary’s grade in next year’s report card. All cities that do not present formal annual budgets should, like Calgary, follow the lead of the cities that do.
Provide Consolidated Annual Revenues, Expenses and Surpluses/Deficits
Consolidated numbers provide the clearest picture of a city’s operations and their implications for future service capacity. Showing consolidated numbers does not prevent a city’s ability to adjust rates and property taxes or to show the split between costs households can control – by using less water, for example, or smaller garbage bins – and taxes they cannot. Indeed, cities can show the same operating and capital budgeting information they do now, but those numbers should supplement, not replace, PSAS-consistent numbers.
Limit Gaps between Annual Surpluses and Changes in Accumulated Operating Surpluses
Gaps between a city’s budgeted or actual surplus and the change in its accumulated operating surplus over the year create accountability problems. When financial statements show major gains or losses below the annual surplus line, a city’s service capacity is at risk because of circumstances that councillors neither budgeted for nor controlled. Such gaps weaken the link between budget decisions and changes in service capacity. If owning a utility or other investments, for example, hurts a municipality’s capacity to deliver services, a negative adjustment may be appropriate in the financial statements. But opaque presentations discourage useful debate about whether the asset or liability should be managed differently – or disposed of entirely.
Produce More Reliable Budgets
Budgets outline a city’s fiscal plan for the coming year. The projected annual surplus or deficit should help councillors understand how the budget they are debating and voting on will affect the city’s accumulated operating surplus and future service capacity. When budgets are unreliable – significantly overestimating or underestimating revenues and expenses – they undermine accountability. If budgets are difficult to read and experience suggests they will bear little resemblance to the year-end results – which are often much easier to understand – elected officials and voters have less reason to engage with them. Worse, unreliable budgets foster perceptions that officials are withholding information or that the city cannot fulfill its commitments.
Our senior government scorecard evaluates the main estimates, which legislatures must approve before money can be spent.1010 See: Robson, William B.P., and Nicholas Dahir. 2025. Making the Grade: The Fiscal Accountability Report Card for Canada’s Senior Governments, 2025. Commentary 695. Toronto: C.D. Howe Institute. October. https://cdhowe.org/publication/making-the-grade-the-fiscal-accountability-report-card-for-canadas-senior-governments-2025/. Municipal governments have no direct equivalent, so this report card does not include a matching criterion. Still, municipal financial statements with restated budget projections often have a line for in-year changes. These subsequent actions deserve the same scrutiny as the original budget. They deserve discussion in municipal councils and prominent treatment in the financial statements.
Present Key Numbers Early and Unambiguously
No user, however expert, should have to dig through dozens or even hundreds of pages of a document or slide deck to find a municipality’s key numbers. Nor should readers come across more than one candidate for these numbers and wonder which is correct.
We invite readers to search online for their municipality’s budget documents. Too often, they will encounter multiple hyperlinks, reams of pages, and no clear guidance about which highlighted numbers are the definitive totals. Readers who accept our invitation may come away thinking that they are not knowledgeable or skilled enough to make sense of the numbers. But most municipalities’ financial statements demonstrate that opaque presentations are a choice, not a necessity.
Early and unambiguous presentation is easy. Among senior governments, Newfoundland and Labrador stood out for putting its key consolidated numbers on page 2 of its 2023/24 budget. Edmonton’s 2025 budget did the same. Prominent presentation is a huge aid to councillors, reporters and taxpayers.
Show and Explain Variances between Results and Projections
Municipalities should reconcile year-end results with budget projections. Different accounting and inconsistent numbers are formidable obstacles even for experts and will quickly discourage non-expert readers. PSAS-consistent budgets would make this easier. As the Public Sector Accounting Board (PSAB) noted: “[the actual-to-budget] comparison is meaningful when the budget is presented using the same:
(a) basis of accounting;
(b) accounting principles;
(c) scope of activities; and
(d) classifications as the financial statements” (PSAB 2022, 38).
Even municipalities with PSAS-consistent aggregate numbers rarely show line-by-line revenues and expenses that match their financial statements. Municipalities should make those comparisons easy and show the original numbers from their budget projections in their financial statements. We also encourage municipalities to follow the federal, provincial and territorial governments that publish in-year PSAS-consistent reports comparing interim results to budget plans.
Publish Timely Budgets and Financial Statements
Prompt approval of budgets and timely publishing of audited financial statements are essential to accountability. Councillors should approve spending before it occurs and should have timely information about the current year before beginning discussions on the next budget.
Municipalities that use a calendar year for financial accounting and reporting purposes should vote on their budgets well before January 1. Ontario’s Municipal Act prevents municipalities from approving a budget for the year following an election during the election year itself. This rule contributed to late 2023 budgets,1111 Ontario held municipal elections on Oct. 24, 2022. hurting Ontario municipalities’ grades in our 2023 report card. Unless the province amends this problematic law, the problem will recur: elections in the fall of 2026 will delay Ontario municipalities’ 2027 budgets. Much better is Prince Edward Island’s requirement that, “on or before March 31 in each year, City Council shall by resolution adopt a budget for the upcoming fiscal year” (City of Charlottetown 2025).
Ontario’s “strong mayor” law, which requires mayors to present budgets by February 1, will apply to all non-regional municipalities in Ontario in this survey. This law also needs revising. Many municipalities subject to the law are likely to follow Ottawa and Toronto, which got “strong” mayors first and have approved their budgets well after the January 1 start of the fiscal year ever since.
Some municipalities justify late budgets by pointing to provincial fiscal years running from April 1 to March 31 and the importance of provincial transfer decisions. One solution would be for more provinces to imitate Nova Scotia and Prince Edward Island by aligning municipal and provincial fiscal years. Another response would be for provinces to follow the lead of the federal government, which moved its budget presentation to the fall in 2025 after a deteriorating record of producing budgets ahead of the start of its fiscal year. Until such changes happen, municipalities must simply do the best they can. Waiting for provincial budgets guarantees that a large share of the municipality’s spending will occur without legislative authorization.
Municipalities using calendar-year reporting should also publish their financial statements before April 30. Faster reporting encourages faster information gathering and gives budget planners more up-to-date estimates for the year about to end. Instead, most municipal councils develop their budgets with reference to past budgets – a practice that even many municipal officials acknowledge makes little sense. Budgeting using the latest audited results and updated estimates is better.
Untimely financial statements can also signal trouble. They are red flags for auditors, donors and investors. The Ontario Securities Commission requires TMX-listed companies to file their annual results no later than three months after year-end (OSC 2023) – a deadline the Commission itself also achieves. Alberta requires its municipalities to release their statements by May 1 – a deadline Calgary and Edmonton are clearly able to meet. All municipalities should follow that example.
The Finances of Canada’s Municipalities Should Be More Transparent
Municipalities provide critical services to most Canadians and absorb a commensurately large share of Canadians’ incomes. Councillors need clear financial information to hold officials to account, and taxpayers and voters in turn need it to hold councillors to account. The effects of a slowing economy on revenues, pressure on spending from demands for housing and infrastructure, and constrained finances of senior governments will likely cause financial stresses for municipalities in the years ahead. Better understanding of municipal finances will help navigate those challenges.
The budgeting practices of most major Canadian municipalities should support engagement by elected representatives and voters more than they do. PSAS-consistent budgets that users can compare easily with financial statements, including more accessible and timely financial information, would help raise the financial management and fiscal accountability of Canada’s cities to a level more in line with their importance in Canadians’ lives.
This report is part of an ongoing C.D. Howe Institute project on municipal fiscal accountability. We thank Clae Hack, Alexandre Laurin, Charles Morissette, Kayla Petrovsky Fleming, Joseph Silva, many anonymous reviewers, and municipal officials who have provided valuable feedback on earlier reports in this series for their insights. We extend special thanks to Yang Zhao for the graphic design work and Percy Sherwood for editing. Responsibility for any errors and for the conclusions of this report is ours.
References
City of Brampton. 2025. 2025 Budget. January.
City of Charlottetown. 2025. 2025/26 Financial Plan: Operating and Capital Budgets. March.
City of Toronto. 2021. Budget. February.
Dachis, Benjamin. 2020. Gimme Shelter: How High Municipal Housing Charges and Taxes Decrease Housing Supply. Commentary 584. Toronto: C.D. Howe Institute. November.
Dachis, Benjamin, and William B.P. Robson. 2011. “Holding Canada’s Cities to Account: An Assessment of Municipal Fiscal Management.” Backgrounder 145. Toronto: C.D. Howe Institute. November.
International Budget Partnership. 2024. The Open Budget Survey, 2023. Washington, DC. March.
Organisation for Economic Co-operation and Development (OECD). 2002. OECD Best Practices for Budget Transparency. Paris.
Ontario Securities Commission (OSC). 2023. “Filing Due Dates Calendar for Annual and Interim Filings by Reporting Issuers.”
Public Sector Accounting Board. 2022. The Conceptual Framework for Financial Reporting in the Public Sector. December.
Robson, William B.P. 2019. “Does Accounting Drive Budget Decisions? The Strange Case of the Toronto Subway ‘Upload’.” Intelligence Memo. Toronto: C.D. Howe Institute. September 20.
Robson, William B.P., and Nicholas Dahir. 2024. “Cities Sit on Too Much Cash. Here’s How They Could Help with Canada’s Housing Crisis.” The Globe and Mail. August 19.
______________. 2025. Making the Grade: The Fiscal Accountability Report Card for Canada’s Senior Governments, 2025. Commentary 695. Toronto: C.D. Howe Institute. October.
York Region. 2024. 2025-2027 Budget. December.