


 Canada’s reduced immigration targets mark a structural shift in labour force growth that will make economic data look weaker than in the past, even when the economy is operating close to capacity. The risk is not poor performance, but misinterpretation.
- Under a baseline scenario, employment is projected to decline in 2026 and 2027, and real GDP growth may reach only about 0.4-0.5 percent in the near term and roughly 1.2 percent over the long run. These outcomes reflect demographic constraints, not economic weakness.
- Compared to recent official projections, this implies a materially lower growth path, leaving the level of real GDP about 11.5 percent lower by 2060, with important implications for fiscal sustainability.
- The main policy challenge is diagnostic. If demographic-driven softness is mistaken for cyclical weakness, policy responses, particularly fiscal stimulus or monetary easing, could be miscalibrated. Interpreting the data correctly will be critical in the years ahead.
 Canada’s reduced immigration targets mark a structural shift in labour force growth that will make economic data look weaker than in the past, even when the economy is operating close to capacity. The risk is not poor performance, but misinterpretation.
Introduction
Canada’s economic landscape has shifted fundamentally. After years of immigration-driven population and labour force expansion, the federal government has sharply reduced immigration targets. This shift marks a demographic transition that has implications for two of the most closely watched indicators of economic health: employment and real GDP growth.
The purpose of this paper is to set realistic expectations. The estimates show that in a normally functioning economy – neither overheated nor demand-deficient – employment under the baseline scenario is projected to decline by 0.3 percent in 2026 and 0.1 percent in 2027. In other words, employment falls by approximately 54,000 in 2026 and 17,000 in 2027, or monthly declines of roughly 4,500 and 1,400, respectively. These are not signs of a struggling economy. They are what a normally operating labour market delivers, given the demographic shifts underway.
Real GDP growth this year may be no more than 0.5 percent. Long-run growth is likely to average little more than 1 percent annually.
These projections are much weaker than in recent official forecasts such as in the federal government’s Spring Economic Update 2026 and the April 2026 Monetary Policy Report. As a result, resetting economic expectations has profound implications for fiscal and monetary policy.
Employment Benchmark
To evaluate labour market performance during a period of shifting immigration and population growth, we construct a benchmark path for employment that reflects demographic changes. The goal is to answer a simple question: given projected population growth and a normally functioning labour market, how fast should employment grow?
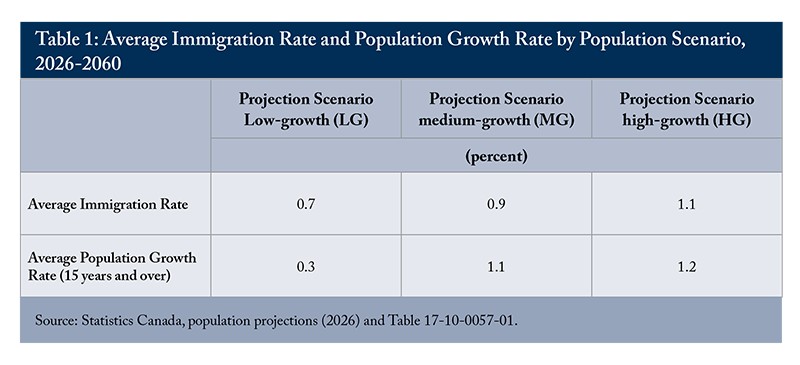
The benchmark uses recent population projections from Statistics Canada for 2026 to 2060. We consider three population scenarios – low (L), medium (M), and high (H) – that differ primarily in their assumptions about immigration rates (Table 1).1 The medium scenario serves as the central reference case, as its longer-term immigration rate aligns most closely with the federal immigration plan for 2026-28 (slightly less than 1 percent of the population). The low scenario represents a plausible near-term alternative path, particularly during the transition period when immigration levels are adjusting. The high scenario is treated as an illustrative upper bound intended to provide sensitivity to stronger population growth assumptions, rather than as a realistic baseline.
To translate projected population into labour supply, we apply age-specific labour force participation rates for three broad groups: ages 15-24, 25-54, and 55 and over. Participation rates for all groups are assumed to remain stable at their recent post-pandemic averages (2024-2025). This approach avoids extrapolating earlier structural trends and abstracts from short-term fluctuations, ensuring that projected employment growth reflects changes in population size and age composition rather than behavioural shifts in participation.
We then derive benchmark employment by applying a constant “normal” unemployment rate of 6.9 percent to the projected labour supply. This value corresponds to the average unemployment rate over 2000-2019, excluding recessionary years, and represents conditions in a normally operating economy – neither overheated nor demand-deficient. We use these benchmark levels to calculate benchmark employment growth rates.2
Under these assumptions, demographic forces – immigration, overall population growth, and the evolving age structure – fully drive benchmark employment growth. Deviations of actual employment from this benchmark can therefore be interpreted as demand-driven rather than structural. This framework provides a transparent reference point for assessing labour market outcomes as immigration and population growth adjust over the coming decades.
What the Employment Benchmark Tells Us
Under labour market conditions consistent with the 20 years preceding 2020, employment in Canada is projected to decline in both 2026 and 2027. This result holds under both the low and medium (baseline) immigration scenarios (Figure 1). In the baseline, employment falls by approximately 54,000 in 2026 (about 4,500 per month) and 17,000 in 2027 (about 1,400 per month). Under the low scenario, the decline is much steeper: roughly 197,000 in 2026, or about 16,400 per month. These are not signs of a struggling economy. They reflect how a normally operating labour market responds, given the demographic shift underway.
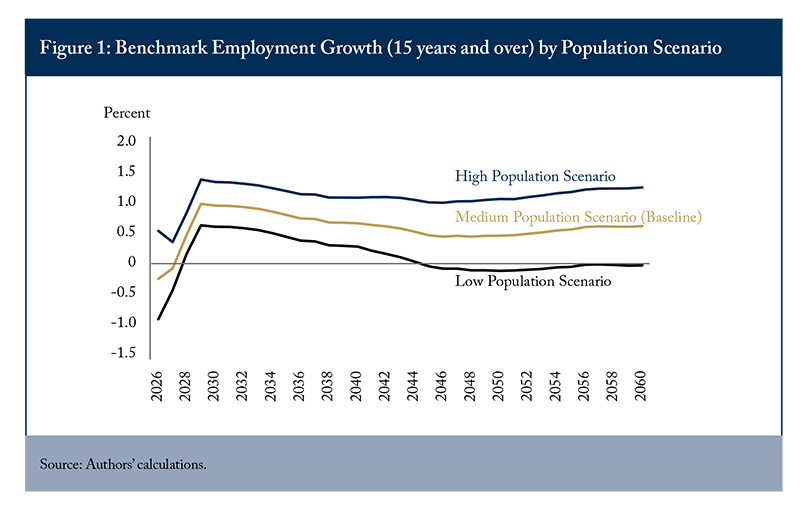
This has important implications for interpreting monthly and annual employment data. Zero employment growth, or even small gains, would represent above-benchmark performance in this environment.
Looking beyond the near term, employment growth will recover as demographic forces stabilize. Growth driven by demographics will strengthen somewhat over the latter part of the decade before settling into a long-run pace of roughly half a percent per year.
Long-Run GDP Growth Scenarios
To assess how shifting immigration and population growth affect long-run economic performance, we simulate real GDP growth under alternative demographic scenarios. Using the same low (L), medium (M), and high (H) population projections described earlier, we ask a straightforward question: what would happen to real GDP growth if labour productivity and hours worked continued along their post-2000 trends?
Real GDP can be expressed as total hours worked multiplied by output per hour (labour productivity). Our long-run growth scenarios therefore project these two components separately.3
We model labour productivity (real output per hour worked) using a simple exponential trend in which productivity grows at a constant annual percentage rate, following Laurin and Drummond (2021). Estimated over 2000–2024, this yields an average annual growth rate of 0.84 percent.4 In the simulations, productivity is assumed to continue growing at this constant rate over 2026-2060.
We project total hours worked by decomposing them into population, labour force participation, and average hours worked per worker by age group (ages 15-24, 25-54, and 55+). Population follows the L, M, and H demographic scenarios described earlier.
Participation rates for all three age groups are assumed to remain constant at their 2025 levels. While participation has fluctuated cyclically over the past two decades, recent years show no sustained upward momentum in any cohort. Participation among those aged 25-54 has remained broadly stable, rates for ages 15-24 have trended modestly downward, and the earlier increase among those aged 55+ has largely plateaued. Holding participation rates constant avoids extrapolating past structural shifts and provides a neutral baseline that isolates demographic effects.
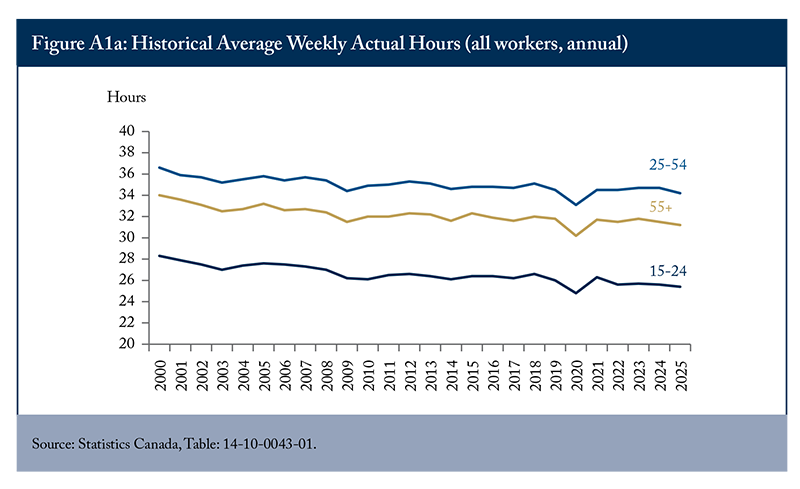
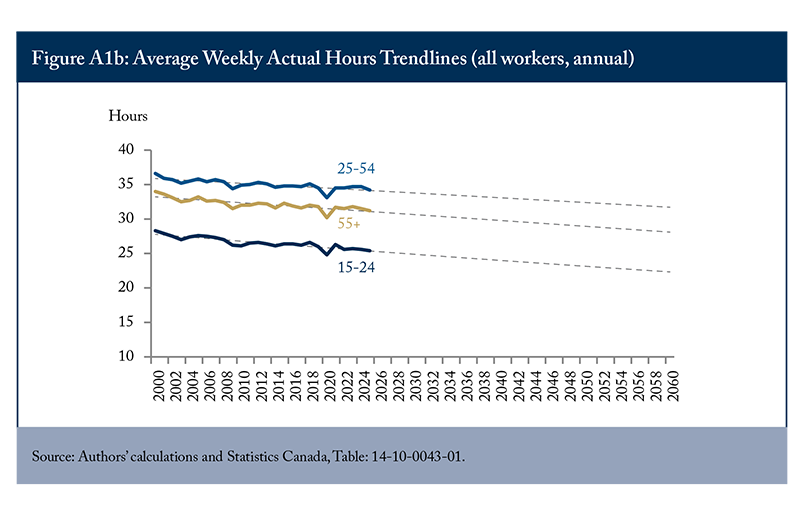
Average hours worked per worker have declined gradually over several decades, although the pace of decline has moderated more recently. In the main specification, we assume that this trend continues at its 2000-2024 average pace: average hours decline by 0.4 percent annually for ages 15-24, 0.2 percent for ages 25-54, and 0.3 percent for ages 55+. As a sensitivity test, we also consider a scenario in which average hours remain constant under all population paths.
Combining projected productivity growth with projected total hours worked yields simulated paths for real GDP growth under each demographic scenario from 2026 to 2060. Because productivity growth is held constant across scenarios, differences in GDP growth reflect differences in labour supply growth driven by immigration and demographic change. This framework isolates the structural impact of population dynamics on Canada’s long-run growth trajectory.
What the GDP Scenarios Tell Us
The GDP scenarios based on population projections show that supply-driven growth will be very modest in the near term and only slightly stronger over the long run (Figure 2). In 2026, real GDP growth on a supply basis may be no more than 0.5 percent. This shows what a normally operating economy is expected to produce, given reduced immigration and an ageing workforce that limits hours growth.
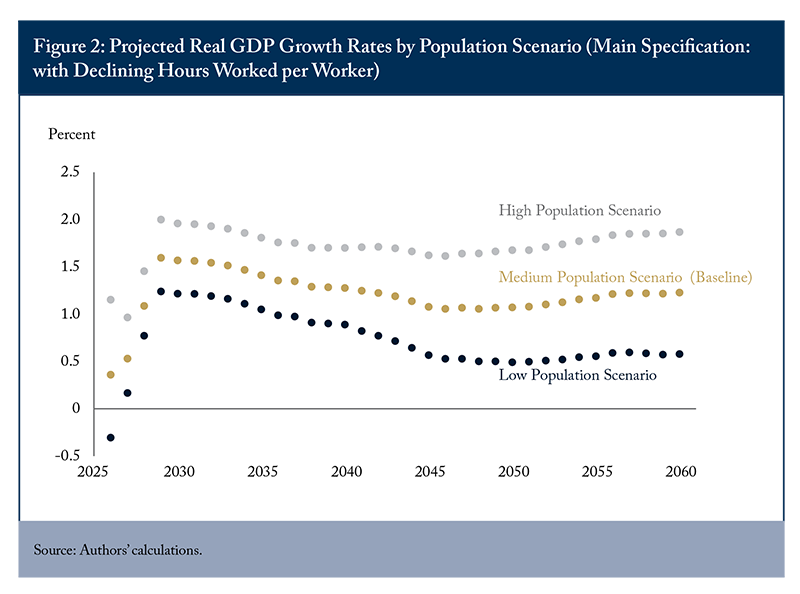
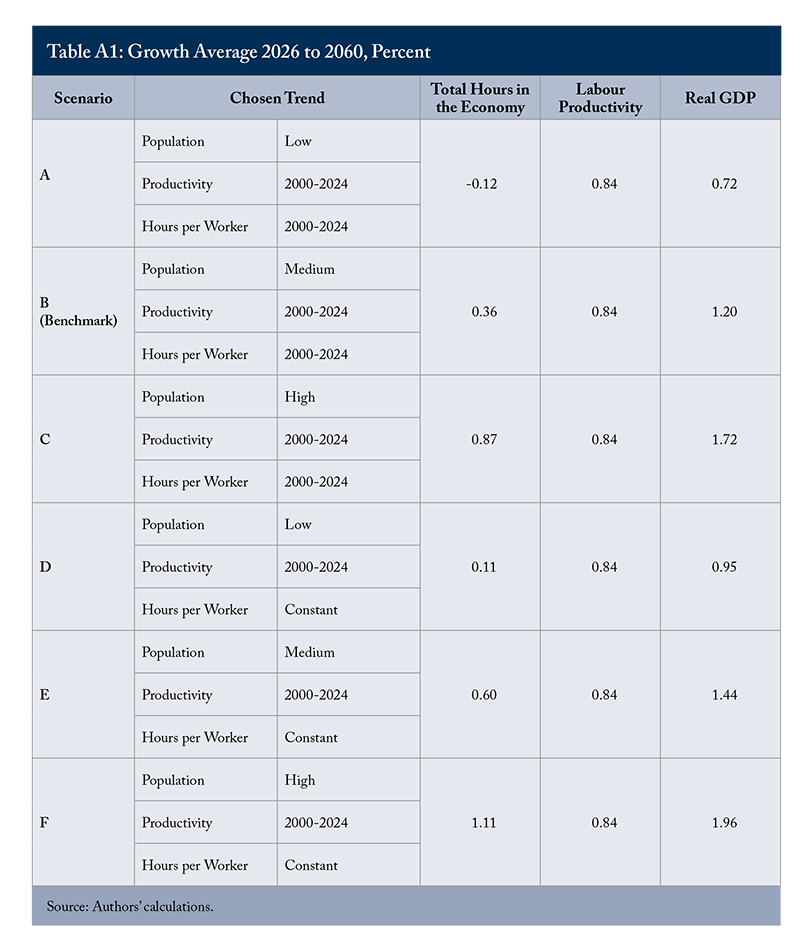
Over the longer run, Table A1 presents six scenarios that combine three population paths with alternative assumptions about hours per worker (declining versus constant), all under the post-2000 productivity trend (0.84 percent per year). Under declining hours (the 2000-2024 trend), average real GDP growth over 2026-2060 ranges from 0.72 percent per year (low immigration, Scenario A) to 1.72 percent (high immigration, Scenario C), with the benchmark scenario (B) at 1.2 percent. Holding hours per worker constant raises growth across all population scenarios, from 0.95 percent under low immigration (Scenario D) to 1.96 percent under high immigration (Scenario F).
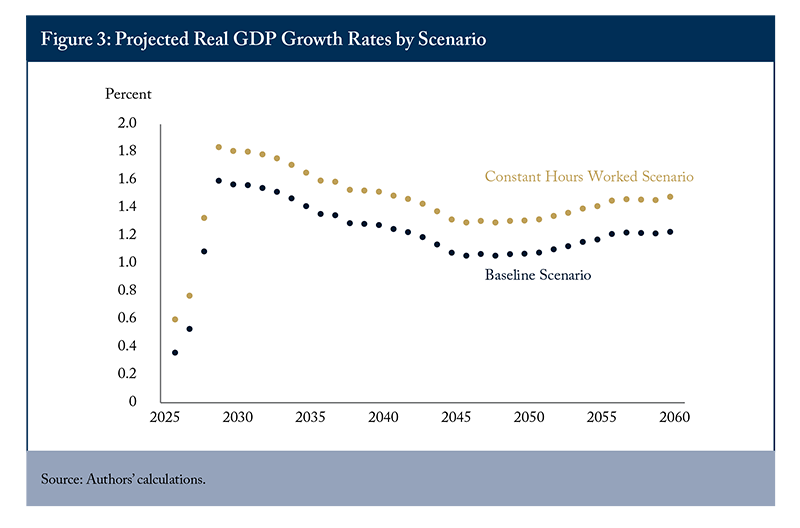
Figure 3 isolates the role of hours worked by holding the population path fixed at the benchmark (medium) level. Under this scenario, average growth increases from 1.2 percent (Scenario B) to 1.44 percent when hours per worker are assumed to remain constant (Scenario E).
Comparison with Official Projections
Table 2 compares the supply-driven projections of real GDP growth under the baseline scenario with those underlying the government’s Spring Economic Update 2026 (SEU) and the Bank of Canada’s April 2026 Monetary Policy Report. The differences are substantial and persist across both the near and longer term.5
In the short run, the baseline scenario yields more subdued growth. Real GDP growth is projected to grow by 0.4 percent in 2026, 0.5 percent in 2027, and 1.1 percent in 2028, compared with 1.1 percent, 1.9 percent, and 1.9 percent, respectively, in the SEU. The Bank of Canada’s projections are closer to the SEU, at 1.2 percent in 2026, 1.6 percent in 2027, and 1.7 percent in 2028. By 2029, growth in the baseline scenario rises to 1.6 percent and remains at that rate in 2030, still below the SEU’s 1.9 percent and 1.8 percent rates assumed in the SEU for 2029 and 2030, respectively.6
These differences translate into a widening gap in the level of output over time. By 2030, real GDP under the baseline scenario is approximately 3.3 percent lower than in SEU. Over the longer term, the gap widens further. Average annual growth over 2031-2060 is projected at 1.2 percent under the baseline scenario, compared with 1.5 percent in the SEU – a difference of 0.3 percentage points. While modest annually, this divergence has large cumulative effects: if growth were 1.2 percent rather than 1.5 percent over this period, the level of real GDP in 2060 would be about 8.5 percent lower. Including the shortfall accumulated over 2026-2030, the total gap would be about 11.5 percent.
The implications for fiscal sustainability are significant. Lower output directly reduces revenue growth and, absent offsetting policy measures, leads to higher deficits and debt ratios. As such, the more optimistic growth assumptions embedded in the SEU materially affect assessments of the long-term fiscal outlook.
The divergence in projections largely reflects differing assumptions about supply and demand. The baseline scenario is explicitly supply-constrained, reflecting demographic headwinds, slower labour force growth, and modest productivity trends. By contrast, the stronger growth profile in the SEU and the Bank of Canada’s projections reflects more favourable supply-side assumptions, particularly higher trend productivity, along with demand growth outstripping supply in the short-term, leading to stronger potential output growth relative to the baseline.
Whether such an outcome is plausible remains uncertain. Matching official projections would require sustained strength in demand and/or stronger-than-expected supply-side performance despite global headwinds, including trade tensions and heightened uncertainty. There is also a risk that outcomes fall short of expectations. If demand growth fails to keep pace even with the modest supply constraints in the baseline scenario, actual growth could fall short of these projections – widening the fiscal gap beyond the already sizable shortfall identified here and compounding risks to long-term fiscal sustainability.
Conclusions
This paper constructs supply-side benchmarks for employment and real GDP growth under Canada’s new demographic reality. These benchmarks are essential for interpreting economic data over the next several years.
A central implication is that economic performance may appear weaker than in the past, even when the economy is operating close to capacity. Slower labour force growth reduces the potential for both employment and output growth. In this context, weaker headline employment numbers in the near-term should not be interpreted as signs of economic weakness.
Monthly employment may decline in 2026 and 2027. Monthly losses of 5,000 to 10,000 jobs would reflect a normally operating economy. The risk of misdiagnosis is real: stimulus deployed in response to what are actually demographic-driven employment declines could generate inflationary pressure without addressing the underlying structural shift. This distinction is critical for both fiscal and monetary policy calibration.
The analysis of real GDP growth points to a similar conclusion. Supply-side constraints – slower labour force growth, declining hours per worker, and modest productivity trends – imply that real GDP growth will be materially weaker than official projections suggest. Under the baseline scenario, real GDP growth is projected at around 0.4 to 0.5 percent in the near term and roughly 1.2 percent over the longer run. These figures fall well below the growth rates in the SEU and the Bank of Canada’s April 2026 projections, in part due to differences in assumptions and population projections.
If growth instead follows the baseline scenario rather than official projections, cumulative real GDP could be about 11.5 percent lower by 2060. This gap translates into structurally weaker revenues and higher debt ratios, absent policy adjustment. Fiscal projections that assume demand will close the gap between supply-constrained and official growth paths risk understating the long-run fiscal challenge.
Monetary policy must account for the same structural reality. The Bank of Canada faces an environment in which weak employment and output data may reflect supply contraction rather than demand shortfall. In this context, easing aggressively in response to demographic-driven softness could be premature. Effective policy depends on correctly diagnosing the source of weakness.
More broadly, the findings point to a conditional conclusion: absent changes in key drivers, economic growth will remain below demand-driven projections. Sustained improvement in growth under moderate immigration would require stronger productivity growth, higher labour force participation, and increased hours worked.
These conditions define the policy challenge. Improving productivity will be central. This includes fostering business investment, supporting technology adoption, reducing barriers to firm growth, and maintaining a policy environment that encourages capital formation. Recent evidence points to continued post-pandemic weakness in productivity (Caranci and Marple 2024). At the same time, business investment per worker has declined since 2015, reducing the capital available to workers and weighing on productivity growth (Robson and Bafale 2025). Addressing this trend will require a more investment-friendly policy environment, including more neutral and competitive tax treatment of capital, reduced regulatory barriers, and greater policy certainty.
There is also scope to raise labour supply by increasing participation and hours worked. This includes strengthening work incentives (Mahboubi and Zhang 2025), reducing marginal effective tax rates (Laurin and Dahir 2025), expanding access to affordable childcare (Mahboubi and Zhang 2026), and improving credential recognition for immigrants (Mahboubi and Zhang 2024; 2025). Immigration remains an important lever, but its economic contribution depends on absorptive capacity and the composition of inflows, which shape labour market outcomes and productivity (Skuterud and Zhang 2026; Doyle, Skuterud, and Worswick 2024).
These results point to a shift in the nature of Canada’s economic challenge. The constraint is increasingly structural rather than cyclical, reflecting the interaction of demographics, productivity, and labour supply. Policies that raise the economy’s supply capacity will therefore play a central role in shaping long-term performance. This paper also argues for recalibrating economic expectations. Canada’s economy is not broken. It is adjusting. Understanding that adjustment is a precondition for sound policy in the years ahead.
The authors extend gratitude to Steve Ambler, Pierre Fortin, Alexandre Laurin, Peter MacKenzie, Angelo Melino, Mikal Skuterud, and several anonymous referees for valuable comments and suggestions. The authors retain responsibility for any errors and the views expressed.
Appendix
References
Bank of Canada. 2026. Monetary Policy Report. Bank of Canada. April.
Caranci, Beata, and James Marple. 2024. “From Bad to Worse: Canada’s Productivity Slowdown Is Everyone’s Problem.” TD Economics. September 12.
Doyle, Matthew, Mikal Skuterud, and Christopher Worswick. 2024. Optimizing Immigration for Economic Growth. Commentary 662. Toronto: C.D. Howe Institute.
Government of Canada. 2026. Spring Economic Update 2026: Annex 1 – Details of Economic and Fiscal Projections. Ottawa: Department of Finance Canada.
____________. 2025a. Budget 2025: Annex 1 – Details of Economic and Fiscal Projections. Ottawa: Department of Finance Canada.
____________. 2025b. Canada Strong: Budget 2025. Department of Finance Canada.
Laurin, Alexandre, and Don Drummond. 2021. “Rolling the Dice on Canada’s Fiscal Future.” E-Brief. Toronto: C.D. Howe Institute. July 29.
Laurin, Alexandre, and Nicholas Dahir. 2025. The Clawback Trap: How Canada’s Benefit System Can Undermine Work and Saving. Commentary 697. Toronto: C.D. Howe Institute.
Mahboubi, Parisa, and Tingting Zhang. 2026. From Promise to Practice: A Critical Review of the Federal Childcare Plan. Commentary 709. Toronto: C.D. Howe Institute.
Mahboubi, Parisa, and Tingting Zhang. 2025. 2024 Labour Market Review: Challenges, Trends, and Policy Solutions for Canada. Commentary 678. Toronto: C.D. Howe Institute.
____________. 2024. Harnessing Immigrant Talent: Reducing Overqualification and Strengthening the Immigration System. Commentary 672. Toronto: C.D. Howe Institute.
Robson, William, and Mawakina Bafale. 2025. Canada’s Investment Crisis: Shrinking Capital Undermines Competitiveness and Wages. Commentary 699. Toronto: C.D. Howe Institute.
Skuterud, Mikal, and Ruiwen Zhang. 2026. Selection Matters: Lessons from Two Decades of Immigrant Earnings. Commentary 714. Toronto: C.D. Howe Institute.
Statistics Canada. 2026. Population Projections for Canada (2025 to 2075), Provinces and Territories (2025 to 2050): Technical Report on Methodology and Assumptions. Catalogue no. 17-20-0003. Ottawa: Statistics Canada. January.
This E-Brief is a publication of the C.D. Howe Institute.
Don Drummond is a Fellow-in-Residence at the C.D. Howe Institute and Stauffer-Dunning Fellow at Queen’s University.
Parisa Mahboubi is Associate Director of Research at the C.D. Howe Institute.
This E-Brief is available at www.cdhowe.org.
Permission is granted to reprint this text if the content is not altered and proper attribution is provided.
The authors retain responsibility for any errors and the views expressed.