






by Jeremy M. Kronick and Wendy Wu
- Using a comprehensive series of Canadian monetary policy shocks that captures movements across the entire yield curve, this Commentary examines how monetary policy affects aggregate business investment, GDP investment categories, and investment in 10 Canadian industries. Unlike previous studies, the analysis incorporates conventional and unconventional policy actions, scheduled and unscheduled announcements, and communications by senior Bank of Canada officials.
- As expected, monetary policy tightening reduces business investment overall, but its effects differ across investment types and sectors. Machinery and equipment investment shows the largest and most persistent response among broad investment categories, while sector-level results show substantial differences in the direction, magnitude, and timing of responses.
- Moreover, the effect on investment differs depending on the type of monetary policy shock it faces, be it a shift in the entire yield curve or the more traditional movement at the front-end of the curve.
- The findings suggest that monetary policy’s effect on aggregate investment depends on the sectoral composition of the Canadian economy. As that composition changes over time, a more granular understanding of monetary transmission can help the Bank of Canada better assess how policy actions are likely to affect current aggregate business investment and, ultimately, the broader economy and inflation.
Introduction
Monetary policy affects the real economy through several transmission channels. Conventional theory (e.g., New Keynesian) predicts that when central banks raise interest rates, investment and aggregate demand slow due to a higher cost of capital, helping bring inflation back to target, and that the opposite occurs under monetary easing. For monetary authorities, however, understanding how monetary policy propagates through the economy is central to assessing its effect on aggregate demand and inflation and designing more effective policy. Different sectors respond with varying speeds and magnitudes, reflecting sector-specific characteristics such as capital intensity and financing needs.
Comparing sectoral responses can, therefore, provide valuable insights into how monetary shocks are transmitted across the economy (Ganley and Salmon 1997). These differences are often obscured in aggregate data, highlighting the importance of using more granular information to uncover distinct sectoral dynamics (Dale and Haldane 1995). Recent work also shows that heterogeneities on the production side can affect aggregate fluctuations.11 See Acemoglu et al. (2012) and Pasten et al. (2020).
With this background, our Commentary asks: How does the sectoral composition of the Canadian economy affect monetary policy’s impact on aggregate investment?
Empirical research on heterogeneous sectoral responses to monetary policy remains limited. Most existing studies examine differences in sectoral output,22 See, for example, Ganley and Salmon (1997) and Hayo and Uhlenbrock (1999). with far less attention to how input decisions – especially investment – adjust to policy shocks. Farès and Srour (2001) provide the only detailed analysis of Canadian sectoral responses to monetary policy that we are aware of, concluding that investment displays the strongest reaction compared to consumption, government spending, imports, and exports. However, their study examines only the transmission mechanism in very broad sectors, and their data end in 1999. Given substantial changes in monetary policy frameworks and financial structures over the past three decades (Boivin, Kiley, and Mishkin 2010), it is important to reassess how Bank of Canada policy affects sectoral investment using more recent data.
Our study fills this gap by providing a comprehensive analysis of the investment channel of monetary policy across Canadian sectors. We show that the composition of economic sectors matters for monetary policy’s impact on aggregate investment. Our focus on investment is justified for many reasons, including the fact that Canada has lagged badly in this area for more than a decade relative to its peers (Robson and Bafale 2025).
Identifying the dynamic causal effects of monetary policy on investment requires overcoming the challenge that interest rates both respond to the state of the economy and influence it (called reverse causality in statistical parlance). This dual influence creates a complex feedback loop, made more difficult by the lags with which monetary policy works, making it hard to disentangle the true causal impact of monetary policy on firm investment. To overcome this challenge, we employ a newly constructed Canadian monetary policy shock series from Koeppl, Kronick, and McNeil (2024) that incorporates (1) conventional and unconventional policy actions, assessing not just how short-term interest rates impact economic variables, but the whole yield curve and (2) both scheduled and unscheduled Bank of Canada announcements, as well as speeches by its senior officials. Our empirical strategy relies on local projections, allowing us to trace how investment reacts to a monetary policy shock over time.33 See Jordà (2005) for more.
We begin by examining investment dynamics, using aggregate gross fixed capital formation data from Statistics Canada. Our sample begins in 1997, to coincide with the period after the Bank of Canada’s adoption of an inflation-targeting monetary policy framework in 1991 and after it started targeting 2 percent inflation in 1996. This ensures that our study is relevant to the current monetary framework. We then investigate these dynamics in three major investment categories – construction, machinery and equipment (M&E), and intellectual property (IP). Next, we explore responses within these categories, such as residential and non-residential construction, research and development (R&D), and software investment. We also ask how leverage44 We define leverage, following Grob and Züllig (2024), as the ratio of total financial liabilities divided by total assets for non-financial private corporations in Canada. affects the strength of monetary policy transmission, as well as whether monetary policy affects investment differently depending on the stage of the business cycle.
Finally, we investigate responses across 10 North American Industry Classification System (NAICS)-based sectors55 NAICS is an industry classification system jointly created by statistical agencies in the United States, Canada, and Mexico. See https://www.statcan.gc.ca/en/subjects/standard/naics/2017/v3/introduction. using COMPUSTAT66 COMPUSTAT, according to Marketplace S&P Global, “provides standardized North American and global financial statements and market data for over 80,000 active and inactive publicly traded companies that financial professionals have relied on for over 50 years.” See: https://www.marketplace.spglobal.com/en/datasets/compustat-financials-(8). data – agriculture, mining, utilities, construction, manufacturing, retail, transportation, finance, real estate, and services.77 The NAICS codes for our sectors are: Agriculture (11), Mining (21), Utilities (22), Construction (23), Manufacturing (31–33), Transportation (48 and 49), and Real Estate (53). The retail sector aggregates are constructed using NAICS codes 44 and 45 (Retail Trade). The finance sector aggregates are constructed using NAICS code 52 (Finance and Insurance). Our service aggregates include the sum of the following sectors: 54 (Professional, Scientific, and Technical Services), 56 (Administrative and Support and Waste Management and Remediation Services), 61 (Educational Services), 71 (Arts, Entertainment, and Recreation), 72 (Accommodation and Food Services), and 81 (Other Services). While COMPUSTAT data cover only publicly traded firms, they allow us to analyze investment at the subsector level.
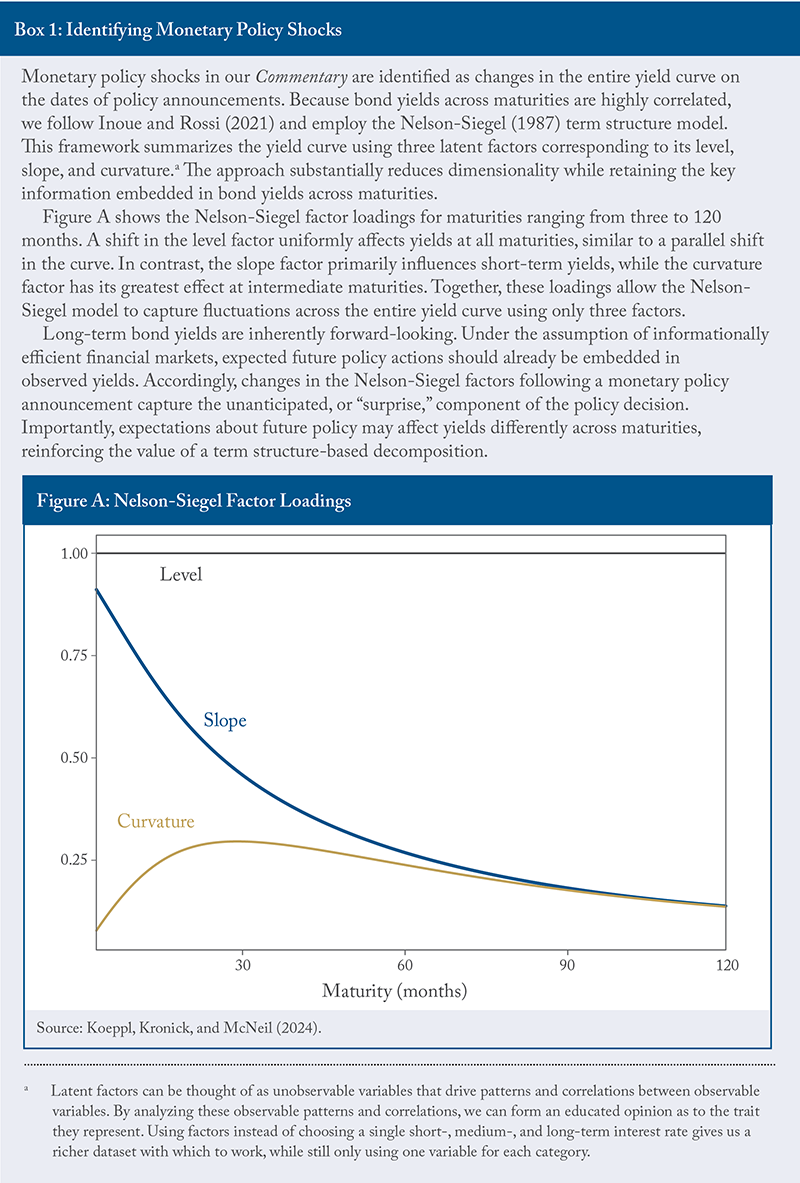
At the aggregate level, as expected, investment falls in response to monetary policy tightening.88 Note that our local projections analysis is set up to be symmetric, meaning the results would simply flip if, instead, we looked at a monetary policy expansion. The next step of this analysis could look to allow for asymmetry between the effects of monetary policy tightening and loosening in a local projections setup as in Kronick and Villarreal (2020), which is based on the work of Ramey and Zubairy (2018). The level factor, which shifts the entire curve, has the longest, most significant, and largest impact on investment, followed by the slope factor, which represents the typical monetary policy shock used in the literature. Meanwhile, the curvature factor – an increase in medium-term rates – has no significant impact at the aggregate level (see Box 1 for more on these factors). These results match those of Koeppl, Kronick, and McNeil (2024), who analyzed the impact of these shocks on GDP and inflation.
At the next level of granularity, results for structures, M&E, and IP investment are consistent with aggregate investment because all three categories fall in response to monetary policy tightening, with larger and more significant effects from the level and slope factors. They are also consistent with the literature suggesting that structures and M&E investment are more interest-sensitive because physical capital plays a greater role, compared with IP, which relies more on intangible capital.99 See, for example, Dedola and Lippi (2005); Peersman and Smets (2005); Durante et al. (2022); and Crouzet and Eberly (2019).
In contrast to Farès and Srour (2001), who report similar qualitative effects for structures (in particular, housing) and M&E investment, we find that M&E investment has the largest and most persistent response among the three major sectors. Our findings also differ from theirs in other ways: they find that non-residential construction reacts first following a contractionary shock, while we find that residential construction adjusts most rapidly because housing demand is more interest-sensitive (or, put differently, because commercial construction is harder to stop once underway).
Breaking IP investment down into its two major components, R&D and software, we find a significant effect from the level factor on R&D and from the curvature factor on software. One explanation for the latter result is the long period of time it takes for software companies to become profitable. Higher rates increase discount rates and thus lower net-present values. Medium-term interest rates matter more for the net-present values of firms whose projected cash flows lie further in the future.
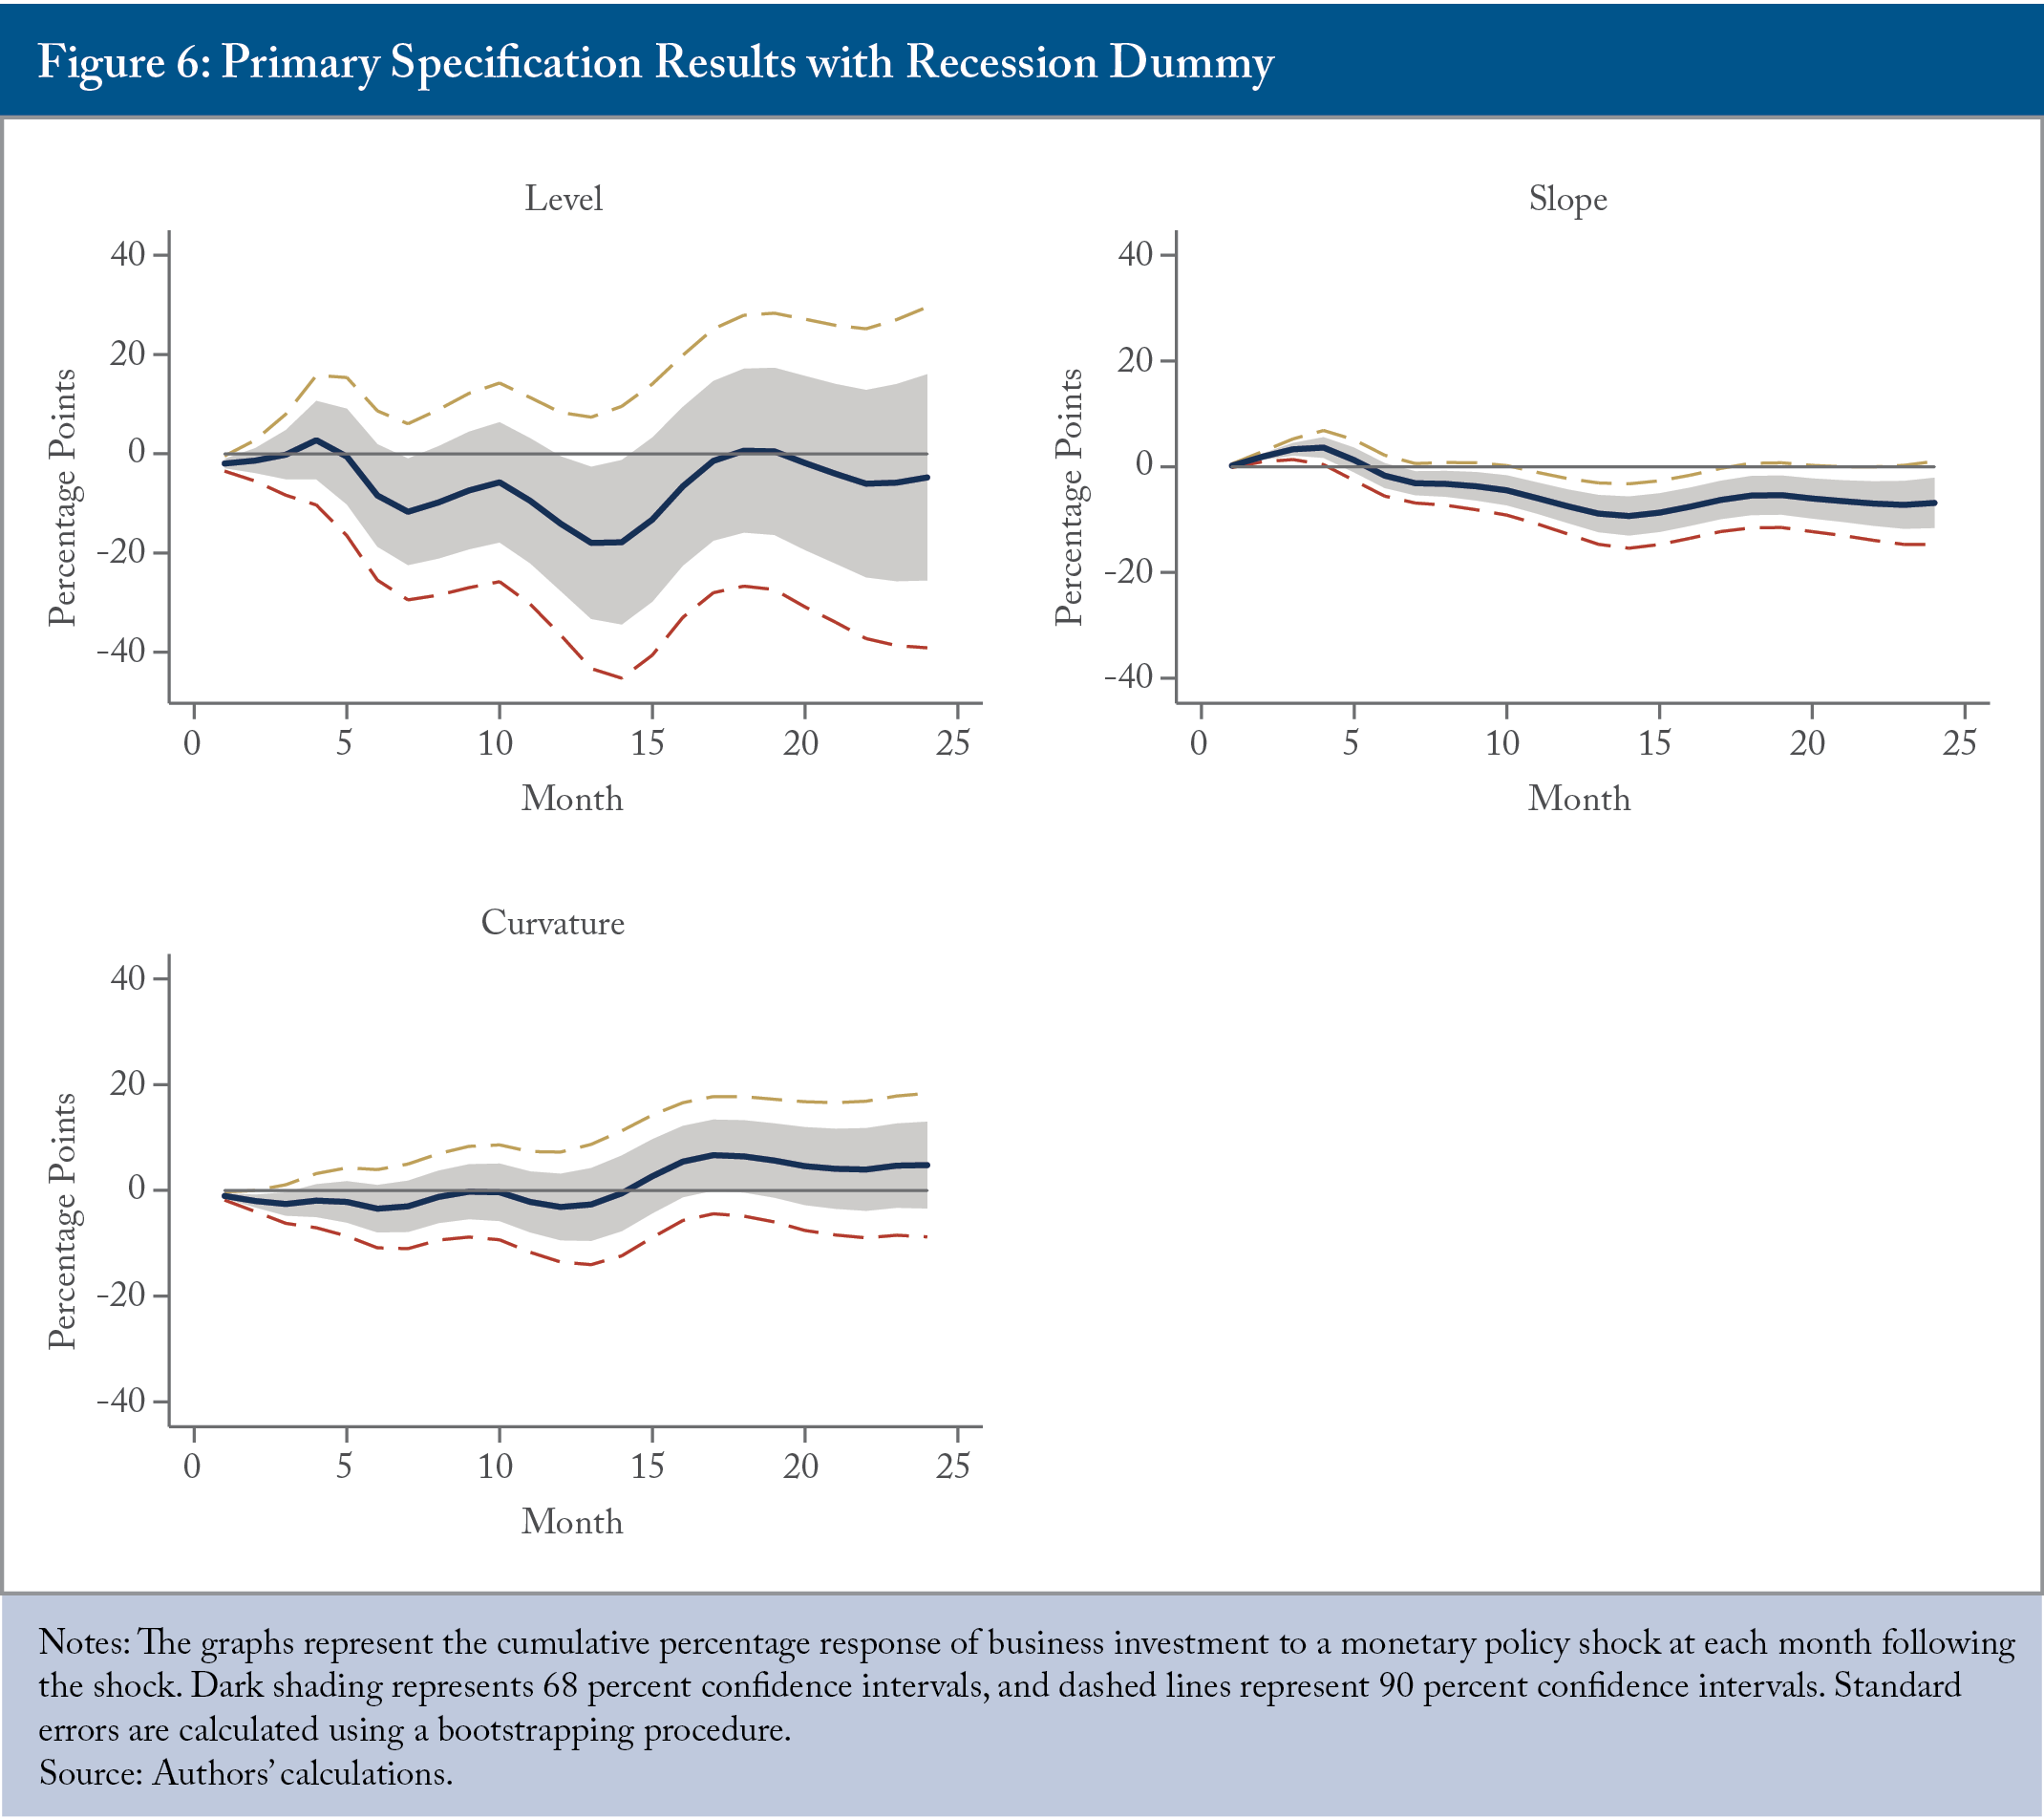
In contrast to the literature (Grob and Züllig 2024), the degree of leverage in the economy has minimal impact on monetary policy’s effect on investment. Lastly, like Peersman and Smets (2005), we find that controlling for recessionary periods, like the 2008 Great Financial Crisis and COVID-19 pandemic, matters. Specifically, it exacerbates the effect of monetary policy on investment, though, interestingly, only for the traditional slope factor; the level and curvature factors do not appear to be business-cycle sensitive.
As mentioned, COMPUSTAT data allow us to further break down the results into 10 sectors. The primary takeaway is significant heterogeneity across sectors. Some sectors move in the expected direction regardless of factor, such as finance and construction, while others, like agriculture and retail, do not. Still others, including manufacturing and transportation, show mixed responses.
Overall, the results show considerable heterogeneity in how different sectors react to monetary policy tightening and to different types of tightening. They suggest that the dynamic effects of monetary policy on aggregate investment depend on sectoral composition and the entirety of the yield curve. Since sectoral composition changes over time, this matters for the setting of monetary policy. The Bank of Canada can use these granular results to better calibrate the likely effect of monetary policy tightening on aggregate business investment, given the sectoral composition of the Canadian economy when the shock occurs and how its announcements affect the yield curve as a whole. Our results also inform policymakers concerned about the distributional implications of monetary policy across sectors.
How Monetary Policy Impacts Investment
A contractionary monetary policy shock reduces credit availability, dampens aggregate demand, and slows economic growth. An expansionary monetary policy shock does the opposite. Much of the early empirical literature tests this conventional transmission mechanism using aggregate macroeconomic data, which implicitly assumes homogeneity across sectors and overlooks potentially important asymmetries at more disaggregated levels of the economy. Understanding different sectoral responses to monetary policy shocks helps us better predict future aggregate reactions based on the structure of the economy at the time of the shock. The results provide policymakers with clearer insight into the dynamic effects of monetary policy on aggregate investment and its distributional implications across sectors.
Monetary policy affects the real economy primarily through the interest rate and credit channels. The interest rate channel operates through changes in the cost of capital, influencing interest-sensitive components of aggregate demand such as fixed investment, housing, and durable goods consumption. The credit channel amplifies these effects by altering the cost for firms to access outside capital (known as their external finance premium), which depends on their financial conditions and balance sheet strength (Bernanke and Gertler 1995). Because both channels operate through mechanisms linked to sector- and firm-specific characteristics, they naturally give rise to heterogeneous responses across industries and firms.
Sectoral heterogeneity is well documented in the interest rate channel. Industries producing durable goods tend to be more interest sensitive, in part because the demand for their products often requires debt financing. These industries, therefore, respond more strongly to monetary policy shocks (Dedola and Lippi 2005; Peersman and Smets 2005; Durante et al. 2022).
The credit channel predicts heterogeneity based on financial constraints. External finance premiums are not directly observable, but they can be inferred from firm characteristics such as size, leverage, and liquidity. Gertler and Gilchrist (1994), for example, show that small US manufacturing firms account for a disproportionately large share of output contractions following monetary tightening, consistent with greater financial vulnerability.
In contrast, Mojon et al. (2002), using data from four European countries, find that although small firms pay higher average interest rates, the interest rate premium does not react more strongly to monetary policy, and small firm investment is not significantly more sensitive to the user cost of capital than investment by larger firms. Yang et al. (2017) find that cash holdings mitigate the negative impact of monetary tightening, particularly for financially constrained firms. Similarly, Huang et al. (2012) show that firms with higher liquidity and lower leverage are less sensitive to monetary policy.
These studies emphasize the importance of balance sheet strength as a determinant of monetary transmission. However, they all rely on policy interest rates to generate monetary policy shocks. In today’s world, where central banks seek to influence the entire yield curve, this is no longer sufficient to assess how monetary policy affects economic variables like investment.
Studies that combine well-identified monetary policy shocks with US firm-level investment data offer mixed evidence regarding the firm characteristics that influence investment responses to monetary policy. Ottonello and Winberry (2020) find that firms with lower default risk exhibit stronger investment responses to monetary policy shocks, whereas Cloyne et al. (2018) document larger effects among younger firms and firms that do not distribute dividends.
Much of the early empirical work on sectoral monetary transmission focuses on the US and Europe – large economies, rather than small open economies like Canada – and relies on identifying only the short-term interest rate component of monetary policy. For example, Dale and Haldane (1995) document different responses across personal and corporate sectors in the UK. Ganley and Salmon (1997), in another UK study, analyze 24 sectors and find large and rapid output declines in construction and manufacturing but muted responses in services and utilities, with wide variation even within manufacturing. Hayo and Uhlenbrock (1999) find considerable cross-industry differences in the timing and magnitude of responses among 28 German manufacturing and mining industries.
Farès and Srour (2001) provide the only comprehensive study of Canadian sectoral responses to monetary policy to date. They analyze two forms of disaggregation: expenditure categories (consumption of goods and services, investment, government spending, imports, and exports) and production sectors (primary, construction, manufacturing, business services, and government). They find that, following monetary tightening, non-residential structures investment contracts first, but the decline is relatively small and recovers quickly. In contrast, both machinery and equipment and housing investment reach their troughs after about five quarters, with housing showing a much larger decline and evidence of a secondary cycle (a second drop). On the production side, construction responds earliest, while manufacturing experiences the largest cumulative effect. Farès and Srour (2001) note the limitations of using final expenditure data to infer production-side responses and suggest deeper industry-level disaggregation as a promising avenue – something we do in this study. We are also able to update their study for a much longer period during Canada’s inflation-targeting era, and with a more thorough monetary policy shock series.
Finally, financial crises can alter the strength of monetary transmission. But the evidence is mixed. Peersman and Smets (2005) find that monetary policy has stronger real effects during recessions than during expansions, consistent with heightened sensitivity of the external finance premium when firm net worth deteriorates. By contrast, Tenreyro and Thwaites (2016) find that monetary policy is less powerful during recessions, driven by a weaker response in durable-goods spending and business investment. To account for changes in transmission strength, we incorporate financial crisis and COVID-19 pandemic dummy variables into our empirical specification to assess how extraordinary economic conditions shape the relationship between monetary policy and firm investment.
With that context in mind, we now turn to the data, methodology, and results.
Data
We begin by updating the state-of-the-art monetary policy shock data from Koeppl, Kronick, and McNeil (2024), which account for both conventional and unconventional monetary policy – a must in today’s world where central banks seek to influence not just the overnight rate but the entire yield curve. Our well-identified shocks ensure that the effects captured in the analysis reflect exogenous variations in monetary policy, not other macroeconomic factors.
In their original study, the authors first compile a new list of monetary policy events for Canada. Their novel dataset includes not only scheduled and unscheduled policy changes, but also speeches by the Bank of Canada governor and other senior officials. They then use the Nelson-Siegel term structure framework and yield curve for government bond data – not just a single short-term rate, but across durations from three months to 30 years – on dates related to these monetary policy events to construct three latent factors: level, slope, and curvature.
The level factor can be thought of as moving the entire yield curve up or down. The slope factor represents changes at shorter frequencies and resembles the more traditional monetary policy shock variable. The curvature factor captures changes in medium-term interest rates. The changes in these factors are then used as our independent variables. Koeppl, Kronick, and McNeil (2024) show that the central bank affects yields along the curve through both its fixed announcement dates and speeches by senior personnel.
Our dependent variable of interest is private-sector business investment. We focus first on aggregate business investment data from Statistics Canada – gross fixed capital formation (real and seasonally adjusted) – because business investment contributes to aggregate demand and inflation, the latter being the Bank’s variable of interest. Our monetary policy shock data are monthly, while our business investment data are quarterly. We interpolate the latter to create a monthly series.1010 We use the Denton method of interpolation, which is expanded on in greater detail in Bloem et al. (2001).
We then drill down into the business investment data, looking at the three main types: structures, M&E, and IP. Within structures, we examine residential and non-residential investment for structures, and within IP, we examine R&D and software. M&E was dominated by industrial M&E, so there was no value in breaking it down further. All data are from Statistics Canada.
We also use COMPUSTAT data for 10 NAICS-based sectors: agriculture, mining, utilities, construction, manufacturing, retail, transportation, finance, real estate, and services. The data are nominal, so we convert them into real, seasonally adjusted series. These data are also quarterly, so we interpolate them to create monthly series.
Our sample period for the Statistics Canada data runs from January 1997 to September 2025, yielding 345 monthly observations (our COMPUSTAT sample ends in December 2023). Table 1 presents summary statistics for the three factors – level, slope, and curvature. The mean of each shock is essentially zero over the sample period. This is a nice feature in that it indicates the sample is long enough to include approximately equal magnitudes of expansionary and contractionary monetary policy shocks.
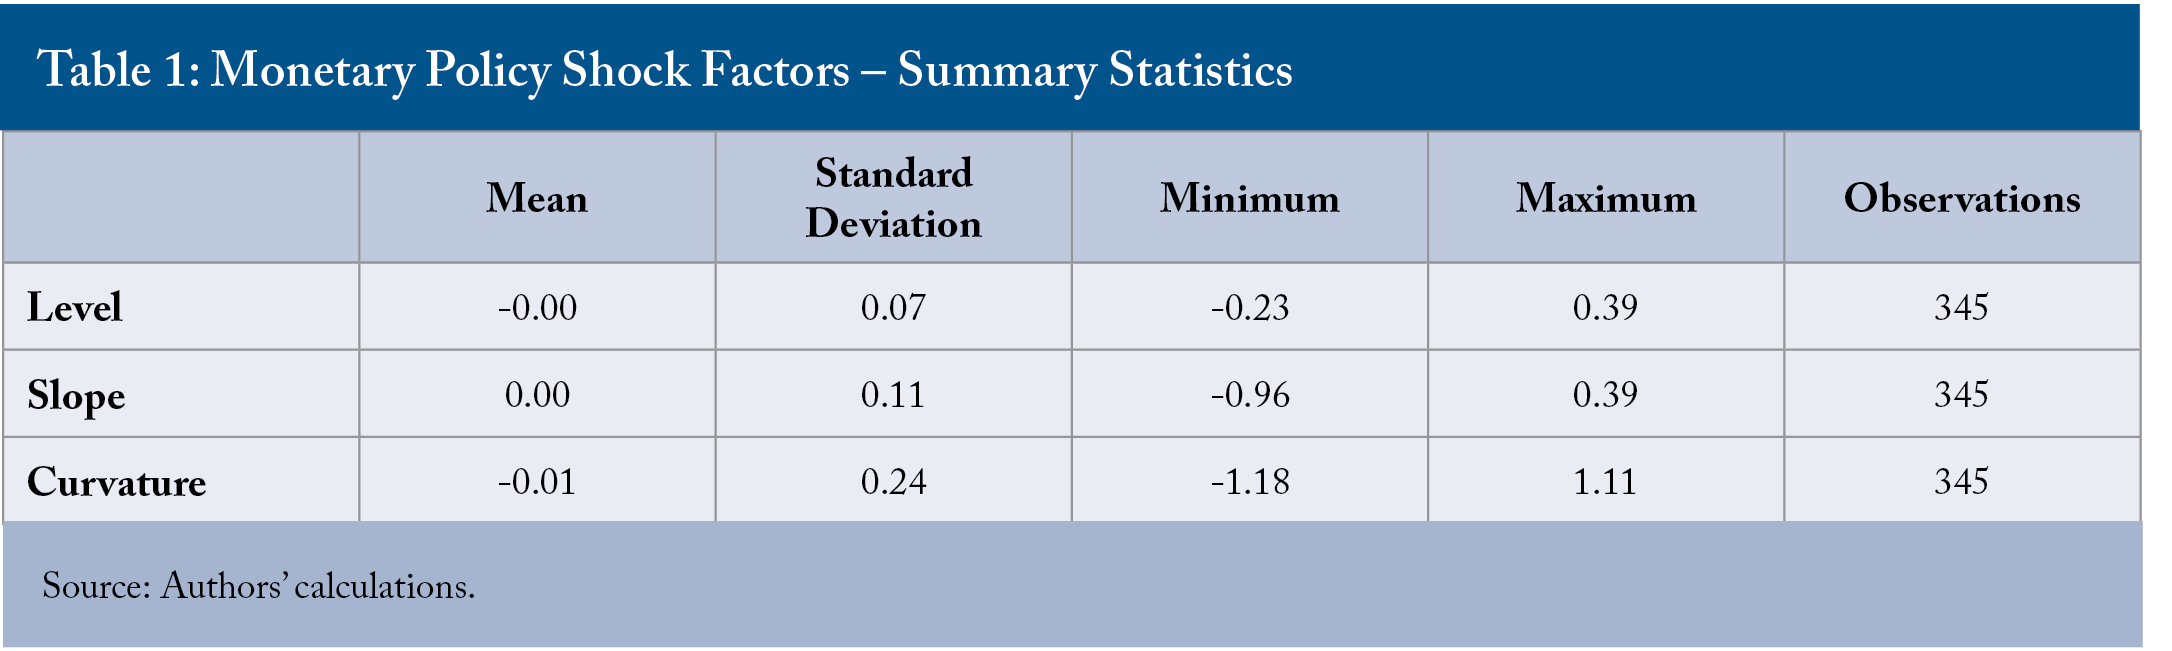
The curvature shock is considerably more volatile than the other two factors. However, this does not necessarily mean that curvature shocks have a greater effect, because each shock is scaled by its relevant loading factor, as discussed in Box 1 and in greater detail by Koeppl, Kronick, and McNeil (2024). The loading factors are larger for the level and slope shocks. For our purposes, we normalize each factor shock, after scaling it by its loading factor, to 25 basis points.
We discuss control variables in our methodology section, which we turn to next.
Methodology
We use local projections to analyze monetary policy’s effect on business investment (Jordà 2005). The basic idea behind local projections is that they estimate separate regressions at each forward-looking horizon to generate impulse-response functions showing how one variable affects another at different moments in time. Local projections have advantages over similar methodologies because their results are less sensitive to the number of lags used. This is an important feature because lags help address the endogeneity concerns discussed above, specifically the reverse causality between interest rates and other macroeconomic variables. They also provide greater flexibility in selecting control variables, always an advantage in regression analysis.
We use the same setup as Koeppl, Kronick, and McNeil (2024):

where yt is the logarithm of business investment, the changes in βi are the different factors that make up the monetary policy shock series (level, slope, and curvature, respectively), and the Xt−1 are the control variables, which we describe below. Using differences in business investment allows the α coefficients to be interpreted as the cumulative impact of a monetary policy shock on the business investment variable h periods after the shock happens.
We also follow Koeppl, Kronick, and McNeil (2024) in selecting our control variables, using 12 lags of inflation, real GDP growth, the Bank Rate, commodity price inflation, the unemployment rate, inflation expectations (proxied by the difference between long-term Government of Canada bonds and 30-year real-return bonds), the shock series, and the dependent variable, business investment growth.1111 We also run a robustness check where we control for the US economy (using the monthly industrial production index) and find no change to the results. For parsimony, we leave that variable out of our main specification.
Lastly, we cannot use typical standard errors because the shock series variable is itself an estimate, and a regular regression would not account for its variance (Pagan 1984). We instead use what are called bootstrapped standard errors, which estimate uncertainty by repeatedly recalculating the results using many slightly reshuffled versions of the same data and measuring how much they vary (Efron 1979).1212 For our purposes, we use a wild cluster bootstrap standard errors procedure. See Cameron et al. (2008) for more.
Results
In our primary specification, using aggregate business investment data from Statistics Canada, specifically gross fixed capital formation, we run regression (1). We find that monetary policy tightening across each factor – level, slope, and curvature – causes business investment to fall, consistent with economic theory (Figure 1). The effects, however, are significant only for shocks to the level (entire yield curve) and slope (shorter duration part of the curve) factors. We remind readers that the local projections we run are symmetric, meaning the results for expansionary monetary policy would simply be the reverse of what we present for the tightening case.

The effects are quite large in magnitude, though this reflects the volatility of the investment data and the fact that the link between the shock and actual changes in interest rates – because of the loading factors, as described above – is not one-to-one.1313 We would note, however, that a stronger response from investment relative to other parts of the economy is consistent with Farès and Srour (2001). What is critical is the direction, which is consistent with theory. The level factor has the greatest statistically significant effect, which is not surprising because it shifts the entire yield curve. The slope factor has the next largest significant effect, while the curvature factor has the smallest impact and is statistically insignificant.1414 As a robustness check, we stopped the analysis at the pre-2014 oil price shock and pre-COVID-19. We find largely similar results, though with slight differences: a stronger level factor effect (in the pre-oil price shock period), more periods of insignificance from the slope factor (in both periods), and some significance (though still of small magnitude) from the curvature factor (in the pre-oil price shock period). Still, these differences do not change our overall conclusions.
We then examine the components of the aggregate business investment measure. We start with structures, M&E, and IP investment. Ex ante, our hypothesis is that structures and M&E are more interest-sensitive than IP, although this is more a matter of degree than overall direction. For structures, residential investment is highly interest-sensitive as demand for housing moves up and down with mortgage costs, and the development of both residential and non-residential structures is affected by borrowing costs. Similarly, for M&E, companies will often finance or lease big investments in machinery and equipment, making them interest-sensitive as well. As we discussed earlier, firms that produce durable goods tend to be more interest-sensitive (Dedola and Lippi 2005; Peersman and Smets 2005; Durante et al. 2022). Lastly, as Crouzet and Eberly (2019) show, intangible capital, which has increased with the rise in the importance of IP, is “less interest-sensitive and less collateralizable than physical capital, potentially weakening transmission mechanisms.”1515 We acknowledge that tech firms have been able to achieve significant growth despite low/no profits, in part because of low interest rates, which might imply a stronger effect of monetary policy on IP investment than the literature suggests.
Regardless of investment type, we see qualitatively similar results to those for overall business investment. Namely, the level and slope factors have a significant impact on the different categories of investment and, in terms of magnitude, are the largest, while the curvature factor has very little, if any, significance (Figure 2).
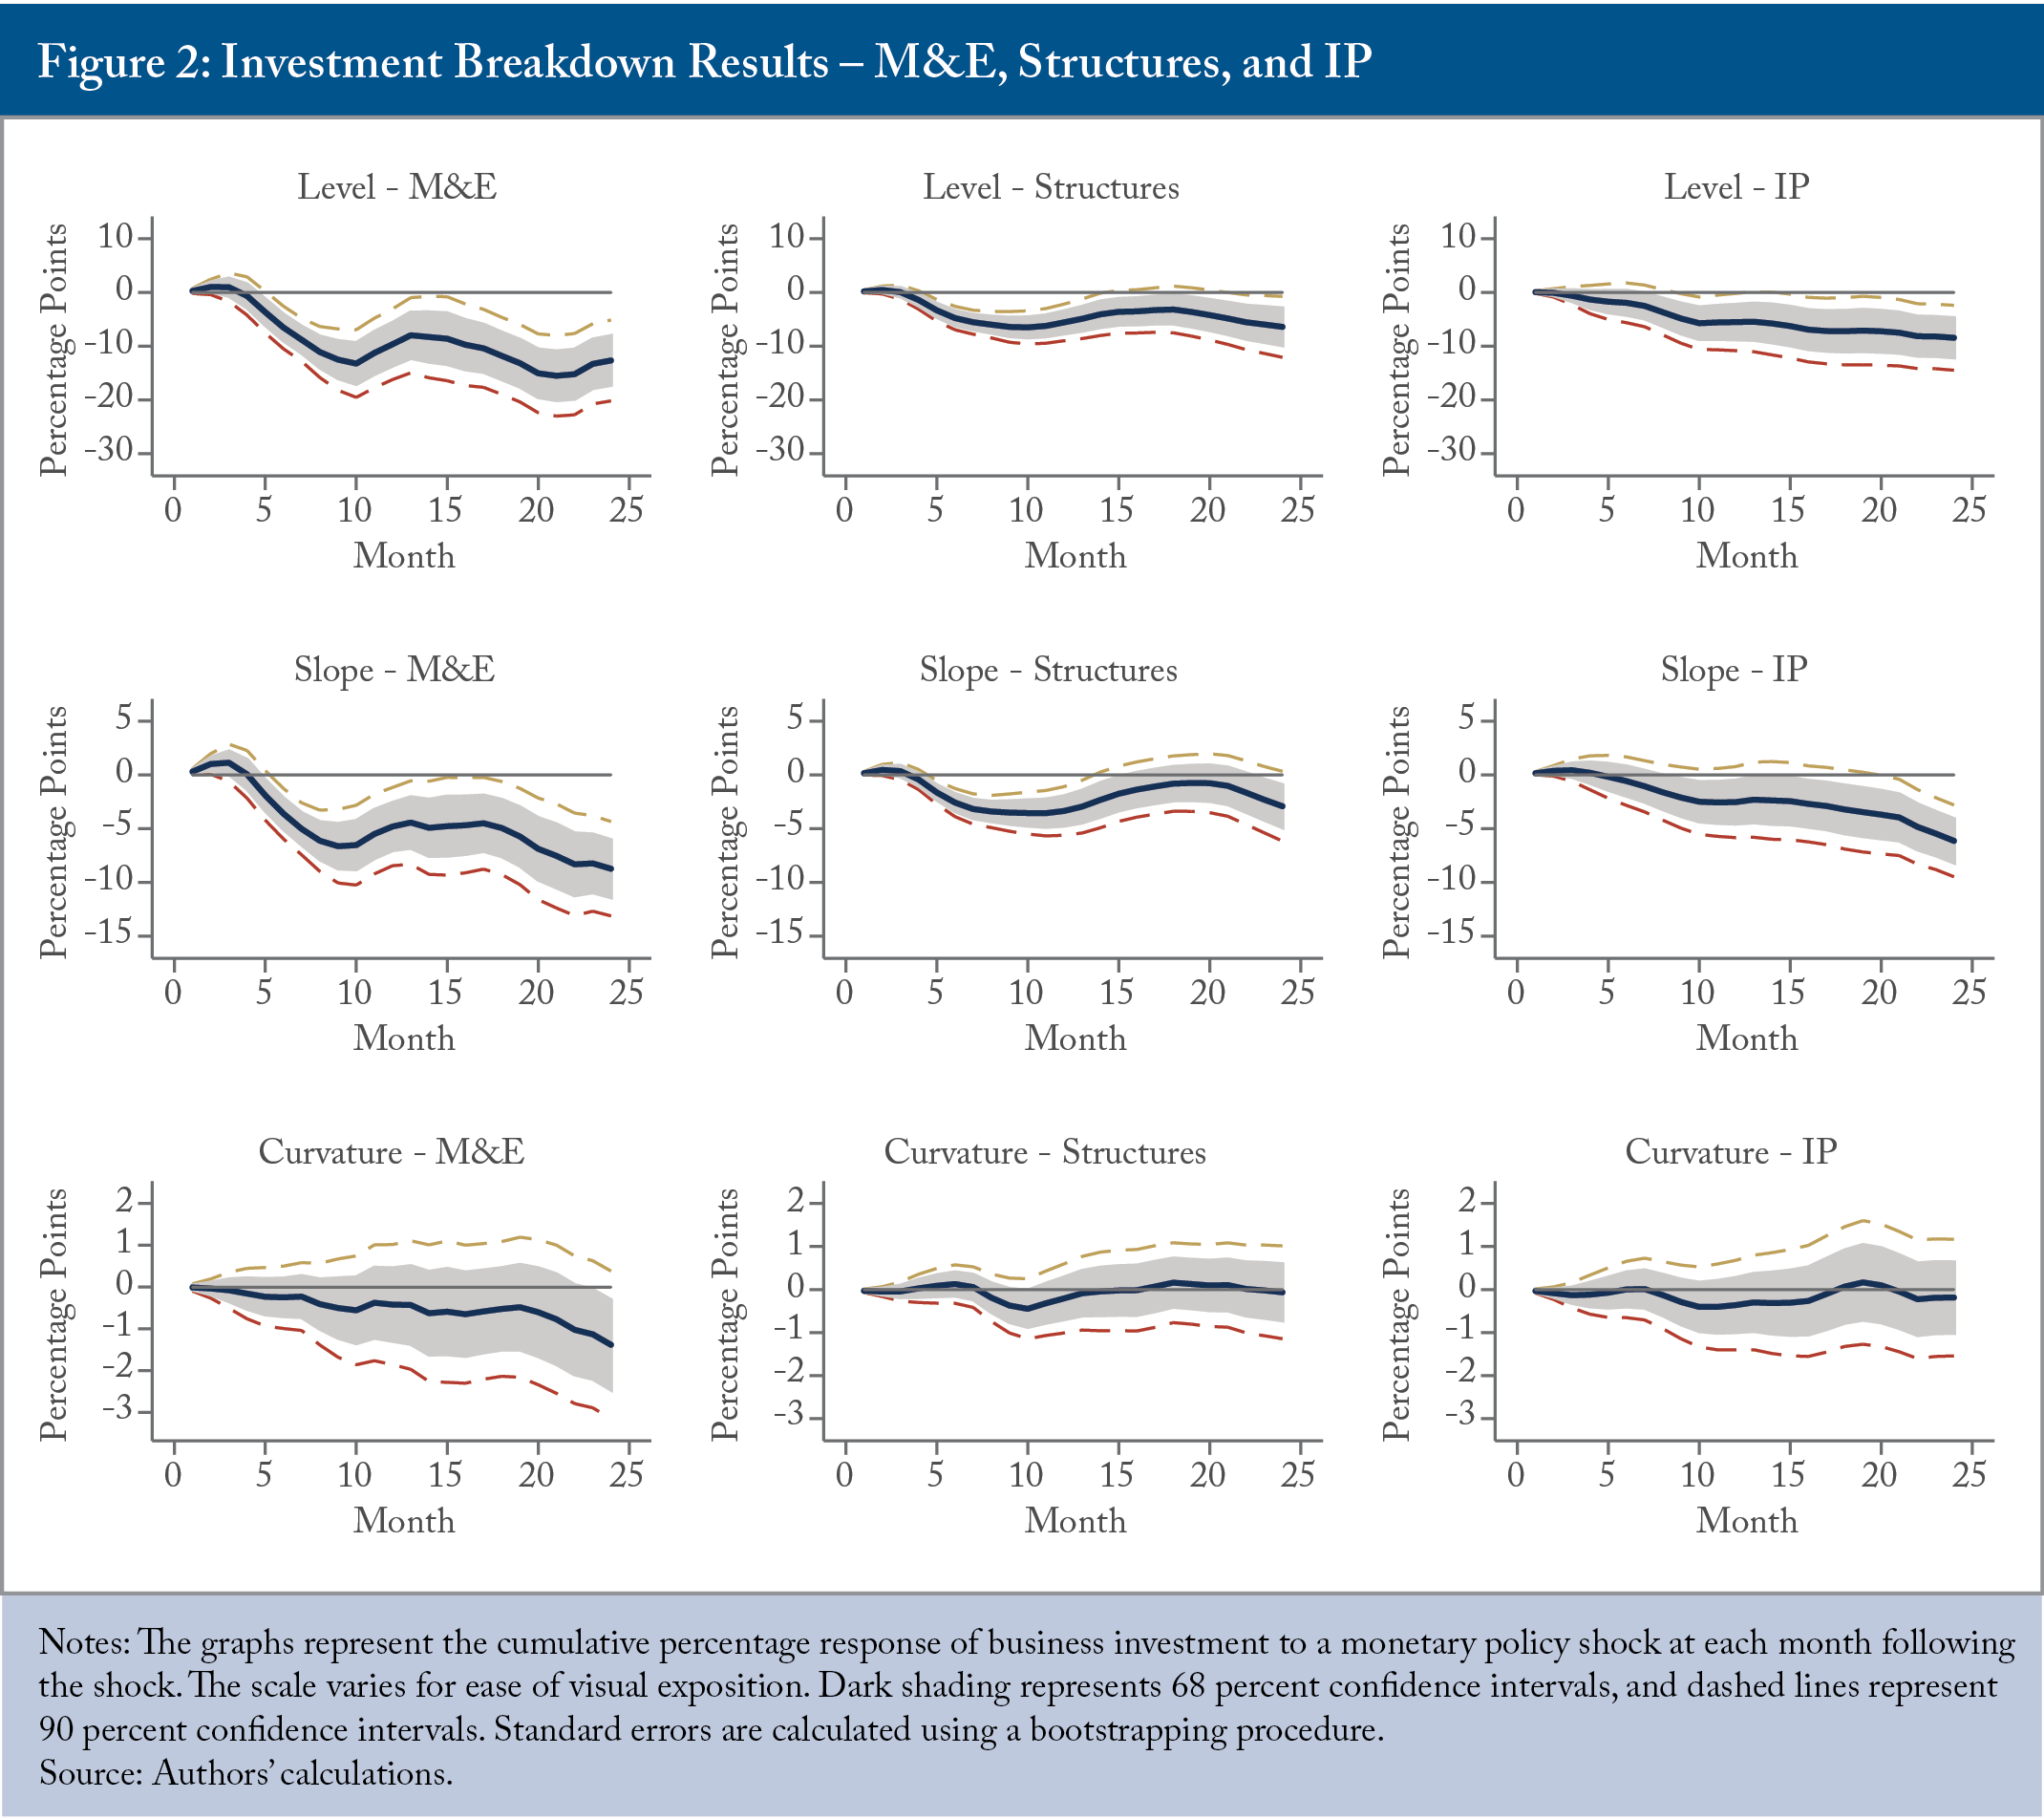
Drilling down further (Figure 2, again), the results match our ex ante hypotheses. Focusing on the level and slope shocks (where we have significance), both M&E and structures are impacted most significantly at the 90 percent confidence interval by monetary policy tightening, with the former experiencing a larger effect in magnitude than the latter. IP also shows significant effects, though less clearly at higher levels of significance. Significance also tends to occur later for IP (at least at the 90 percent level), where one would have less confidence in those results. In each case, the level shock has a greater impact than the slope shock, driven by the shifts in the entire curve.
We are able to get more granular within these main categories. For structures, for example, we can distinguish between residential and non-residential structures.
The results we found earlier for structures investment following a monetary policy tightening – namely, significance of the level and slope factors, and none for the curvature factor (column 1 of Figure 3) – are driven mainly by the residential sector, which demonstrates the same pattern as overall structures investment (column 2 of Figure 3). We also find significance for non-residential structures in response to the level and slope factors (column 3 of Figure 3) in the expected direction (and sometimes with a larger point estimate), though at a lower confidence level and/or with a longer lag (the curvature factor response goes in an unexpected direction). One possible explanation for the more consistently significant effect for residential structures is that it is easier to stop spending on a housing development than on a new pipeline or commercial building.
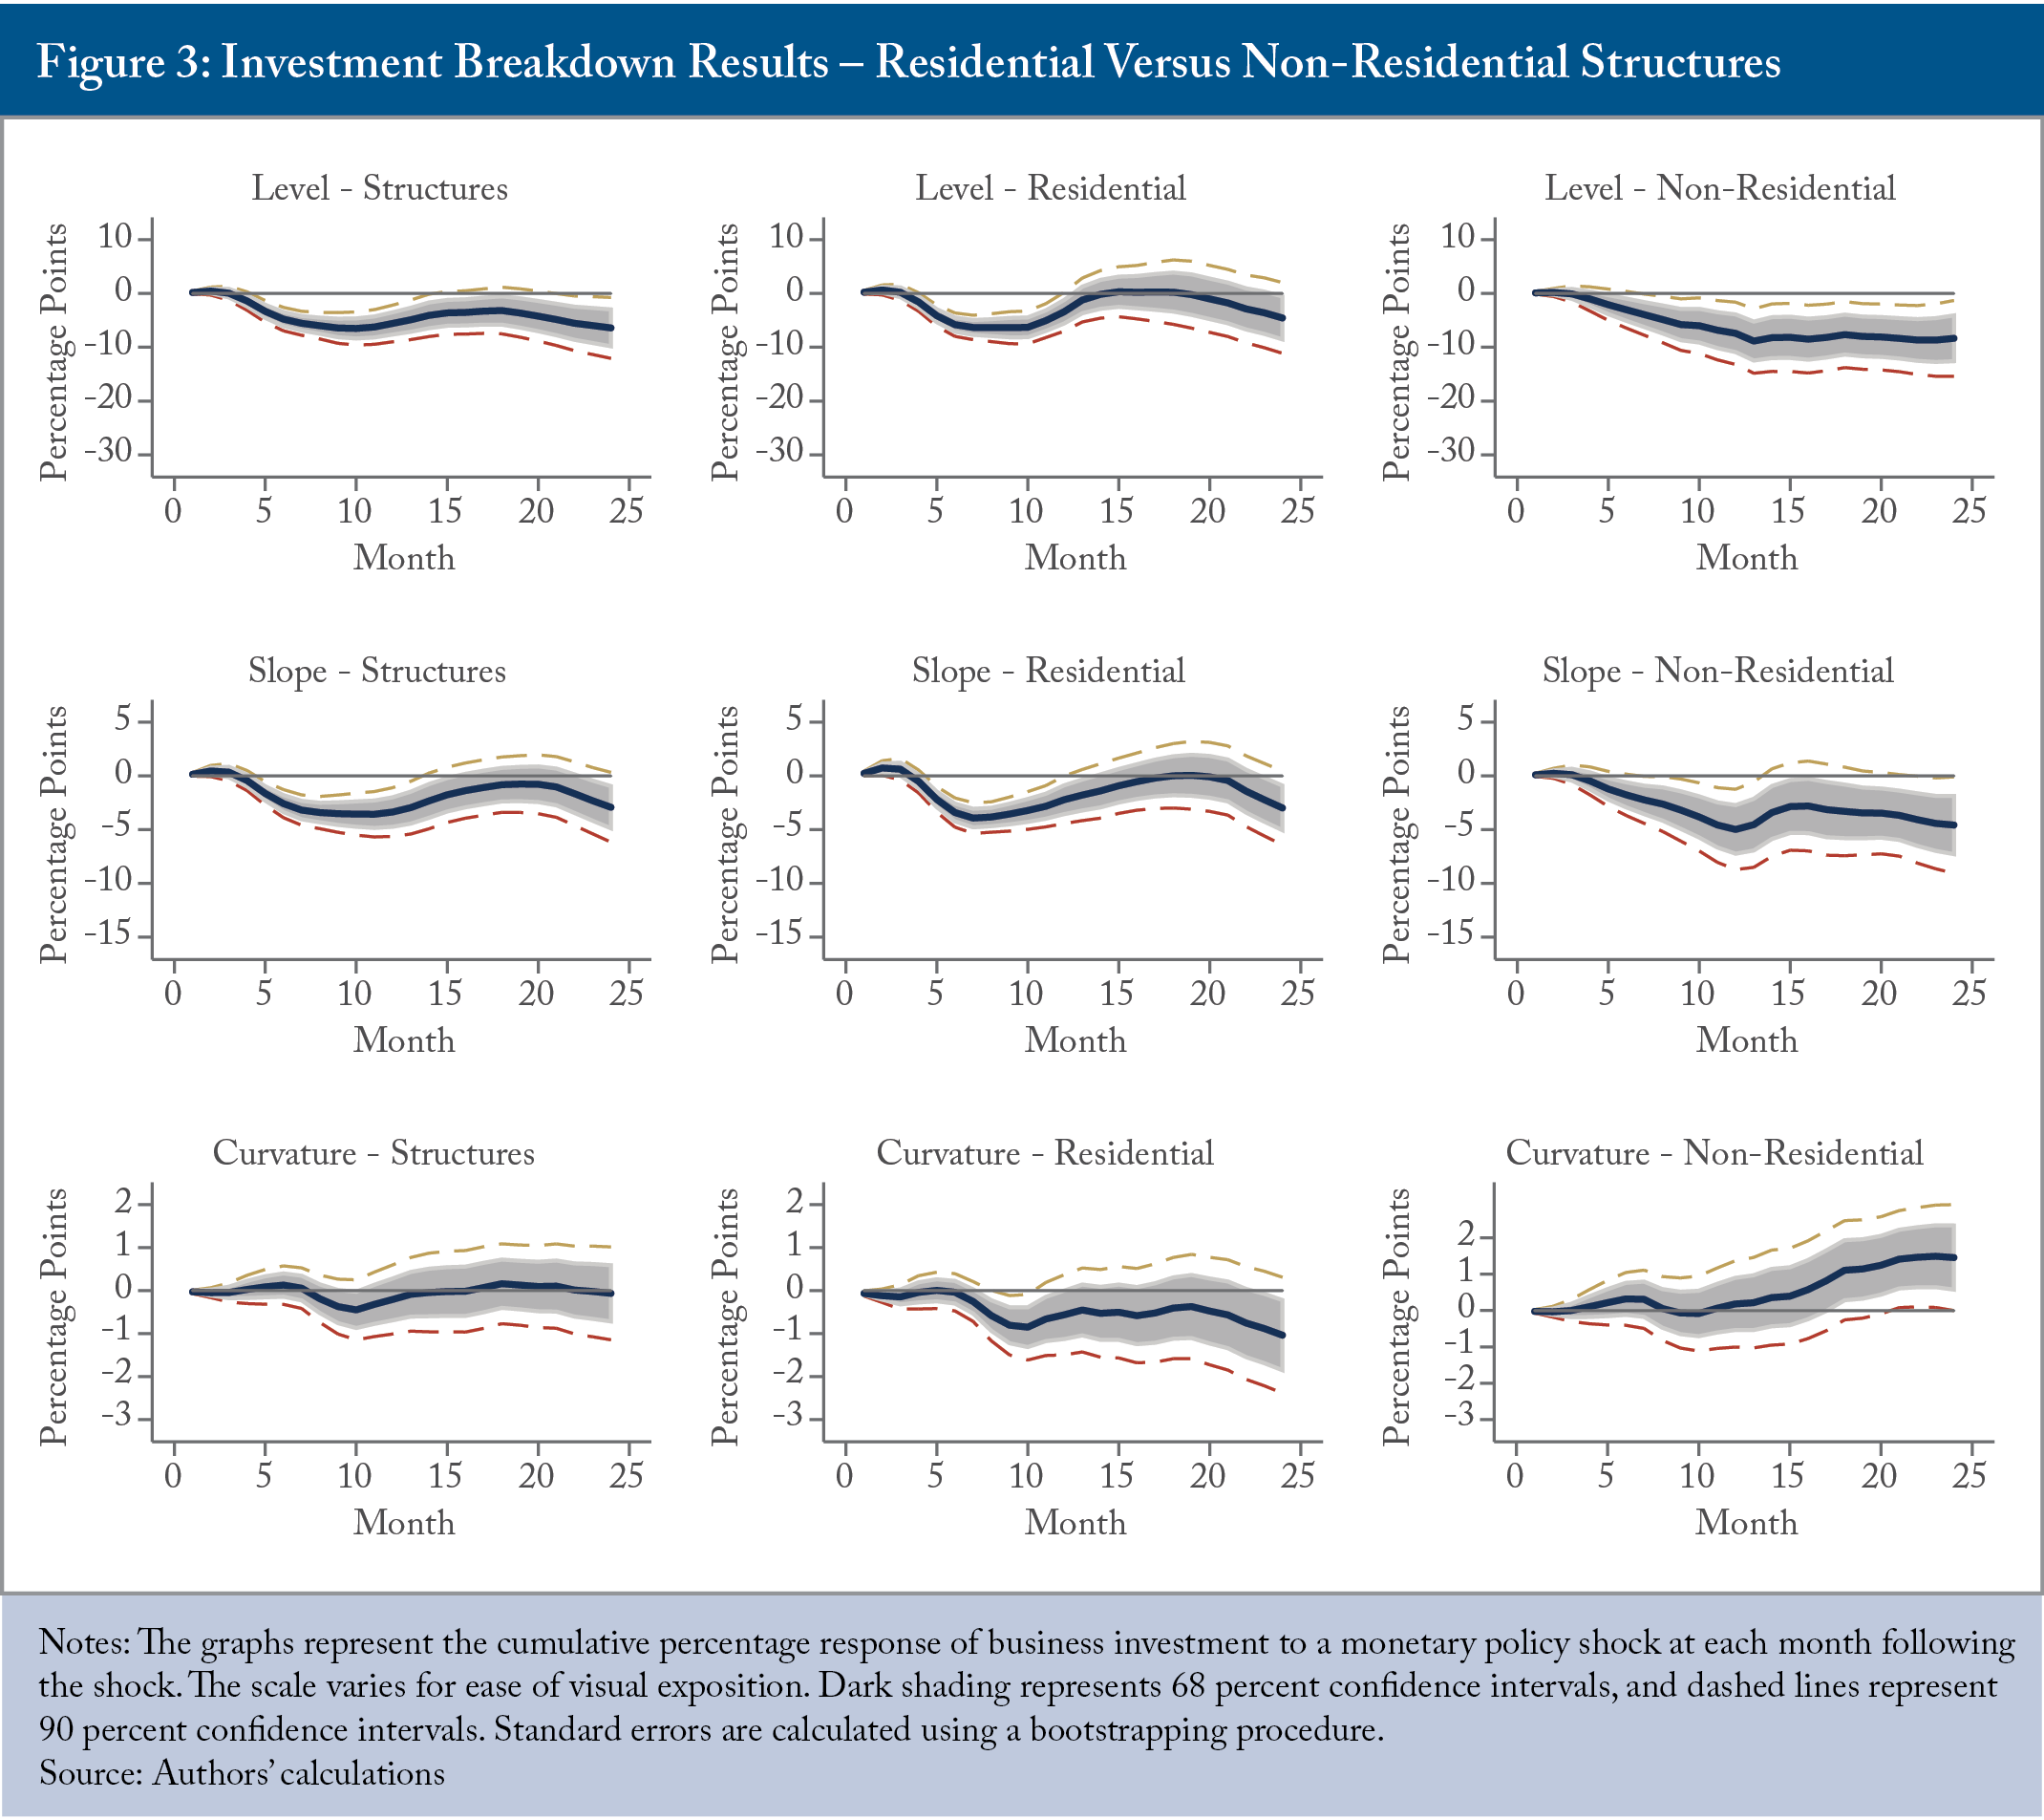
Our results differ from Farès and Srour (2001) in that we find residential structure investment responds first to a monetary policy shock, whereas they find non-residential structure investment reacts first, though they deem their result surprising as the latter form of construction typically operates with an implementation lag following a shock.
As discussed earlier, aggregate IP investment shows weaker significance than structures and M&E when facing a monetary policy shock, consistent with the work of Crouzet and Eberly (2019). However, others, including Ma and Zimmermann (2023), document that monetary policy can have a substantial impact on innovation activity by influencing aggregate demand, expected profitability, and financial market conditions. We, therefore, break down IP investment into its major components, namely R&D and software, to see whether significance increases at the granular level.
The level factor was most significant for IP, and this result is largely driven by R&D investment (Figure 4). These results are consistent with Ma and Zimmermann (2023), who find a significant decline in R&D investment following a monetary policy tightening. Interestingly, although the curvature factor has little significance on aggregate IP investment, some effects emerge at a more granular level, particularly a decline in software investment (column 3 of Figure 4). One possible explanation for this latter result comes from Döttling and Ratnovski (2023), who show that firms facing higher adjustment costs – such as those with a large share of high-skilled labour – respond more strongly to monetary policy. Firms investing in software rely heavily on specialized human capital, for which hiring and separation are costly and time-consuming. This interpretation is consistent with Kim and Kung (2017), who find that firms with fewer redeployable assets, such as those dependent on skilled human capital, are more sensitive to economic shocks.

Another possible explanation is that medium-term interest rates have a larger effect on software investment because of the time it takes for software companies to become profitable. Higher interest rates raise discount rates, thereby lowering firms’ net-present values. Medium-term interest rates matter more for the net-present values of firms whose projected cash flows occur largely in the future.
Grob and Züllig (2024) argue that leverage is important in determining how much investment will react to a monetary policy shock. Looking at the United States, they find that, “When the average firm has lower leverage and, therefore, reduces its investment demand more strongly after a contractionary shock,1616 This is because a lower-leveraged firm needs less debt and is, therefore, less likely to take it on when interest rates rise. A more constrained firm has less of a choice. the price of capital declines sharply, which incentivizes all firms regardless of their leverage to invest relatively more, muting the aggregate decline of investment.” For our purposes, we ask whether leverage in the Canadian context has any impact on business investment at the aggregate level.
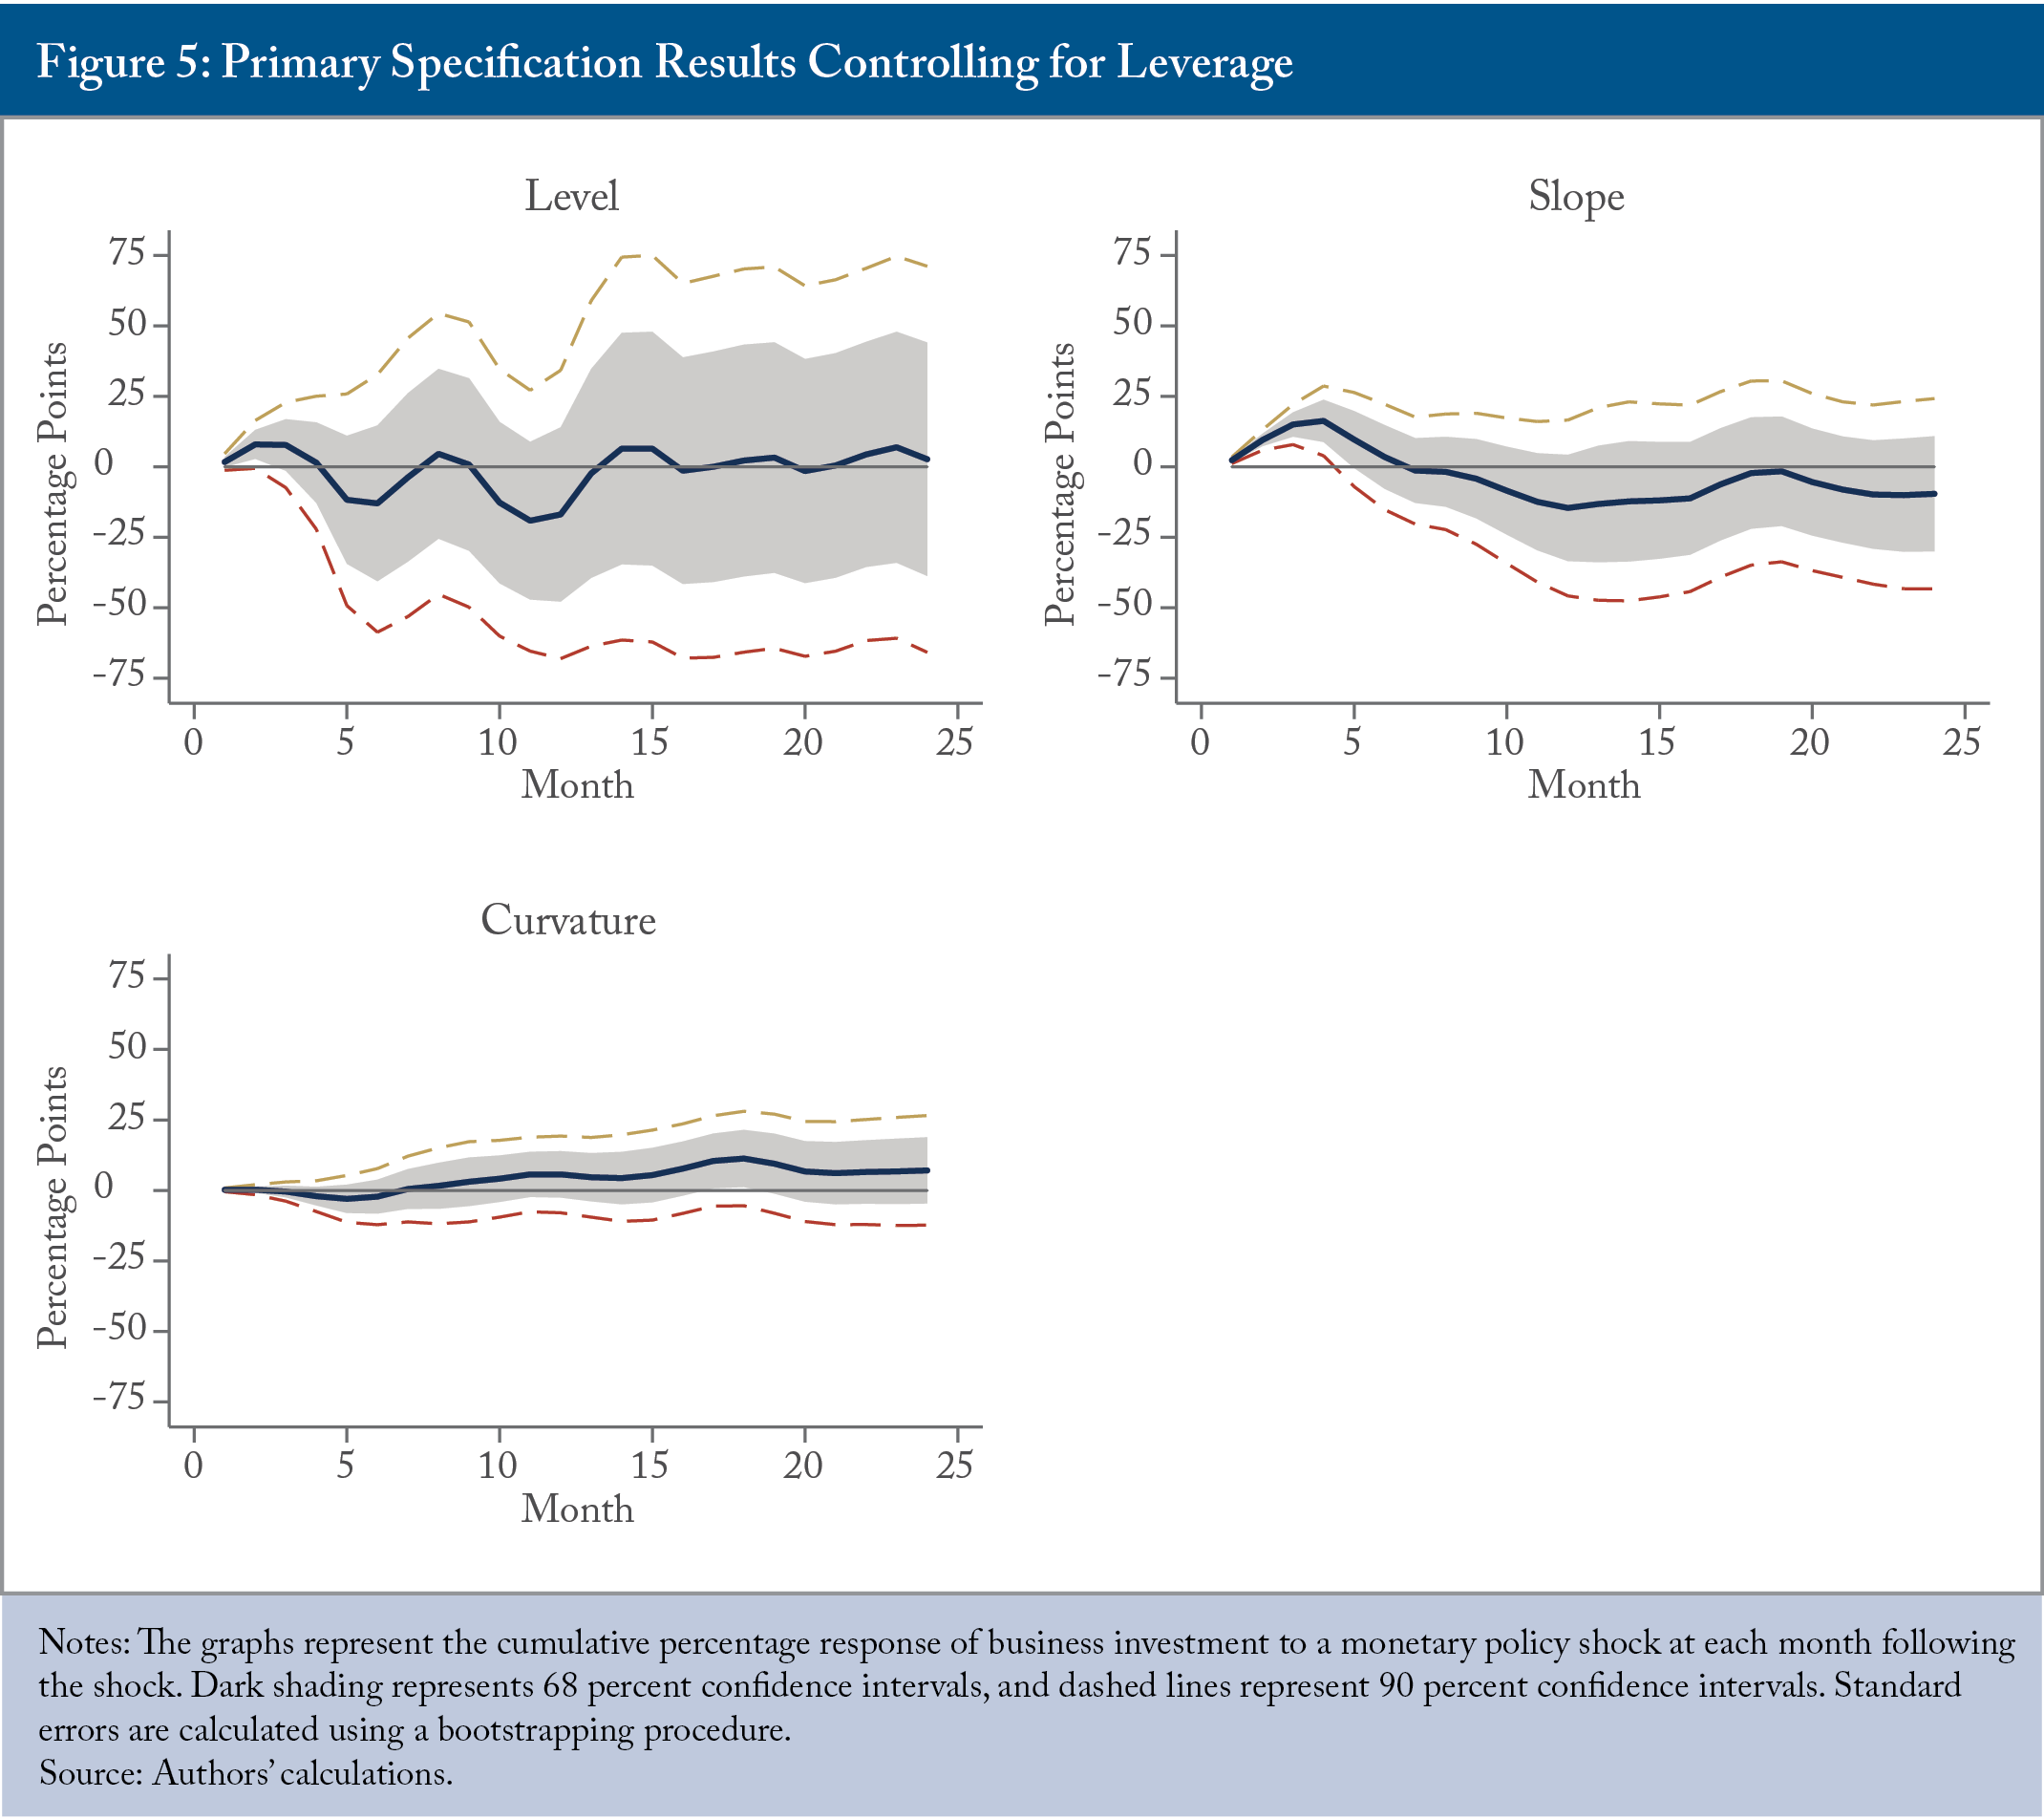
We create an interaction term between leverage and the factors that make up our monetary policy shock and add it to equation (1). If aggregate leverage plays a significant role, we would expect investment to respond significantly to the interaction term. As Figure 5 shows, the slope factor significantly dampens the decline in investment following a monetary policy tightening (i.e., investment from the interaction term increases). This effect disappears quickly, and its insignificance coincides with the significant drop associated with the slope factor in the baseline results (Figure 1). For the level and curvature factors, the results do not differ significantly from the baseline. Overall, we conclude that leverage has only a minimal impact at the aggregate level on how monetary policy affects business investment. One explanation for this largely insignificant result is that leverage varies too little over our sample period to materially affect investment responses to a monetary policy shock.1717 Leverage over our period under analysis ranges from 0.78 to 1.14, with an average of 0.99 and a standard deviation of 0.07. We changed the definition of leverage as a robustness check to include a smaller portion of financial liabilities, which generated little change in the results.
Lastly, we add interaction dummies for both the Great Financial Crisis (recession from November 2008 to May 2009, as per the C.D. Howe Institute’s Business Cycle Council)1818 See: C.D. Howe Institute. 2026. “Business Cycle Council.” https://cdhowe.org/council/business-cycle-council/. In Canada, the Institute’s Business Cycle Council is widely recognized as the country’s recession-dating authority. and the pandemic (recession from March through April 2020, also per the C.D. Howe Institute’s Business Cycle Council) periods. Figure 6 shows the interaction term following the monetary policy shock, which is a way of seeing whether the results differ significantly with and without the recession dummy. Our results are similar to those of Peersman and Smets (2005), specifically for the slope factor (which has historically been the focus of the monetary policy shock literature), showing an exacerbated impact of monetary policy on aggregate investment during recessionary periods. However, the level and curvature factors have little to no significance, consistent with Tenreyro and Thwaites (2016), suggesting that the aggregate investment responses to these factors do not change based on the stage of the business cycle. Overall, the evidence is mixed on whether recessions affect how monetary policy impacts investment.1919 We also do a robustness check where we simply dummy out the Great Financial Crisis and pandemic periods to see if the main results change. They do not.
Industry Results
Figures 7 through 9 show how investment across our 10 NAICS-based sectors (and in the aggregate) respond to monetary policy shocks driven by our three factors.2020 We also run this exercise using quarterly data since we do not then have to interpolate the business investment data. While there were some individual differences depending on the factor, the overall conclusion of heterogeneity in sectoral responses to monetary policy shocks remains the same. We observe substantial heterogeneity. For the level factor, transportation, services, real estate, mining, manufacturing, finance, and construction move as expected (i.e., they fall following a monetary policy tightening), with varying degrees of statistical significance and magnitude. In contrast, retail, agriculture, and (to a lesser extent) utilities do not respond in the expected direction. Possible explanations for the latter results include difficulties stopping investment quickly (for example, in utilities), sensitivity to commodity prices (particularly in agriculture), or retail investment that relies more on incremental projects, such as store refurbishments, that can be financed more easily internally and are therefore less sensitive to interest rates.2121 On the retail point, Lei (2025) argues that such firms have shorter investment cycles and lower capital requirements. Meanwhile, Gilchrist and Zakrajsek (2012) make the case that investment responses to monetary policy are highly heterogeneous and depend on firms’ exposure to external finance and capital intensity.

The contraction in the finance sector remains strong even after two years. One explanation is the link between consumers’ sensitivity to higher interest rates and their effect on credit demand, which then leads to less investment in the finance sector itself. From a policy perspective, this suggests that policymakers may need to monitor finance-sector dynamics closely, since monetary policy-induced contractions might lead to prolonged reductions in credit creation and, in turn, further weaken real economic activity.
For the slope factor, transportation (with a lag), services, real estate, mining, finance, and construction are directionally consistent with theoretical predictions, again with varying degrees of significance and magnitude. However, retail, manufacturing, and agriculture are not. Utilities are a mixed bag.
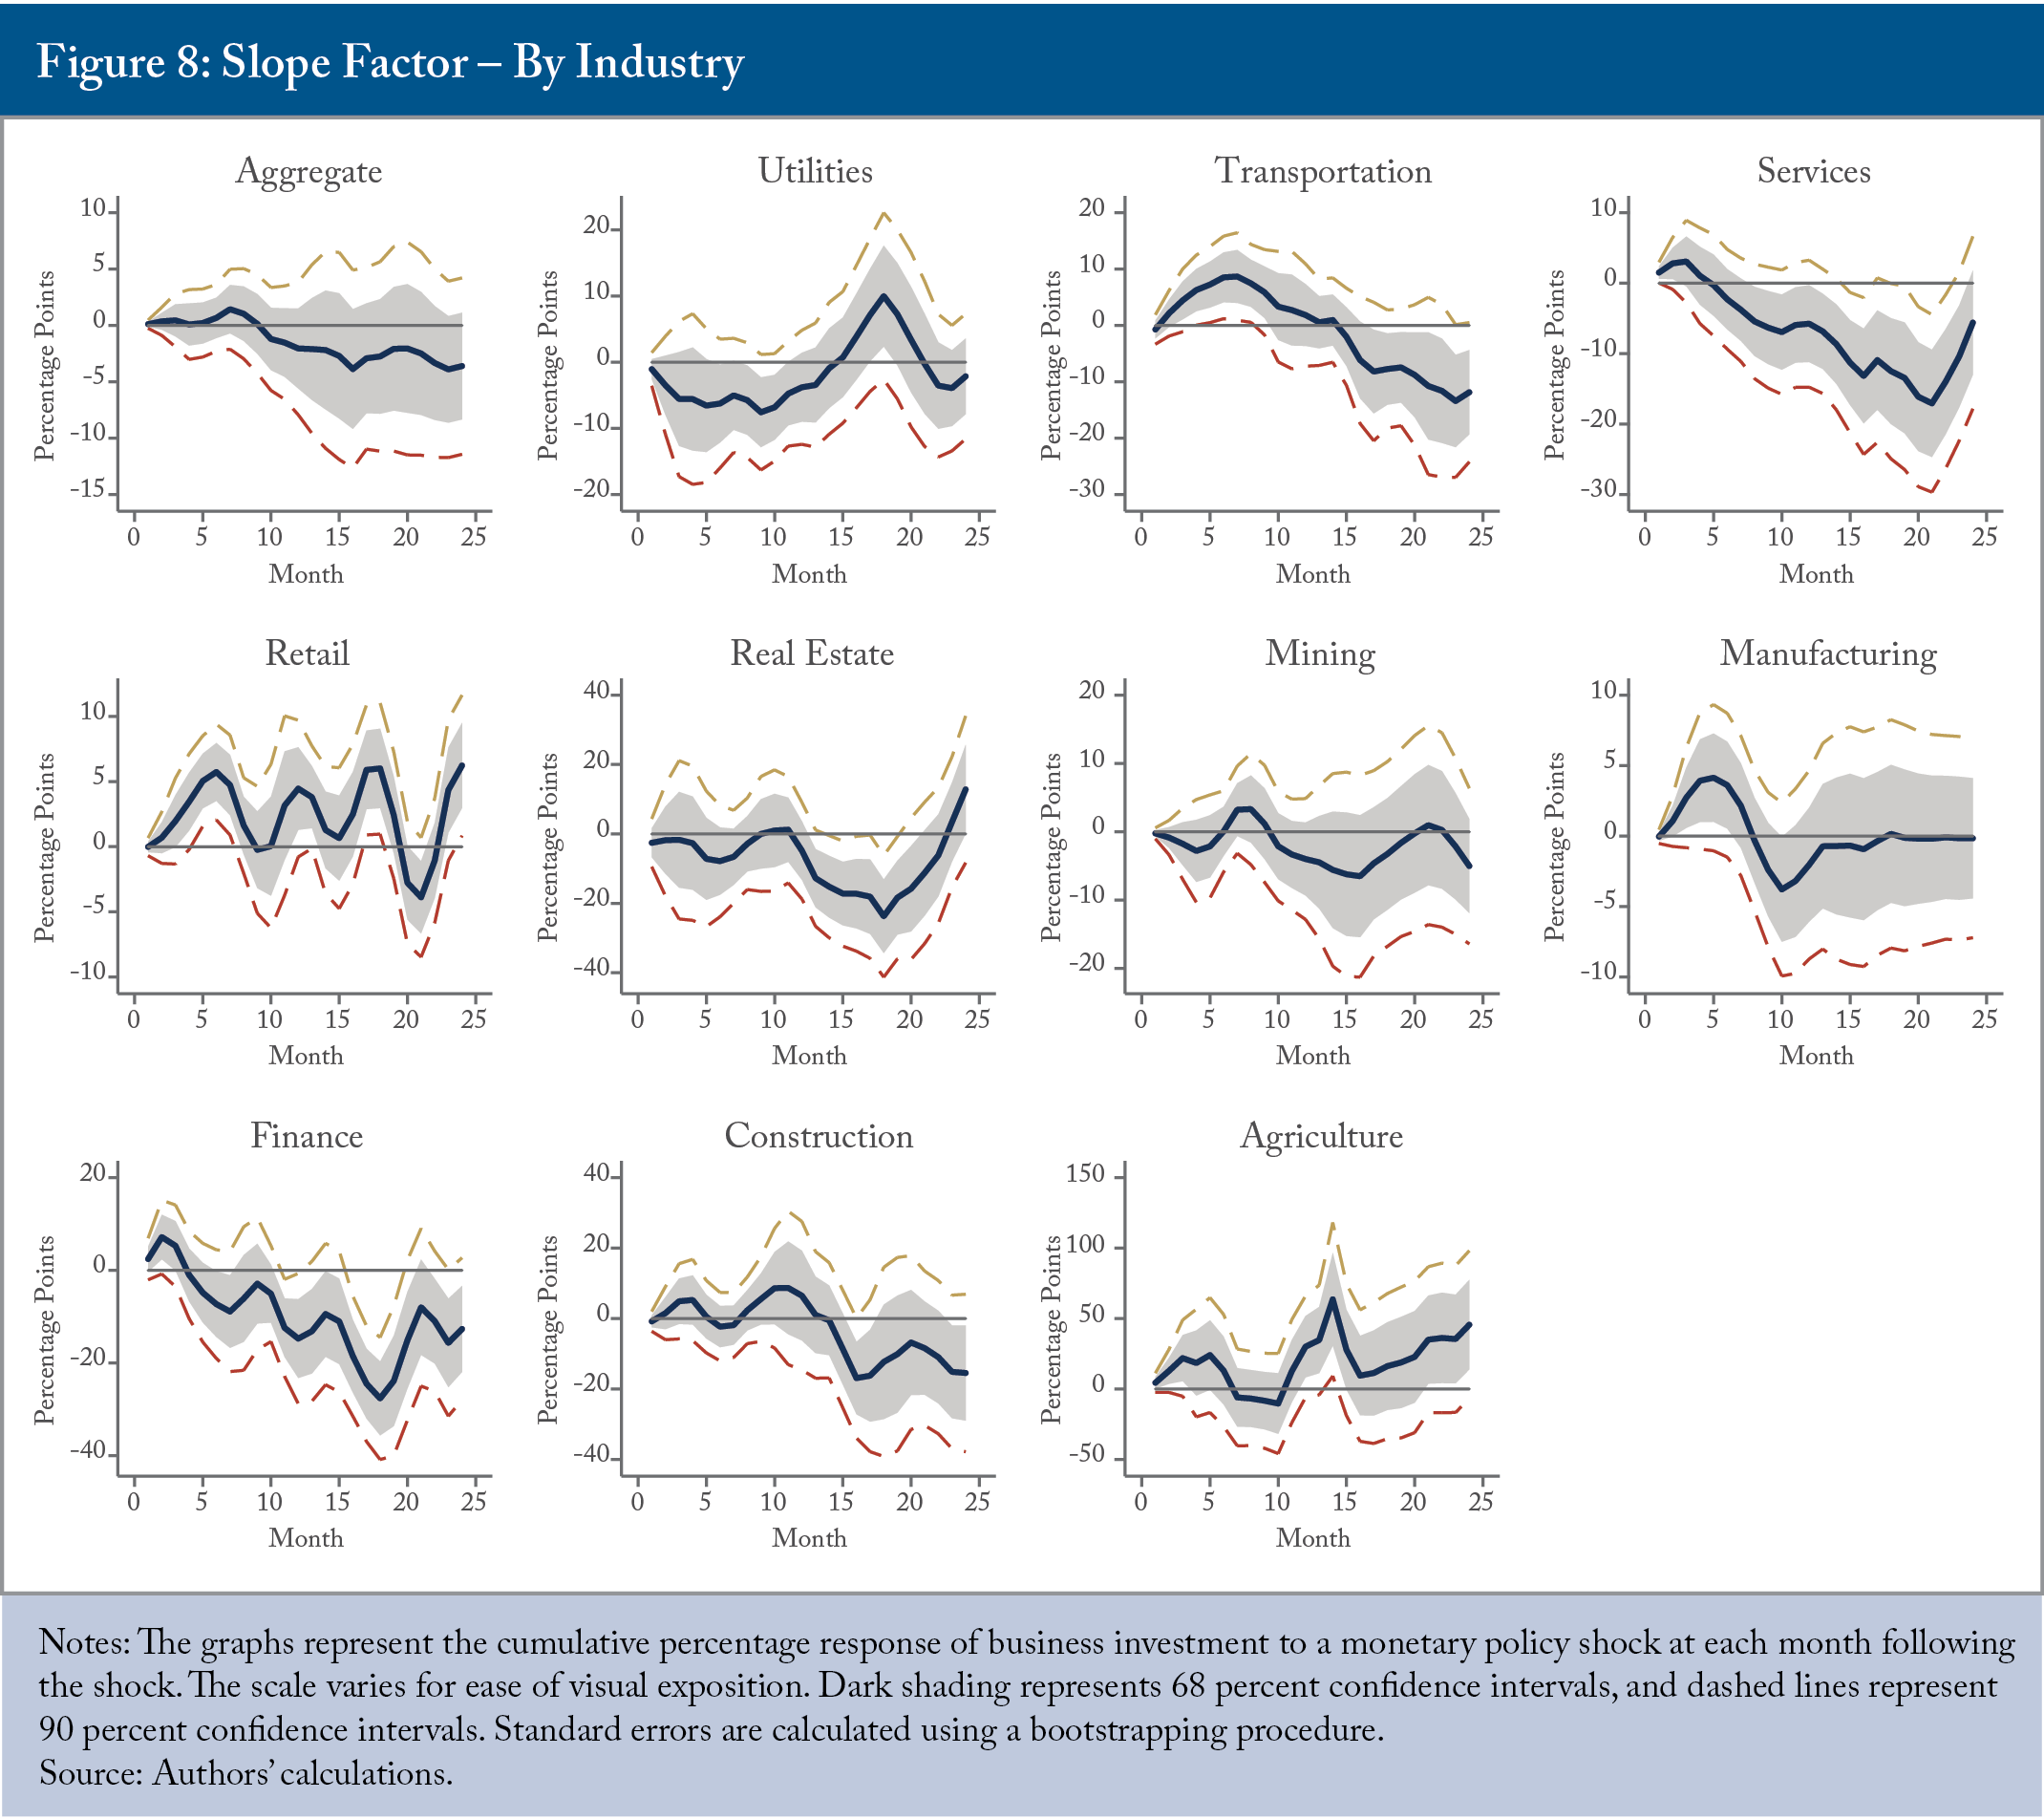
The results are very similar to those for the level factor except for manufacturing. Since our examination of the slope factor most closely resembles earlier studies of monetary policy shocks, we can compare our findings with the existing literature. Our results for construction and utilities are consistent with those of Ganley and Salmon (1997) for the UK but differ from theirs for manufacturing and services. Hayo and Uhlenbrock (1999) find significant differences in timing and magnitude between manufacturing and mining (as do we). Most of our sector-specific results are also comparable to Ibrahim (2005), who analyzes Malaysian data and similarly finds that the agriculture and utility sectors are largely unaffected by monetary policy, while construction, finance, real estate, services, and manufacturing sectors are highly responsive. While our results are broadly similar in direction to prior work, statistical significance is more limited. Again, the finance and services sectors stand out for exhibiting the most significant and long-lasting responses.
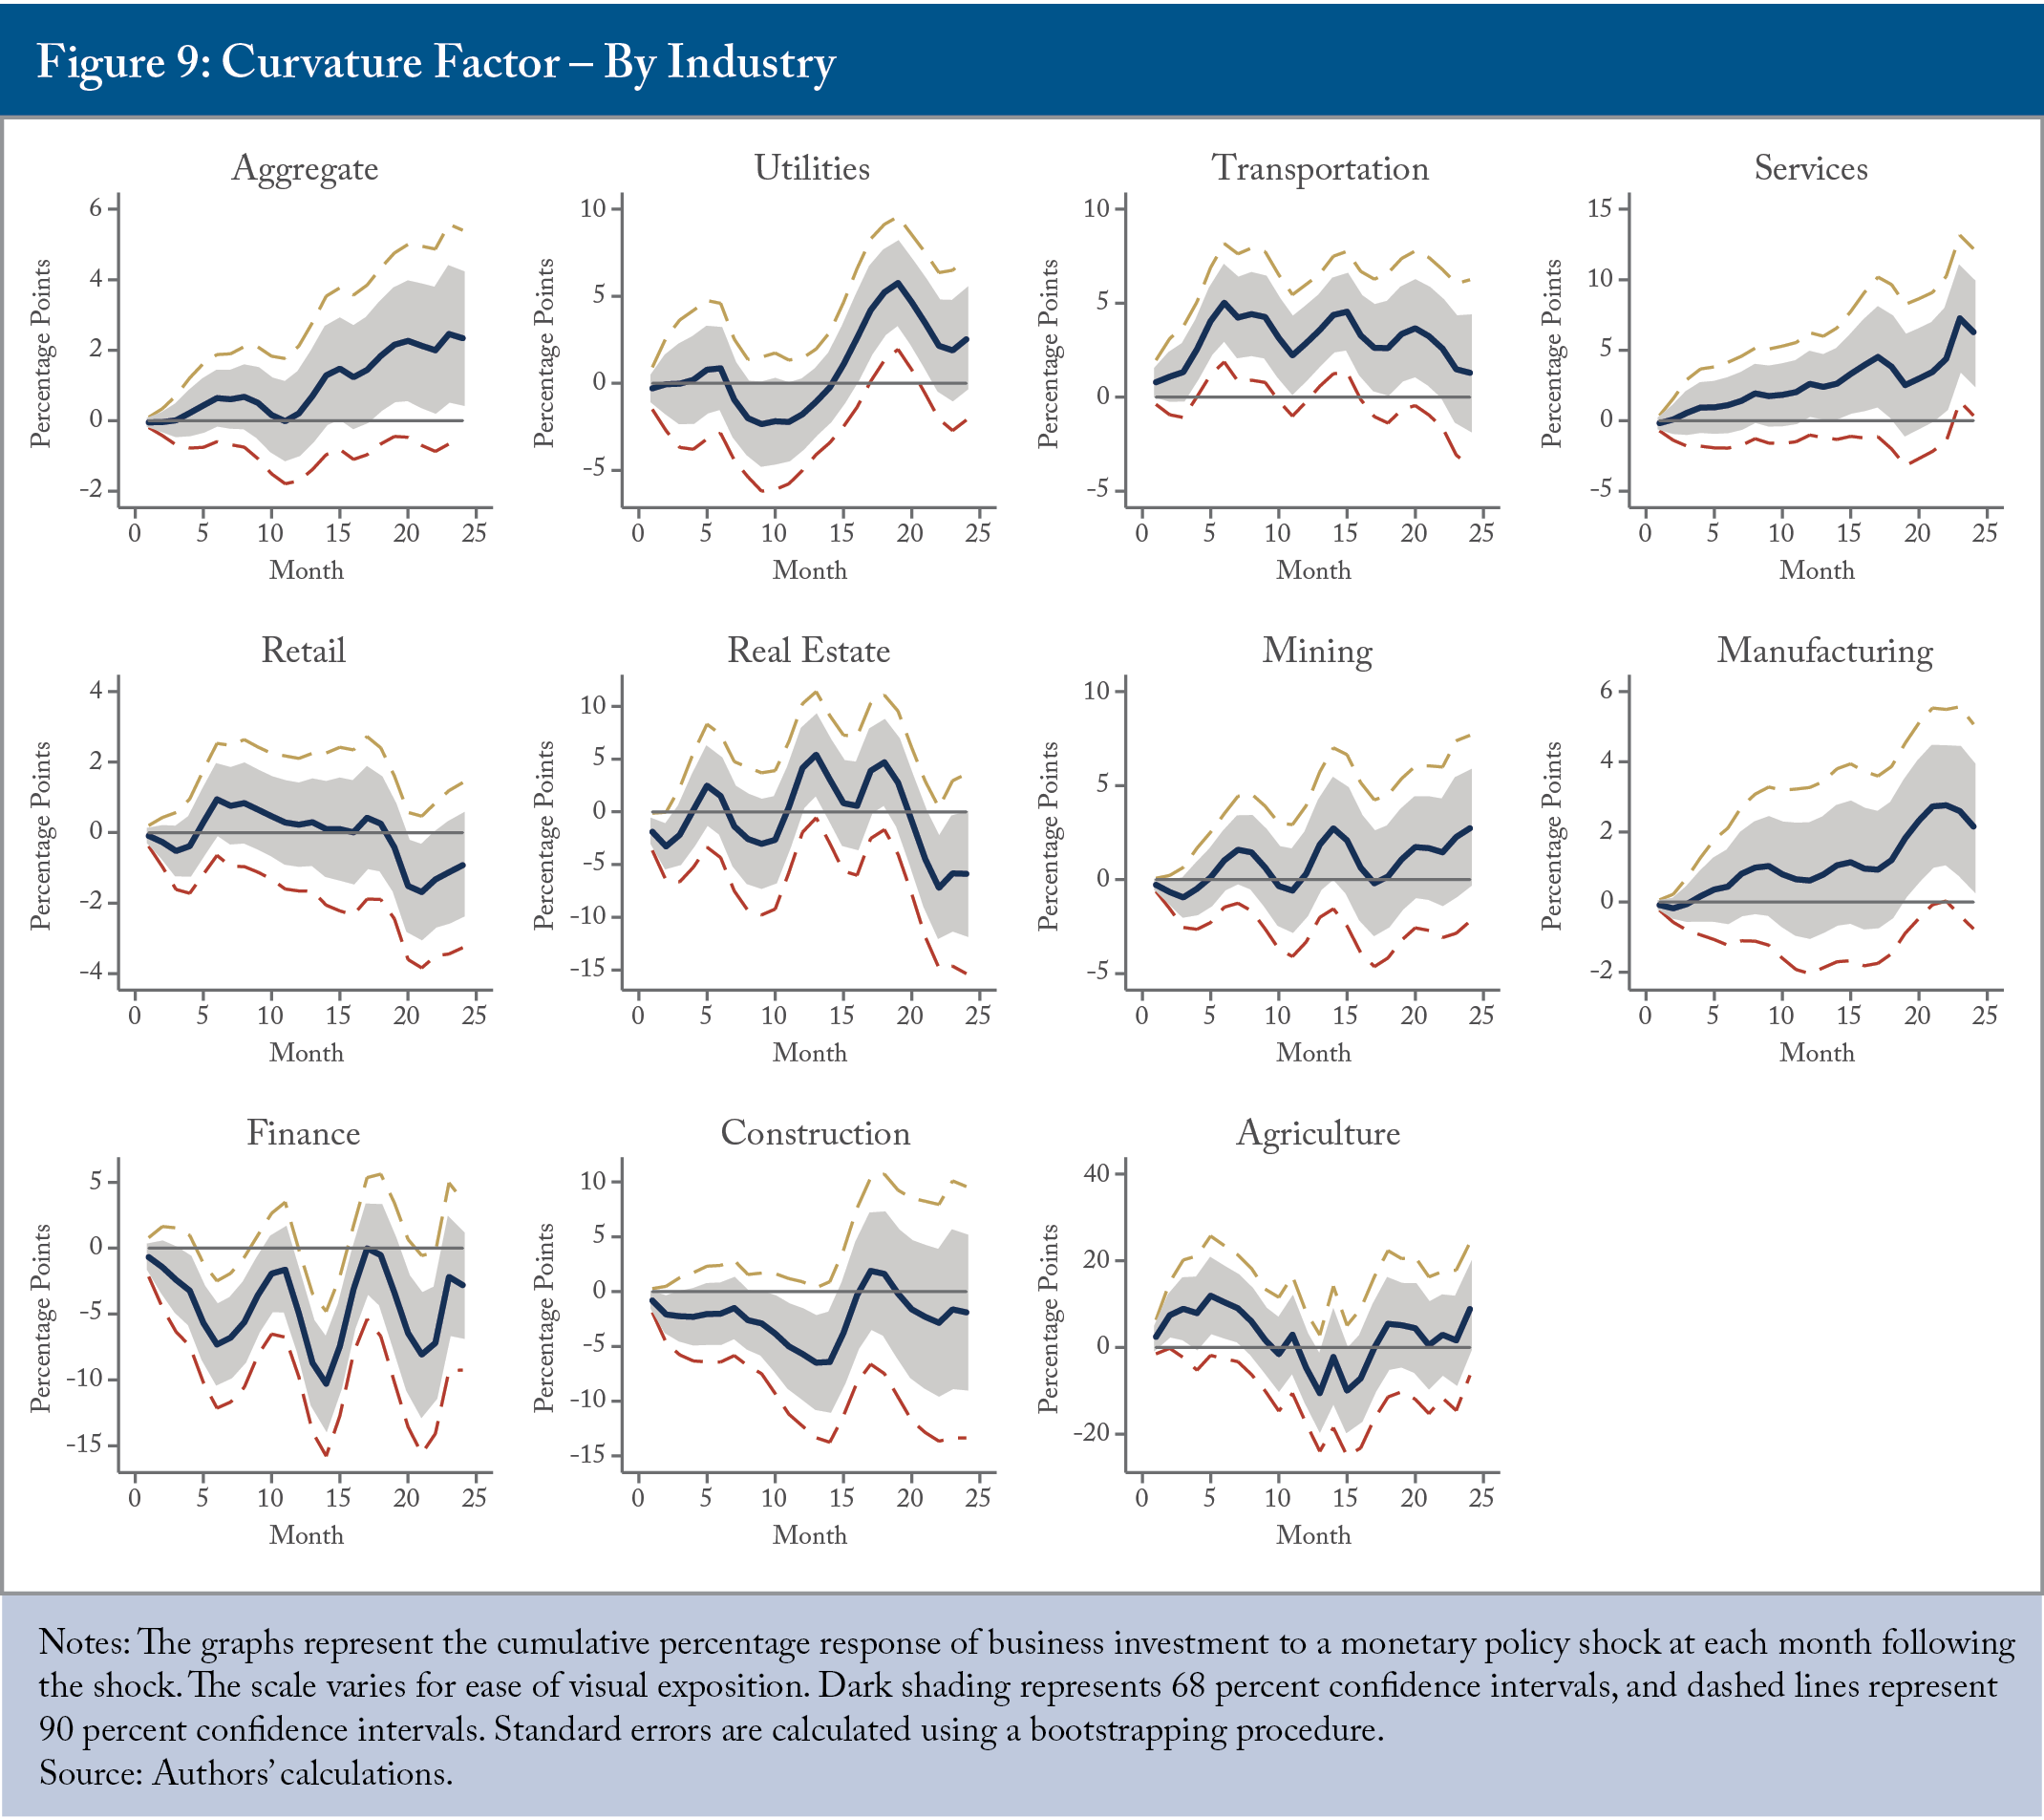
Lastly, for the curvature factor, which admittedly appears inconsistent with theory at the aggregate level, finance and construction fall as expected, while transportation, services, real estate, mining, manufacturing, and agriculture do not. Retail and utilities are more mixed because they initially move in one direction before reversing later in the period.
The main point is that there is clear heterogeneity across sectors and factors. Some sectors move as expected, regardless of the factor (e.g., finance and construction), while others do so much less consistently (e.g., agriculture and retail). Still others, such as manufacturing and transportation, show mixed responses.
Conclusion and Policy Recommendations
This Commentary examined the effect of a more comprehensive monetary policy shock series – one that takes into account the entire yield curve – on business investment, broken down at a more granular sectoral level than past work. And, indeed, we find a heterogeneous set of results.
This matters for policymaking and the economic literature in several ways. First, we believe our monetary policy shock series provides new insights into how monetary policy impacts investment. This is the first paper to analyze heterogeneous Canadian sectoral investment responses using these newly constructed shocks. This includes both conventional and unconventional policy actions, scheduled and unscheduled announcements, and communications by senior Bank of Canada officials. Understanding how the interest-rate term structure affects investment decisions will support the central bank in its use of these tools and forms of communication.
Second, to our knowledge, this paper provides the first detailed empirical evidence on Canadian sectoral monetary transmission on investment. No other study has examined Canadian investment responses using post-2000 data, despite significant changes in monetary policy implementation. We also go beyond aggregate data and present the first sector-by-sector analysis of monetary transmission using granular firm-level data. This granular approach uncovers further sectoral heterogeneity, providing new insight into why monetary policy affects some industries more strongly or more persistently than others.
While the Bank of Canada implements a single nationwide policy rate, our findings demonstrate that monetary policy affects industries unevenly. This heterogeneity is important for understanding the transmission mechanism of monetary policy. Knowledge of industry-specific sensitivities is useful for economists seeking to build better models and improve forecasting. Because the sectoral composition of the economy changes over time, the impact of monetary policy shocks on different industries matters. Our results suggest that the central bank can use this heterogeneity to better understand the likely impact of monetary policy on aggregate investment at any given point in time.
Similar to Ottonello and Winberry (2020), our results are also of interest to policymakers concerned about the distributional implications of monetary policy across industries. Furthermore, the findings help identify potential financial vulnerabilities and regional economic impacts. Industry heterogeneity implies regional heterogeneity in monetary policy effects. Provinces with greater exposure to interest-sensitive industries may experience larger economic fluctuations following monetary policy changes. Policymakers should be aware of these regional differences. Because monetary policy cannot target specific sectors, policymakers should consider complementary fiscal and structural policies to mitigate disproportionate adjustment costs borne by highly interest-sensitive industries while allowing the Bank of Canada to focus on its inflation-control mandate.
The authors thank the Social Sciences and Humanities Research Council of Canada for their financial support. They also extend gratitude to Steve Ambler, Mawakina Bafale, Dave Longworth, Peter MacKenzie, Angelo Melino, Daniel Schwanen, and several anonymous referees for valuable comments and suggestions. The authors retain responsibility for any errors and the views expressed.
References
Acemoglu, Daron, V.M. Carvalho, A. Ozdaglar, and A. Tahbaz-Salehi. 2012. “The Network Origins of Aggregate Fluctuations.” Econometrica 80(5): 1977-2016.
Ambler, Steve, and J. Kronick. 2024. Tell-tale Signals: A Customized Toolkit for Tracking the Economy. Commentary 655. Toronto: C.D. Howe Institute. March. https://cdhowe.org/publication/tell-tale-signals-customized-toolkit-tracking-economy/.
Bahaj, Saleem, A. Foulis, G. Pinter, and P. Surico. 2022. “Employment and the residential collateral channel of monetary policy.” Journal of Monetary Economics 131: 2018-2032.
Bernanke, Ben, and M. Gertler. 1995. “Inside the Black Box: The Credit Channel of Monetary Policy Transmission.” Journal of Economic Perspectives 9(4): 27-48. Fall.
Bloem, Adriaan, R. Dippelsman, and N. Maehle. 2001. Quarterly National Accounts Manual: Concepts, Data Sources, and Compilation. International Monetary Fund.
Boivin, Jean, M. Kiley, and F. Mishkin. 2010. “How Has the Monetary Transmission Mechanism Evolved Over Time?” Working Paper No. 15879. National Bureau of Economic Research. Cambridge, MA.
Cameron, A. Colin, J. Gelbach, and D. Miller. 2008. “Bootstrap-Based Improvements for Inference with Clustered Errors.” Review of Economics and Statistics 90(3): 414-427.
Cloyne, James, C. Ferreira, M. Froemel, and P. Surico. 2018. “Monetary Policy, Corporate Finance and Investment.” Working Paper 25366. National Bureau of Economic Research. Cambridge, MA.
Crouzet, Nicolas, and J.C. Eberly. 2019. “Understanding Weak Capital Investment: The Role of Market Concentration and Intangibles.” Working Paper No. 25869. National Bureau of Economic Research. Cambridge, MA.
Dale, Spencer, and A. Haldane. 1995. “Interest rates and the channels of monetary transmission: Some sectoral estimates.” European Economic Review 39(9): 1611-1626.
Dedola, Luca, and F. Lippi. 2005. “The Monetary Transmission Mechanism: Evidence From the Industries of Five OECD countries.” European Economic Review 49(6): 1543-1569.
Döttling, Robin, and L. Ratnovski, 2023. “Monetary Policy and Intangible Investment.” Journal of Monetary Economics 134: 53-72.
Durante, Elena, A. Ferrando, and P. Vermeulen. 2022. “Monetary policy, investment and firm heterogeneity.” European Economic Review 148.
Efron, Bradley. 1979. “Bootstrap Methods: Another Look at the Jacknife.” The Annals of Statistics 7(1): 1-26.
Farès, Jean, and G. Srour. 2001. “The Monetary Transmission Mechanism at the Sectoral Level.” Bank of Canada Working Paper No. 2001-27.
Gamba, Andrea, and A. Triantis. 2008. “The Value of Financial Flexibility.” The Journal of Finance 63(5): 2263-2296.
Ganley, Joe, and C. Salmon. 1997. “The Industrial Impact of Monetary Policy Shocks: Some Stylized Facts.” Bank of England Working Paper No. 68.
Gertler, Mark, and P. Karadi. 2015. “Monetary Policy Surprises, Credit Costs, and Economic Activity.” American Economic Journal: Macroeconomics 7(1): 44-76. January.
Gertler, Mark, and S. Gilchrist. 1994. “Monetary Policy, Business Cycles, and the Behavior of Small Manufacturing Firms.” Quarterly Journal of Economics 109(2): 309-340.
Gilchrist, Simon, and E. Zakrajšek. 2012. “Credit Spreads and Business Cycle Fluctuations.” American Economic Review 102(4): 1692-1720. June.
Grob, Valentin, and G. Züllig. 2024. “Corporate Leverage and the Effects of Monetary Policy on Investment: A Reconciliation of Micro and Macro Elasticities.” Swiss National Bank Working Paper No. 08/2024.
Hayo, Bernd, and B. Uhlenbrock. 2000. “Industry Effects of Monetary Policy in Germany.” In von Hagen, J., Waller, C.J. (eds.), Regional Aspects of Monetary Policy in Europe. ZEI Studies in European Economics and Law, Vol 1. Springer, Boston, MA.
Hu, Charles X. 1999. “Leverage, Monetary Policy, and Firm Investment.” Economic Review 2(2): 32-9.
Huang, Ying Sophie, F.M. Song, and Y. Wang. 2012. “Monetary Policy and Corporate Investment: Evidence from Chinese Micro Data.” China & World Economy 20(5): 1-20.
Ibrahim, Mansor. 2005. “Sectoral Effects of Monetary Policy: Evidence from Malaysia.” Asian Economic Journal 19: 83-102.
Inoue, Atsushi, and B. Rossi. 2021. “A new approach to measuring economic policy shocks, with an application to conventional and unconventional monetary policy.” Quantitative Economics 12(4): 1085-1138.
Jordà, Òscar. 2005. “Estimation and Inference of Impulse Responses by Local Projections.” American Economic Review 95(1): 161-182.
Kaplan, Steven, and L. Zingales. 1997. “Do Investment-Cash Flow Sensitivities Provide Useful Measures of Financing Constraints?” Quarterly Journal of Economics 112: 169-215.
Kim, Hyunseob, and H. Kung. 2017. “The Asset Redeployability Channel: How Uncertainty Affects Corporate Investment.” The Review of Financial Studies 30(1): 245-280.
Koeppl, Thorsten, J. Kronick, and J. McNeil. 2024. “Using Functional Shocks to Assess Conventional and Unconventional Monetary Policy in Canada.” Canadian Journal of Economics 57(4): 1314-1336. October.
Kronick, Jeremy, and F. Villarreal. 2020. “Monetary Policy, Income Inequality, and Inflation – What’s the Link?” E-Brief. Toronto: C.D. Howe Institute. January. https://cdhowe.org/publication/monetary-policy-income-inequality-and-inflation-whats-link/.
Lei, Boru. 2025. “The Impact of Capital Structure on Firm Performance Across Industries.” Advances in Economics Management and Political Sciences 172(1): 109-114. April.
Ma, Yueran and K. Zimmermann. 2023. “Monetary Policy and Innovation.” Working Paper 31698. National Bureau of Economic Research. Cambridge, MA.
Masuda, Koichi. 2015. “Fixed Investment, Liquidity Constraint, and Monetary Policy: Evidence from Japanese Manufacturing Firm Panel Data.” Japan and the World Economy 33: 11-19.
Mojon, Benoît, F. Smets, and P. Vermeulen. 2002. “Investment and monetary policy in the euro area.” Journal of Banking & Finance. 26(11): 2111-2129. November.
Nelson, Charles R., and A. Siegel. 1987. “Parsimonious Modeling of Yield Curves.” Journal of Business 60(4): 473-489. February.
Ottonello, Pablo, and T. Winberry. 2020. “Financial Heterogeneity and the Investment Channel of Monetary Policy.” Econometrica 88(6): 2473-2502. November.
Pagan, Adrian. 1984. “Econometric Issues in the Analysis of Regressions with Generated Regressors.” International Economic Review 25: 221-247. February.
Pasten, Ernesto, R. Schoenle, and M. Weber. 2020. “The Propagation of Monetary Policy Shocks in a Heterogeneous Production Economy.” Journal of Monetary Economics 116: 1-22. November.
Peersman, Gert, and F. Smets. 2005. “The Industry Effects of Monetary Policy in the Euro Area.” The Economic Journal 115(503): 319-342. April.
Ramey, Valerie, and S. Zubairy. 2018. “Government Spending Multipliers in Good Times and in Bad: Evidence from US Historical Data.” Journal of Political Economy 126(2): 850-901.
Robson, William B.P., and M. Bafale. 2025. Canada’s Investment Crisis: Shrinking Capital Undermines Competitiveness and Wages. Commentary 699. Toronto: C.D. Howe Institute. December. https://cdhowe.org/publication/canadas-investment-crisis-shrinking-capital-undermines-competitiveness-and-wages/.
Tenreyro, Silvana, and G. Thwaites. 2016. “Pushing on a String: US Monetary Policy is Less Powerful in Recessions.” American Economic Journal: Macroeconomics 8(4): 43-74. October.
Whited, Toni M., and G. Wu. 2006. “Financial Constraints Risk.” The Review of Financial Studies 19(2): 531-559.
Yang, Xingquan, L. Han, W. Li, X. Yin, and L. Tian. 2017. “Monetary Policy, Cash Holding and Corporate Investment: Evidence from China.” China Economic Review. 46: 110-122.