






- The massive shift to working from home is causing Canada’s major urban centres to lose out on the wider, often overlooked, economic benefits of public transit.
- Fast public transit enables riders to have access to a wider set of job opportunities, higher wages, new services, and learning partners. It also means businesses can draw better talent. Simply, publicly financed transportation infrastructure enables more people to connect with each other, resulting in increased economic efficiency and growth, benefitting both people and firms.
- As governments make decisions on transit operations and investment, these wider economic benefits should be an explicit part of the cost-benefit analysis.
The Study In Brief
COVID-19 has fundamentally changed lives across Canada. This change may be most pronounced in Canada’s major cities and for public transit operators. Public transit is the essential component that enables the benefits of people coming together. These wider economic benefits – what economists call agglomeration – are a key element of why cities exist in the first place. As more people can connect in person, the higher their incomes.
Canadian governments are systematically undervaluing transportation investments – both in terms of annual operating value, and the returns on new investments – if they ignore how transit is a key ingredient of what makes cities vibrant.
This paper estimates the annual economic value of the Toronto Transit Commission (TTC) as an example of how to understand the wider economic benefits of public transit. This single transit system enables billions of dollars in wider economic benefits.
We estimate an economic loss of $1.7 billion for the Toronto region of reduced agglomeration benefits due to low travel levels mid-pandemic from reduced TTC ridership. These economic costs are more likely in the range of $1.2 to $1.4 billion based on reasonable assumptions about how much people still travelled but switched to using cars during the pandemic.
Future service enhancements – ranging from simple investments like dedicated lanes for buses to new train lines – might enable broader urban agglomeration economies. We estimate the agglomeration-related economic benefits of the TTC’s 5-year service plan improvements to be $377 million per year, which would add on to the agglomeration benefits of the existing system.
Transit authorities in Canada rely on farebox revenues from paying passengers as their largest source of revenue. As costs rise, such as the need to increase staff wages, transit operators must decide between increasing fares, finding efficiencies, or seeking a greater subsidy from governments. Fare increases have the effect of discouraging some users from travelling and create a wider economic cost. The economic costs of people choosing not to travel because of higher fares – not going to a new restaurant, or not taking on a new and better job – can be substantial. However, governments should weigh the alternative of the economic harm of raising taxes to pay for subsidies. Depending on the kind of tax a government relies on, the economic harm of higher taxes may be worse than the economic cost of fewer fare-price-sensitive travellers.
How does incorporating wider economic benefits into the economics of transit affect all public transit operators looking beyond the pandemic to a new normal of work and commuting? A return to a partial (one or two days a week) work-from-home model for many workers once the pandemic subsides is a likely outcome. The ability to partially work from home will likely recapture most of the lost agglomeration benefits we have seen the last year.
However, such reduced travel leaves a fare revenue gap that transit operators will need to fill to maintain service levels. Senior governments that collect income tax revenues – and see a bottom-line income tax benefit from wider economic benefits – can temporarily provide operating subsidies to transit operators. Such operating subsidies should only last until transit networks can re-orient their services to permanent post-pandemic demand trends.
COVID-19 has fundamentally changed lives across Canada. Its impact is most pronounced in Canada’s major urban centres, particularly the Greater Toronto Area (GTA) and in Montreal, which have implemented social distancing and strict shuttering of specific sectors to save Canadian lives.
Some of these measures have had obvious economic costs: restaurants unable to open, theatres closed for business and many businesses operating at reduced capacity.
These are among the more visible economic costs of the pandemic and the measures to counter it. In addition to these visible costs, there are the hidden and wider economic costs of trips forgone because of social-distancing measures. Social distancing counters some of the key forces that have made urban areas vibrant economic centres. Cities have formed over centuries as a means for people to come together to share ideas and create and use new and exciting services.
The pandemic threatens some of the driving forces that lead to higher incomes and living standards when more people are able to congregate in an urban area. The pandemic’s short-term economic cost has been severe for people in the retail, leisure and hospitality sectors. However, the economic cost of urban residents not leaving their homes for work could extend well beyond these sectors and result in many more workers experiencing lower productivity and wages, producing fewer innovations and having less joy in their personal connections if urban life doesn’t return to its pre-pandemic state.
Much will be written in the coming months and years on how the pandemic, and the eventual recovery, will affect cities. This Commentary examines how public transit networks – which have been under great stress during the pandemic and are essential to urban economies – should adapt in the future.
Canadian governments will be systematically undervaluing transportation investments – both in terms of their annual operating values and returns on new spending – if they ignore agglomeration’s wider economic benefits. Specifically, our review of Toronto’s situation shows that recapturing the agglomeration benefits enabled by public transit requires that governments increase their annual operating funding. Even a partial (one or two days a week) work-from-home model for many once the pandemic subsides would produce an economically efficient outcome that recaptures the agglomeration benefits lost from large-scale working from home.
However, such reduced travel leaves a fare revenue gap that transit operators will need to fill to maintain existing service levels. Governments that collect income tax revenues and see a bottom-line benefit from agglomeration should temporarily provide operating subsidies to transit operators until they re-orient their services to post-pandemic demand trends. They should weigh the economic cost of filling that gap with fare increases versus increases in low-economic-cost taxes. Similarly, new investment has a measurable agglomeration benefit that should be included in the cost-benefit analysis (unlike current practice) of all major transit investments.
The Economic Costs of Pandemic Measures and Policy Action on Transit
Social-distancing measures in response to COVID-19 directly counteract agglomeration’s economic benefits. While the life-saving value of social-distancing policies outweigh the resulting lost economic value, their costs are worth measuring to understand what we have forgone. Meanwhile, the costs of lockdown are not borne equally by people and institutions. One group that has unequally borne that cost is transit providers, like the Toronto Transit Commission (TTC), through reduced ridership. As such, reduced ridership affects not only the TTC, itself, but also the economic benefits of people congregating in urban centres.
We estimate that the TTC provides $2.7 billion in annual wider economic benefits, although this figure falls to about $1.75 billion if we assume that some TTC travel would still happen by other means. Using historical data, we estimate substantial lost economic productivity from reduced agglomeration as a result of pandemic-induced lower transit usage. There are many benefits of urban living, such as tapping a large job market, having access to a wide range of services and infrastructure, and learning from others face to face. First, we estimate a $1.7 billion cost from reduced agglomeration benefits in the Toronto region due to reduced TTC ridership and service levels. However, these economic costs are more likely in the $1.2 billion-to-$1.4 billion range, based on assumptions about people switching to cars and other means of transport during the pandemic.
These TTC agglomeration benefits will continue to diminish if people increasingly decide to work from home and hence create a more geographically dispersed workforce. Such a trend would counteract the physical-proximity benefits of scale economies in creating unique infrastructure and amenities, even if information technology overcomes agglomeration’s work and education collaboration benefits. Despite decades of predictions that technology will supplant urban living, agglomeration economies have continued to persist in driving strong employment centres in urban areas (Giuliano, Kang, and Yuan 2019).
We will also show how future service enhancements – ranging from simple investments such as dedicated bus lanes to new train lines – might enable broader urban agglomeration economies. A faster train service that replaces a bus stuck in traffic enables faster travel. Faster travel enables a transit rider to have access to a wider set of job opportunities. They can access more services, such as restaurants or other businesses. They can also reach more potential learning partners.
For its part, business can draw better talent. Such additional travel opportunities benefit both the person travelling further and the people living near that person’s destination. The same is true for other service enhancements, such as faster bus travel or more frequent and faster subway service. To that end, we estimate the agglomeration benefits of the TTC’s current five-year plan to be $377 million annually to supplement the existing system’s agglomeration benefits.
Finally, we will show the wider economic costs governments should consider when they consider fare increases. Transit authorities in Canada finance most of their operations from fare-box revenues. As costs, such as the need to increase staff wages, rise operators must decide between cutting service levels and maintaining them either by increasing fares or seeking a greater subsidy from government.1Many forms of urban transportation receive general subsidies. Since 2008, road users have paid about 70 percent of the total operating and capital expenses on roads through gas taxes and other fees (Dachis 2018). What appears to be a government investment for one type of transportation user looks to others like a subsidy for users of different transportation modes.
Historically, fare increases occur regularly and are a simple way a transit operator acts to increase revenues. However, fare increases discourage some users from travelling, which reduces the net revenue gain as well as transit’s wider economic benefits. Transit operators (working with the governments that subsidize them) need to consider these factors in setting the optimal fare. We estimate that a 5 percent increase in TTC fares would produce $62 million in additional revenues but result in a minimum $32 million reduction in wider economic benefits initially, and eventually surpass the additional revenues. However, unless the TTC reduces costs or governments subsidize it through a low-economic-cost tax such as a consumption tax, the lower economic cost way to fill a transit funding gap, at least through the lens of agglomeration economies and the economic cost of taxes, is to raise fares.
A Policy Approach for Post-Pandemic Transit
As governments across Canada look at how public transit operations and investment decisions will evolve post-pandemic, they should consider a few principles that come from the economics of agglomeration and cost-benefit analysis. The economics of agglomeration should be a part – although not the only part – of both investment and operating decisions such as setting fares. The complication for governments is that employees and firms are not currently considering agglomeration benefits in their own post-pandemic location decisions. However, governments should consider these potential benefits when taking decisions that impact incentives for working from home; e.g., investments in broadband that enable more productive working from home versus more money for improved transit that may counter incentives to work from home.
At the same time, there is currently greater risk in transit investment, given trends toward continued working from home post-pandemic. Governments can offset some of this risk to taxpayers by attracting private capital, such as through the Canada Infrastructure Bank or other institutional investors.
Policy Background
COVID-19 and its Effect on Transit
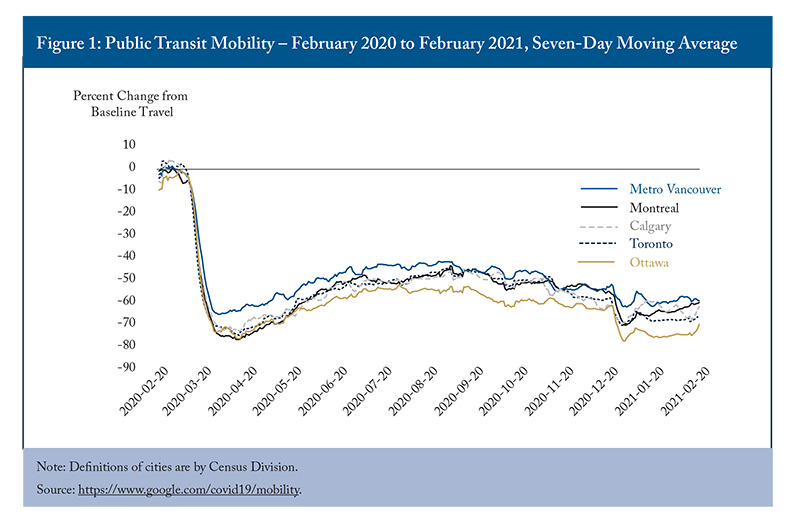
Social-distancing measures due to COVID-19 have had a profound effect on public transit usage across Canada (Figure 1). At the earliest stage of the pandemic in late March and April of 2020, transit usage in Canada’s largest cities was between 65 percent and 75 percent below pre-pandemic levels. The reduction was initially less significant in the Metro Vancouver region, which was experiencing lower COVID-19 case levels. Transit ridership rose across Canada over the summer to around half of pre-pandemic levels. As the second wave of COVID-19 cases swept across Canada in the fall and winter of 2020/21, transit use started falling again with transit ridership across Canada’s largest cities at between 60 percent and 70 percent below pre-pandemic levels of mid-February 2021.
These aggregate trends affect specific transit modes differently. The TTC, as of the week ending February 12, 2021, had paid ridership 75 percent below pre-pandemic levels. However, this reduction is less significant for bus services, which is at about one-third of pre-pandemic levels, and was 50 percent of peak levels in September 2020.2For the latest TTC ridership and service level figures, see http://ttc.ca/COVID-19/Latest_News.jsp.
The reduction is even more pronounced for other transit agencies. Metrolinx, which operates inter-regional train and bus services in the GTA, has seen overall trips taken between April and September 2020 fall by 92 percent (Metrolinx 2020a). These differences are not a surprise and likely reflect users’ different demographics. Bus users are more likely to be lower-paid essential workers without cars, while commuter rail passengers are likely to have a car and work in office-oriented jobs amenable to remote work.
Such reductions in transit demand are an obvious result of the important social-distancing measures taken to save lives. However, social distancing, when targeted at the right sectors and in the right way, can reduce overall economic costs without sacrificing health outcomes (Kronick and Jenkins 2021). Similarly, an economic analysis may find that even the basic social-distancing measures that are likely the driving force behind reduced transit use have a low net cost per life saved compared to the cost of lost lives that would have resulted if no or only few measures were taken. That said, these temporary measures that will disappear post-COVID-19 do have a cost, particularly on the sectors most affected, like public transit.
Future Trends in Working from Home
Public transit is but one choice that many workers have in accessing work. The traditional main competing travel mode has been the car. The COVID-19 pandemic has accelerated another competing means of accessing work, which is staying at home. According to Statistics Canada, in 2020 between early February and late May the number of firms that reported less than 20 percent of their employees working from home fell from 85 percent to 69 percent. By August 2020, two-thirds (65 percent) of companies reported that more than 20 percent of their employees worked from home.
In Statistics Canada’s post-pandemic outlook surveys, as of August 2020, 56 percent of employers expect that more than 20 percent of their employees will work from home, considerably less than the 74 percent of employers who felt that way in May 2020.3See Statistics Canada table 33-10-0247-01.3 Many more companies have become primarily work-from-home. Only 6 percent of companies had 80 percent or more of their employees working remotely pre-COVID-19, increasing to 19 percent by May 2020 and 37 percent by August 2020. However, companies expect this primarily remote work model to decline by more than half, to 17 percent of employees post-COVID-19.
There are many aspects of working from home that companies and employees will need to consider, such as the costs of investing in technology, legal issues and legacy investments in real estate. Many jobs currently are not and will likely not be amenable to work-from-home models. For those jobs that can move to a work-from-home model, employee-specific and firm-specific productivity questions will be key determinants of this decision.4The productivity benefit of working from home is highly multifaceted. For one analysis, see Bloom et al. (2014).
For their part, employees are likely to make decisions that are best for their personal situations and not think about others. That leaves it to firms to determine the balancing of personal productivity increases from working at home versus the lost collaborative productivity benefits that accrue more broadly beyond the individual. Similarly, firms are not necessarily going to think beyond the borders of their operation in thinking how their location decisions will affect productivity of the economy as a whole.
TTC 5-Year Service Plan
The TTC’s 5-Year Service Plan and 10-Year Outlook, released in December 2019, outline transit service-related improvements between 2020 and 2024 and onward.5The service improvements are: new streetcars in 2020, opening of the Line 5 LRT, expanding the express bus network, enhancements to Scarborough bus services with new bus routes in 2021, implementation of Automatic Train Control and new subway cars on the Line 1 subway in 2022, opening of the Line 6 LRT along with new 501 and 504 streetcars in 2023, and new streetcar services in 2024. Details on the 5-Year Service Plan and 10-Year Outlook can be found at https://www.ttc.ca/About_the_TTC/Projects/5_year_plan_and_10_y/index.jsp. With an anticipated passenger growth of one percent annually between 2020 and 2029, the plan lays out how the TTC will improve and expand its services in order to accommodate for this expected growth.6Our analysis does not include these longer-term investments. The 10-Year Outlook broadly outlines service improvements that the TTC plans to make before 2030. These include the construction of the Ontario Line, extension of the Line 1 Yonge subway, an east extension on the Line 2 Bloor subway, an east and west extension of the Line 5 Eglinton LRT, 12 new GO Transit stations in Toronto, the addition of Rapid Bus Transit services and the capital improvements of various subway stations.
Fare Revenues
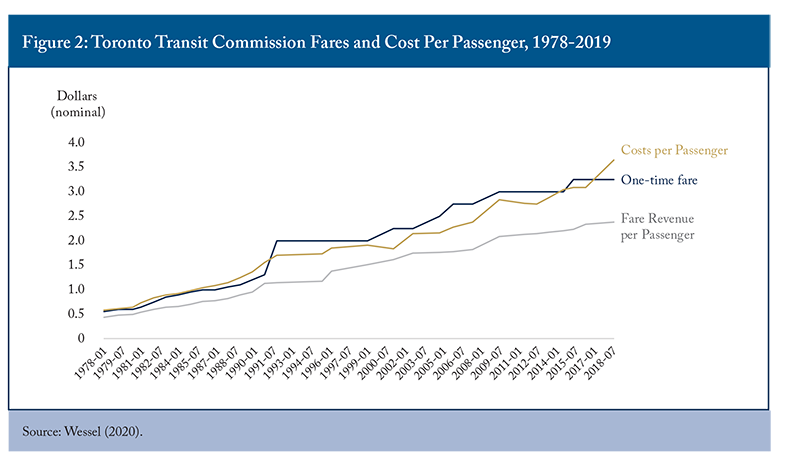
Canadian cities and transit authorities rely heavily on fare revenues to finance transit operations. As of 2019, the TTC received $2.39 in revenue per fare-paying passenger, whereas it spent $3.65 for every passenger (Figure 2).7Relative to the rest of Canada, the TTC’s 65 percent recovery ratio is higher than any other transit authority, with the exception of GO Transit – a rail system that operates in Ontario’s Greater Golden Horseshoe region – which has a distance-based fare system allowing it to recover about 82 percent of its operating costs through fare revenue (BC Auditor 2013). The cost-recovery ratios for other major transit authorities are: Montreal: 57 percent; Vancouver: 52 percent; Calgary: 50 percent; Ottawa: 45 percent; Edmonton: 40 percent) However, this 65 percent ratio between fare revenue and costs per passenger has varied historically in Toronto over the last four decades. The gap between fare revenues and expenses per passenger is now at its lowest level in percentage terms since the early 1990s, the lowest ratio since financial data were made available from the 1960s (Wessel 2020).8Wage costs have historically made up about 75 percent to 78 percent of total TTC expenses for the last 40 years. Wages as a share of costs rose to 82 percent in the mid-2000s and have since fallen back to historical norms. Fare recovery has become especially challenging recently given that total fare-paying passenger rides fell by more than two percent from 2016 to 2019, partly because of weekend closures for infrastructure upgrades. At the same time, the total kilometres operated by the TTC have increased over those three years by more than six percent.
Transit operators offer a wide range of fares, ranging from monthly passes to one-time-use tickets. These fares must be generally aligned so as to not create an incentive for regular passengers to heavily favour one means of paying over another. For one representation of fares, which is the highest such rate, the TTC has not increased cash (or one-time-use) fares since 2016, when they went up by 25 cents, or 8.3 percent. In light of pandemic-related increased pressure on costs, a decision on fare increases is likely to come again soon.
Soon after Canadian transit authorities entered 2020 facing ongoing low revenue recovery and increased reliance on government subsidies, the pandemic greatly exacerbated this problem, both in the short and long term. To address the immediate concern, provincial and federal governments provided significant funding. In the summer of 2020, the Ontario and federal governments provided $4.5 billion in support for transit and municipal operating shortfalls, with the majority of that money dedicated to covering transit agency shortfalls, with other provinces reaching similar deals.9See https://www.canada.ca/en/intergovernmental-affairs/services/safe-restart-agreement/letters/ontario.html.
Once the pandemic subsides, however, transit agencies will be faced with a decision on the appropriate level of revenue recovery in the face of declining demand from those working from home. Higher transit fares will further deter some travellers from taking transit, choosing to instead drive or continue working from home if they had that choice. The alternative for transit authorities is to seek further subsidies from governments at all levels, who themselves will be facing pressures on spending and debt levels. Both transit operators and governments will have to balance both service delivery and transit’s broader economic benefits with the fares and taxes they collect to finance their operations.
Agglomeration Economics and How Transit Enables Urban Economic Benefits
The above policy issues about fare setting, investment levels and demand forecasts have been long addressed by traditional political and economic means. For example, where to locate transit investment has a strong socioeconomic factor that considers the effect on marginalized and low-income communities. In this Commentary, the lens is through urban economic theory, which includes socioeconomic factors, and evidence around agglomeration.10This Commentary’s approach does not address other analytical lenses or traditional cost-benefit analysis, as others can best deploy those tools. The analysis here is meant to supplement and complement these other views. For example, passenger income levels vary based on the kinds of transportation used such as subway, bus or car. These are important issues that are adjacent to transit’s agglomeration benefits but require a separate comprehensive study to provide a full picture of transit’s benefits.
Agglomeration Economics
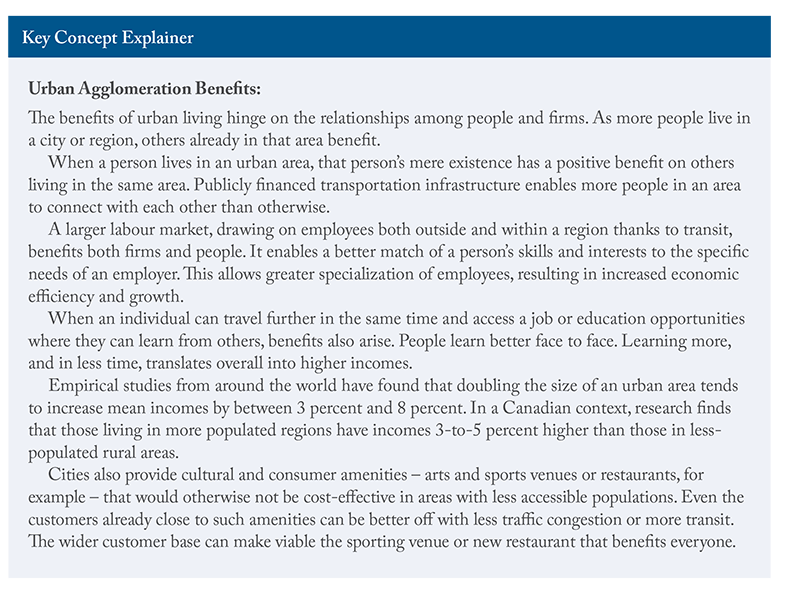
Urban agglomeration combines two economic concepts: scale economies and externalities. Scale economies arise as a benefit that increases alongside production or output. Urban scale externalities arise when a firm’s costs decrease or its benefits increase through no action of its own, but as its surrounding market becomes larger because of the location decisions of others. This is a positive externality.
The benefits of urban living hinge on the relationships among people and firms. As more people live in a city or region, others already in that area benefit. Jane Jacobs (1969) is perhaps the most famous writer to show how firms in one industry benefit from the proximity of firms in another industry. As well, agglomeration economies have been the subject of a large body of recent academic literature (see Jales, Jiang, and Rosenthal 2020 for the most up-to-date empirical study that shows these agglomeration benefits continue to exist). Indeed, the benefits of co-location drive urban life.
When a person lives in an urban area, that person’s mere existence has a positive benefit on others living in the same area. Publicly financed transportation infrastructure enables more people in an area to connect with each other than otherwise and enhances that agglomeration externality effect. We will break out these urban agglomeration benefits between first-order ones to people who take transit versus second-order benefits that accumulate to people who don’t take transit. Agglomeration economies benefit – both first and second order – from three main sources.
1. Labour Market Pooling
A larger labour market benefits both firms and people. It enables a better match of a person’s skills and interests to the specific needs of an employer. This allows greater specialization of employees, resulting in increased economic efficiency and growth. Akin to how workers can be more productive when they specialize in a factory or office setting, a larger city allows more opportunities for specialization. That makes residents more productive and richer. Another benefit of a larger labour market is that can reduce risks for both employees and firms, allowing both to be less dependent on their existing relationships (Overman and Puga 2010, Duranton and Jayet 2011). In these cases, the first-order benefit is to the worker who takes on the new job, and the second-order benefit is to employers (and the firm’s owners) who find a more productive employee as well as to the firm’s other employees who benefit from having more productive colleagues. (How much of this can be recaptured by work-from-home technologies is an open question).
2. Learning in Cities
Another classic example of urban agglomeration externalities can be seen in peer-to-peer learning. When an individual can travel further in the same time and access a job or education opportunities where they can learn from others (and teach, which creates a second-order benefit to those they travel to), there is an inherent benefit from this knowledge gain. Knowledge dissemination is most effective in close proximity, and is akin to a public good.11As Marshall (1890) put it, having ideas “in the air.” People learn better face to face. Learning more, and in less time, translates overall into higher incomes. One proof is that a given patent is more likely to be cited by another patent from the same city (Rosenthal and Strange 2004). Workers also accumulate more valuable experience in larger cities, leading to higher incomes (de la Roca and Puga 2017). Furthermore, not only is it true that working in the city centre allows people to earn higher wages, but the experience gained in these agglomeration centres is transferrable to rural areas as well, as workers with experience in urban areas maintain those gains when they move out of cities.
3. Sharing in Cities
In an urban area, firms and people can share inputs such as infrastructure, supplier networks or other services (Holmes 1999). Cities also provide cultural and consumer amenities – arts and sports venues or restaurants, for example – that would otherwise not be cost-effective in areas with less accessible populations. Even the customers already close to such amenities can be better off with less traffic congestion or more transit. There may be enough of those extra people that need transit or less congestion to make viable the sporting venue or new restaurant that benefits everyone. In other words, transportation investment benefits can be region-wide and the potential beneficiaries can be far away from the investment site.
For example, suppose a new transit service makes it feasible for someone to travel into your neighbourhood to have dinner at your favourite restaurant, which before the transit improvement would have taken them too long. These travellers receive a first-order benefit of travelling and enjoying a unique service. Suppose this person dining at the restaurant is the person on the margin that makes said restaurant financially viable. The immediate benefit to you is that your favourite restaurant remains open. This is a second-order benefit to the firm and other customers that place a high value on a service that can be viable only with the scale economies facilitated by transit.
The Evidence of Agglomeration Benefits
Taking all these positive externality effects together,12We do not have the ability to empirically distinguish among the various components of agglomeration economies in the aggregate empirical analysis. what is the total effect of urban agglomeration on income? Empirical studies from around the world have found that doubling the size of an urban area tends to increase mean incomes by between 3 percent and 8 percent, with the latest US results showing benefits of 4.5 percent for the most educated (Rosenthal and Strange 2004, Jales, Jiang, and Rosenthal 2020). However, it is not immediately clear whether larger populations result in people earning higher incomes or whether people with higher incomes tend to locate in areas with larger populations. In order to test which way the causality runs, a number of researchers (Ciccone and Hall 1996, Combes et al. 2010) have looked at historically large cities and found that larger populations result in higher incomes and not vice-versa.13They do this by using what are known as instrumental variable techniques. This approach deals with the potential issue in which a factor that researchers cannot control for is correlated with both urban size and incomes. After using instrumental variables to isolate a factor that determines urban size, but not incomes, these studies show that the causality predominantly runs from larger city size to higher incomes, and not vice versa. Because previous studies have found which way the causality runs, we do not need to replicate their instrumental approach.
In a Canadian context, Beckstead et al. (2010) find that those living in more populated regions have incomes 3-to-5 percent higher than those in less-populated rural areas. They also show that the direction of this causal relationship to be the same, aligning Canadian findings with those elsewhere in the world.
In net terms, are people better off from agglomeration economies? That is, does the cost of living increase as much or more than the agglomeration benefits? The answer depends on how much housing is built. In the most recent and comprehensive study of how municipal costs rise with population, Combes, Duranton and Gobillon (2019), using French city data, find costs rise about equally with agglomeration benefits in small towns and faster than agglomeration benefits in larger urban areas such as Paris. The key factor influencing rising costs are constraints on the urban land area available for housing, therefore increasing housing costs. They further find that increasing land area for housing in parallel with population growth decreases urban cost growth by half with respect to population, which is their measure of how increasing housing supply is critical to increasing agglomeration’s net benefits. With sufficient housing built to respond to increased demand, agglomeration economies can have a net benefit to residents.14Housing supply policies, such as reducing direct costs for builders or speeding up approvals, is covered elsewhere (Dachis 2018).
Natural advantages – such as the location of natural resources – explain only about 20 percent of the reasons why people locate in proximity to each other (Ellison and Glaeser 1999). Regardless, workers clustering together in urban areas is so important that some economists think it is the cause of the tectonic shift in economic inequality across regions, particularly in the US (Moretti 2012). Agglomeration forces are particularly strong in certain sectors, such as finance or technological industries (United Kingdom Department for Transport (DFT) 2005). As Moretti argues, urban areas in recent decades such as New York City or Silicon Valley have prospered, while other cities have stagnated, such as those in more rural parts of California outside of commuting range from high-growth areas like San Francisco. They lacked the right mix of people in industries with the strongest agglomeration potential..
Applying Agglomeration Economics to Transport
This Commentary’s findings are based on the methodologies laid out in DFT (2005), which outlines how best to apply agglomeration economics to improvements in transit infrastructure. Since DFT, several studies (Beyazit 2015, Knowles and Ferbrache 2016, Weisbrod, Mulley, and Hensher 2016) have shown the importance of calculating the wider economic benefits (or wider economic costs) of investment in transit infrastructure, noting that this analysis is complementary to traditional cost-benefit analysis (CBA), capturing the agglomeration benefits that CBA cannot. Transit investment decision documents in Canada are starting to include these wider economic benefits. For example, Metrolinx includes them in its Business Case Guidance as of 2018, but requires they be reported separately. However, they have notably not been included in the Metrolinx (2020b) cost-benefit analysis of the proposed Ontario Line.
Dachis (2013) notes that traditional CBA estimates of improved transit infrastructure and reduced congestion underestimate their true impact because they ignore the aforementioned agglomeration externalities. Poor transit infrastructure and congestion can make too costly urban interaction that leads to jobs that better match peoples’ skills, sharing knowledge face to face and demand for more business, entertainment and cultural opportunities. In the Greater Toronto and Hamilton Area, he finds that these lost benefits can equate to as much as $5 billion a year in lower wages. Similarly, Dachis (2015) calculates the wider economic benefits of a proposed large-scale transit investment project in Metro Vancouver, finding that the investment could raise the income of Vancouver workers collectively by up to $1.2 billion annually, or by $950 per worker.
The Size of Agglomeration Benefits
These theoretical benefits of urban agglomeration can be applied to Canadian policymaking relatively straightforwardly. In our analysis, we apply agglomeration economics to policy issues around both the immediate and long-term consequences of COVID-19 and reduced transit use, the economic benefits of increased investment in transit and the wider economic effect of fare increases reducing travel.
Our appraisal of transit’s wider economic benefits starts with estimating agglomeration’s impact on household earnings. We use basic econometric tools to show that the average annual household income of a given GTA area increases by 0.42 percent as the surrounding labour force within 50 kilometers increases by 10 percent.15To be specific, we regress average household income on the surrounding labour force within 50 kilometers (in natural logarithmic form). We control for the share of population having obtained a post-secondary education, the share without secondary school education, unemployment, and the number of children and non-citizens. See online Appendix for more detail. This model is similar to that used in Dachis (2013, 2015). Similarly, this suggests that doubling the labour force in the surrounding 50 kilometers results in a 3 percent increase in household income.16For doubling population size, we exponentiate two by the elasticity of population within 50 kilometers, 0.042 (see online Appendix for regression results). The exact distance that we use to assess agglomeration economies is not a major factor. The opposite can be said of cutting the surrounding labour force in half, such as through a reduction in the number of people available to work. Our findings based on 2016 census data show a relationship between city size and income similar in magnitude to existing literature, suggesting that our results are in line with both international and domestic evidence (see online Appendix).17Given the finding in a number of previous studies that this relationship is causal, we do not test for causality or reverse causality in our model. Beckstead et al. (2010) test for this, concluding that causality stems from urban size, not income.
Below we present a series of estimates of the agglomeration benefits provided by the TTC based on different scenarios: (a) if the TTC did not exist at all, (b) the effect of reduced travel during the pandemic, and (c) the effect of reduced service during this time.
Agglomeration Benefits Provided by the TTC
We estimate the TTC’s overall wider economic benefit through its facilitating an agglomeration economy across Toronto. In this way, people in the GTA benefit from the TTC providing access to locations that would otherwise be too distant to reach by walking. The TTC’s total wider-economic agglomeration benefit for people in each traffic zone of the GTA (as shown in the online Appendix) is the multiplied product in dollar terms of the following:
- the percentage increase in surrounding population for which the TTC otherwise allows travel access to compared to walking;18We estimate this as the change in population between the ages of 15 and 64 accessible when taking transit in comparison to when trips are taken on foot. These distances average 17.3 kilometres and 1.2 kilometers, respectively, across all GTA traffic zones. See the online Appendix for further explanation. That is, we assume that in this first scenario when transit is unavailable, that those who use transit when made unavailable travel only by foot. Later scenarios will present scenarios based on using other modes in place of transit or walking, such as cars.
- the average individual employment income of people in that traffic zone; and
- the assumed rate of income increase that results from an increase in access to surrounding population, as calculated above.
We prorate the total wider economic benefits in each traffic zone by the share of population that takes transit regularly.19This is obtained from the 2016 Transportation Tomorrow Survey available at http://dmg.utoronto.ca/transportation-tomorrow-survey. We then sum these prorated benefits across all traffic zones. As shown in Table 1, this yields a total TTC agglomeration benefit of almost $2.7 billion per year in the GTA. This figure reflects the benefits that would be lost if the TTC did not exist and people were restricted in travelling only as far as they were previously willing to walk. This external benefit is sizable given that the TTC’s operating expenses in 2019 were $1.9 billion. Furthermore, this benefit is on top of the $1.3 billion in fare revenues, suggesting the overall economic benefit of the TTC is even more substantial.
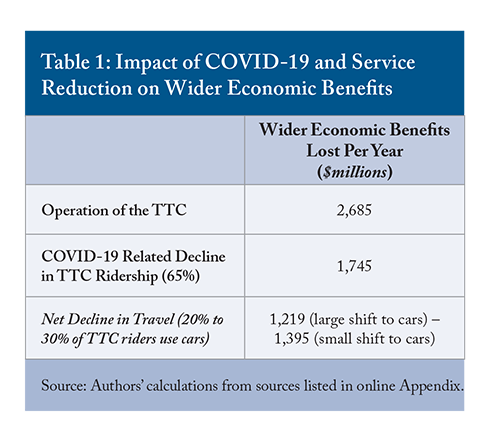
This $2.7 billion almost certainly overestimates the actual value the TTC provides in agglomeration benefits as it does not reflect that many people have access to modes of transportation beside walking or taking transit. They could switch to these alternatives if the TTC stopped operating – namely, cycling, driving alone or carpooling.20As noted elsewhere, the analysis here does not include the economic benefit of other aspects of transit. Taking this into consideration, we calculate the lost benefit recaptured by the share of transit users that would choose to make the shift to other modes of travel, specifically driving and cycling. Following the findings of previous studies that examine the shift to other modes of travel when public transit is suddenly not available (Fuller et al. 2019, Nguyen-Phuoc et al. 2018), we find that shifting to other modes of travel if the TTC were not in operation would allow current TTC users to recapture more than $800 million in benefits. This brings the total benefit provided by the TTC, taking into account the actions transit users might take in its absence, to about $1.75 billion annually (see online Appendix for details on these calculations).21See the online Appendix for further methodological explanation.
COVID-19 and Service Reductions’ Impact on Transit’s Wider Economic Benefits
In the short-term, the COVID-19 pandemic has drastically changed the way transit is used in the GTA. Many who would usually commute to work are at home as their companies shifted to work-from-home models and their offices temporarily closed. Lockdown measures have further limited the extent to which people travel and make use of TTC services. At its lowest point, Toronto transit demand fell 85 percent, causing the TTC to drop service levels to 80 percent (Spurr 2020, Wanek-Libman 2020). As of mid-December 2020, while the TTC’s operational service levels were nearing normal levels at 95 percent, demand was up from the pandemic’s bottom, but still at only 29 percent of pre-pandemic levels (TTC 2020). Lost revenue, service reductions and, in turn, potential cost reductions for the TTC beg the question of how reduced demand and the accompanying service reductions will impact the agglomeration benefits usually catalyzed by its operation.
To determine how the pandemic-related losses in ridership and service reductions are impacting these benefits, we use TTC data to prorate the prior wider-economic benefit calculations. As of Feb. 19, 2021, (when calculations for this project were finalized) total ridership across Toronto was down two-thirds (65 percent) according to Google mobility data, while service levels are still 97 percent of normal. To determine the lost benefit due to the decline in ridership (which combines lost work-related travel and less desire to travel on a potentially high-exposure transit trip), we multiply total wider-economic benefits by the percentage loss in ridership – 65 percent. We find that that lockdown measures, like work-from-home protocols and other driving factors behind the decline in demand for transit, are costing nearly $1.75 billion a year in forgone agglomeration benefits. This figure is most comparable to our first $2.7 billion estimate of the TTC’s value, reflecting a 65 percent loss in agglomeration benefits.
To account for the fact that some transit riders abandoned TTC services and instead chose to drive, cycle, walk or work-from-home to limit their potential exposure to COVID-19, we also calculate the benefits provided by shifting to these other transportation modes. Following literature on a sudden removal of transit service in cities with similar transit options as Toronto (Melbourne, Australia and Philadelphia, as described in Fuller et al. 2019, Nguyen-Phuoc et al. 2018, Appendix), we estimate that between 20 percent and 30 percent of TTC users switched to cars for trips traditionally taken on transit, yielding agglomeration benefits of between $360 million and $540 million.22The literature does not provide clear evidence of the shift to working from home that we could apply in the current circumstance. Shifts from TTC travel to cycling yield much more modest benefits of about $2.5 million. In total, this brings the net loss in wider economic benefits due to lost ridership to between $1.2 billion and $1.4 billion per year.23This is found by adding the benefit from shifts to other modes of transportation to the lost benefits accruing from the decreased demand for transit – a loss of $1,745 million plus the retained benefit of $526 million by taking cars if 30 percent switched to cars – yielding a net loss of $1,219 million in wider economic benefits. If 20 percent of TTC users switch to cars, the net decline in agglomeration benefits is $1,395 million.
The impact of such lost ridership due to the pandemic is the immediate loss in agglomeration-related productivity. The post-pandemic outlook for lost agglomeration economies due to reduced travel demand is much more subject to uncertainty. Although outside the scope of this study, the above analysis of lost ridership can be an element of future economic analysis on the impact of work-from-home policies. Other aspects, such as environmental policy, cost savings from transport, social policy, etc., all factor into the overall assessment.
Lost Wider Economic Benefits in Context of COVID-19 and Future Work-from-Home Trends
The lost economic benefit from reduced transit leading to lower agglomeration benefits is large – but what do the numbers in Table 1 mean in context of the overall GTA economy? Using our measures of the labour force and income (see online Appendix), we estimate that our study area had an annual $264 billion economic size pre-COVID-19. The City of Toronto in our measure had a $102 billion economy. As a share of the overall region, our lowest decline measure that reflects travellers switching to other modes of transit results in about a 0.5 percent loss of the total economy (1.2/264). In comparison, national GDP growth lost year-over-year for September of 2020 was 3.9 percent.24See Statistics Canada Table 36-10-0434-01. However, the economic cost to the City of Toronto is larger. About 90 percent of TTC riders are from the City of Toronto – prorating the minimum cost of $1.2 billion by the share of riders in the City of Toronto results in lost agglomeration benefits representing 1.1 percent of GDP.
The other countervailing trend against beneficial agglomeration economies is potential productivity improvements from working at home. In a survey analysis of US workers in 2020, Barrero, Bloom and Davis (2020) find that employees value working from home as equivalent to 8 percent of pay. That is, when asked for the survey workers are happy to take less pay increases in the future to stay at home. Similarly, the authors’ early estimates suggest a 2.4 percent increase in personal productivity from employees working at home. Critically, though, these estimates do not consider the external agglomeration effect. Indeed, early evidence from Bartik et al. (2020) shows US business owners seeing a reduction in productivity.25See Barrero, Bloom and Davis (2020) for a summary of early evidence available so far on the economic benefits of working from home.
Offices will still be occupied post-pandemic, although there is likely to be a reduction in commercial building rents, which will have a longer-term effect of less future office construction (Glaeser 2020b). The latest evidence from US cities is bearing this out (Rosenthal, Strange, and Urrego 2021). In US transit-heavy cities, pre-COVID-19, doubling employment density led to firms paying 13 percent more in rents, reflecting the agglomeration benefit of working downtown. That rent premium has fallen by nearly three points, which is more of a fall than in US cities more heavily dependent on car usage. These rent cost savings have knock-on effects for employees. Using pre-COVID-19 data, Stanton and Tiwari (2021) find that remote workers paid 2.4 percent more in housing expenses. This reflects the net balance of lower transport costs with the need for more space. They find that this higher cost for workers offsets one-third of the office rent savings.
What is the most economically efficient net outcome of the work-from-home model? A theoretical model that takes into account knowledge spillovers (Behrens, Kichko, and Thisse 2021) finds that increasing the amount of telecommuting from an exceptionally low amount can increase productivity in the long run. But beyond a threshold point of working from home, i.e., more than 20 percent to 40 percent (one to two days per week), it reduces productivity (Behrens, Kichko, and Thisse 2021). Knowledge spillover losses occur mainly in the long run. Indeed, there are no such immediate losses in the short-term, as knowledge takes time to accumulate and deploy. Therefore, the lack of immediate knowledge spillover economic loss sends the wrong signal about the long-term loss of agglomeration benefits.
The Implications for Transit Operator Funding
What does all this mean for Canadian transit operators? Returning to offices for most, although not all, of the time will make workers and firms better off economically, considering how they would trade lower wages for the benefit of working remotely. That general return to the office will mean, according to the model in Behrens, Kichko and Thisse (2021), an associated 60 percent to 80 percent travel return that, in turn, will restore nearly all the agglomeration benefits lost during the pandemic. Meanwhile, firms are paying less to locate in downtown areas in transit-reliant cities (Rosenthal, Strange, and Urrego 2021). The net effect is that somewhat less travel demand, along with the resulting lower fare revenues for operators, is still consistent with an economically optimal outcome.
However, the existing physical infrastructure of cities will change through new investments only slowly as developers slow down new construction in response to market rents, meaning there will be a disconnect between the optimal physical transit networks and what they are now. As a result, a strong case can be made for continued government support for transit operators to cover the difference between revenues at 100 percent capacity and those collected at the optimal level of working remotely until transit operations re-orient to meet post-pandemic demand.
The Wider Economic Benefits of Investment in Transit Infrastructure
The above analysis showed how agglomeration improves the merits of maintaining existing transportation services. But how does agglomeration affect the case for capital expansion? Following DFT’s methodology, we calculate the agglomeration benefits of transportation improvements for workers who become more productive by being surrounded by transit options (the first-order benefit) or being able to interact with more people (the second-order benefit).26Unlike previous C.D. Howe Institute studies (Dachis 2013, 2015), we estimate only the economic benefit of transportation investments and measure the economic welfare enhancing benefits of transit itself. Specifically, we do not measure the effect of people moving to the GTA, which previous papers included in their estimates.
To estimate how new investment in existing transit infrastructure creates additional wider economic benefits, we use service improvements detailed in the TTC’s 5-Year Service Plan as well as service improvement data provided by the TTC on existing and soon to be introduced services. We estimate the benefit of the transit improvements by first predicting the number of TTC users who would have access to parts of the GTA that would otherwise be too. A service improvement increases effective travel speed and, therefore, riders can travel further in the same amount of time. There are benefits to both people who use the improved services (the first-order benefits we estimate) and to the residents of areas that live in the areas newly accessible to these transit riders (see online Appendix for details and formulas).
Table 2 breaks down the benefits resulting from planned improved TTC infrastructure, which total $377 million when fully in place. In present-value terms, with an interest rate of 3 percent and an infrastructure lifespan of 50 years, the total agglomeration benefits are about $10 billion. Although this is less than the infrastructure construction costs, these are benefits that would be on top of those included in traditional cost-benefit analysis. The addition of the Line 5 Eglinton Crosstown (the orange line in Figure 3) and Line 6 Finch West LRT (the grey line in Figure 3) along with new express bus services and improved bus service headways (throughout Toronto) contribute $61 million in first-order and $119 million in second-order benefits per year. The automation of train service on the existing Line 1 (yellow line in Figure 3) provides $98 million in first-order benefits and $99 million in second-order benefits annually across the GTA.27See the online Appendix for details and maps plotting first- and second-order benefits for these service improvements.
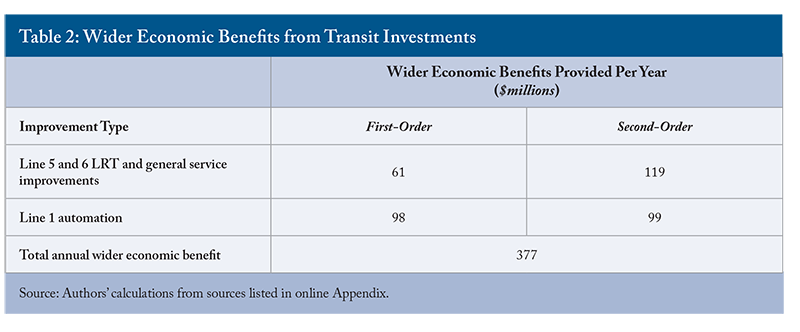
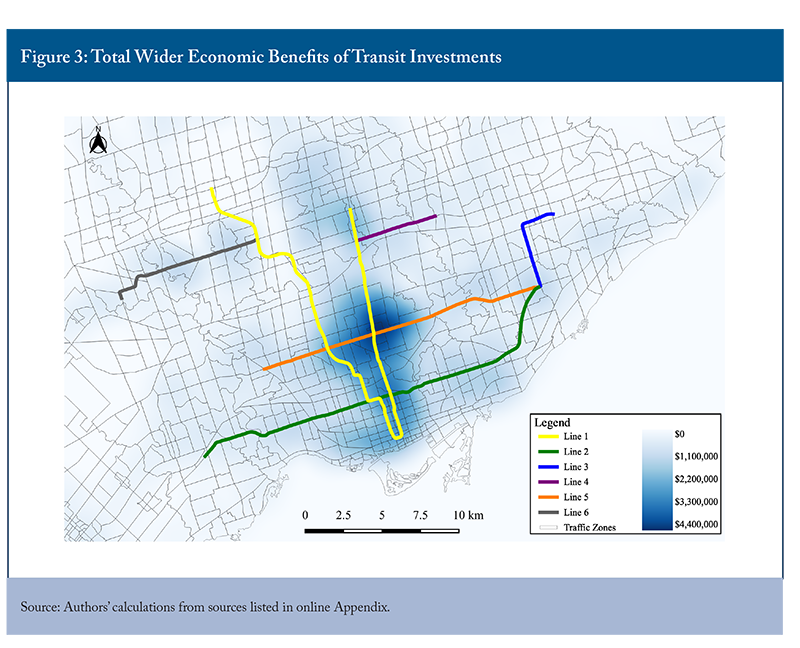
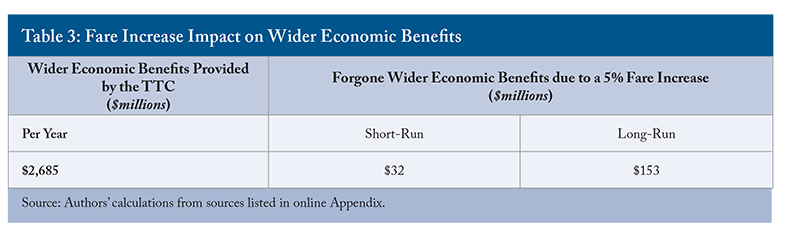
Figure 3 plots the wider economic benefits that accrue to each traffic zone from all the service improvements noted in Table 2, which in total add up to $377 million per year. Benefits are largest immediately near the terminus stations at most all lines. Furthermore, these benefits are most dense where Line 1 and Line 5, the new Eglinton Crosstown LRT, meet – at Eglinton Station. This is where several bus routes that will be replaced fully, or partially, by line 5 start and end.
We also see wider economic benefits in most traffic zones located along the Finch-Union stretch of Line 1, between Eglinton and Union stations. And we see the impact of improved bus service in the top right area of the map, in Scarborough. Lastly, those living near Line 2 – likely users of the service – also see large benefits that arise primarily as second-order benefits from the expansion of bus services and the new LRT lines.28See the online Appendix for additional figures that plot separately the wider economic benefits. Nearly three-quarters (72 percent) of the total economic benefits accrue within the City of Toronto, with the remainder occurring in surrounding municipalities.29This is a lower share than the 89 percent from the TTC’s City of Toronto ridership because of the second-order benefits that accrue to people who may not use transit.
The Wider Economic Cost of a Fare Increase
Following the findings of Li, Kasraian and Shalaby (2020), which use data from 99 Canadian transit agencies between 2002 and 2016 to investigate the determinants of transit demand, we consider both the short- (six-to-12 months) and long-run (eight or more years) impact of a fare increase on transit demand. These travel changes include people not making a trip at all because of the higher fare, which results in lost agglomeration benefits, and people switching travel modes, which reflects a loss of agglomeration benefits.30Because these elasticities reflect travel changes that may result in agglomeration benefits still materializing, these estimates are likely an overestimate of the foregone agglomeration benefits. Based on their findings, which should be interpreted cautiously given they are based on pre-COVID-19 fare elasticities, we use a short-run fare elasticity of -0.24 and a long-run elasticity of -1.13. These elasticities imply that a 1 percent increase in fares leads to a 0.24 percent and 1.13 percent reduction in transit demand, respectively.31These are elasticities that represent a wide range of transit agencies. The elasticity that TTC users have for transit usage based on price may differ. Table 3 shows the estimated impact of a 5 percent fare increase on wider economic benefits. We estimate the total wider economic benefits forgone from the fare increase by prorating the TTC’s total wider economic benefits ($2.7 billion, from Table 1) by the loss in ridership from a fare change. We find that in the short-run, a 5 percent fare increase leads to a 1.2 percent ridership decline, which is responsible for about $32 million in forgone wider economic benefits (1.2 percent of $2.7 billion). In the long-run, which sees potentially very high elasticities, the ridership loss is far more substantive at 5.7 percent, resulting in the loss of more than $150 million in wider economic benefits (5.7 percent of $2.7 billion).
Policy Discussion
The wider economic benefits discussed above, both the economic cost of reduced transit use and the economic benefits of new investment, should be part of the decision-making process on supporting ongoing transit use as well as further government investment.
The Economic Case for Continued Government Subsidies
The above analysis shows that public transit investments have a large economic benefit over and above those included in traditional cost-benefit analysis. Once the virus subsides and the policy debate moves toward transit’s path forward in terms of recovery from the pandemic and future investments, these agglomeration benefits should be part of the operating and investment cost equation considered by governments and firms.
The estimates above for the impact of the TTC’s five-year service improvements are ex-post analysis of such improvements after the investment decisions have been made. However, future transit investment decisions should be based on economic analysis that includes social returns such as agglomeration. Among the various investment options, governments should initially select projects that generate the greatest positive social returns. Furthermore, they should still subsidize projects that may not make economic sense through user fees alone, up to the point that the subsidy makes an investment overall economically and socially worthwhile.
A framework that separates private returns from social returns (as used by Warner 2013) provides a useful way to consider government and private investment. Governments are the main way to support infrastructure that has positive externality benefits.32 Similarly, governments are usually best suited to stepping in with a tax or charge when something has a negative externality, such as pollution. Specifically, they collect income taxes from those who see higher incomes as a result of transit investment (although not knowing who those people are to levy higher taxes on) as a result of transit investment even if they don’t use transit. Similarly, transit investments are located in a specific location, meaning that a large amount of their economic value is reflected in higher property values. These properties will then pay higher property taxes, and governments look to levy specific taxes on such property owners to collect some of transit’s economic benefit (Dachis 2013).
The corollary to the government being the optimal funder of transit investments that have wide economic benefit is that governments are not the only source of such investment and their operational costs that have a mostly private benefit to users. When infrastructure users pay for the service they benefit from, there is no broader economic taxation cost to finance an asset (see discussion below on the marginal cost of public funds).
COVID-19 Amplifies Demand Risk in Transit
The pandemic-induced reduction in travel demand has shown that transit use is subject to risk. Future investment decisions are going to be subject to uncertainty over the demand outlook in the face of increasing requests to work from home. The reduction in travel since March 2020 and the likely post-pandemic uncertainty over transit demand is simply the latest example of transit demand being uncertain and below expectations.
Previous studies of global transportation projects have shown a demand forecasting error of up to 40 percent on many projects (Robins 2017). His review of 10 large Canadian transportation projects suggests that similar optimism pervades demand forecasts in Canada for both transit and road projects. On average, demand was 17 percent below forecast, and for the eight projects where governments fully bore demand risk, demand averaged 33 percent below forecast. Projects with a partial revenue transfer risk onto private investors had the opposite forecasting error – demand surpassed forecast, albeit slightly.
These forecasting errors have ramifications for cost-benefit analysis investment decisions in future projects. Flyvbjerg and Sunstein (2016) examined 2,062 global infrastructure projects and found that the cost-benefit ratio was overestimated by between 50 percent and 200 percent. Flyvbjerg, Bruzelius and Rothengatter (2003) found evidence that project promoters have systematic optimism bias in their forecasts, leading to hopeful estimates instead of re-evaluations of whether projects are worth the money. The uncertainty over future transit usage due to COVID-19 further magnifies these demand risks.
How Do Governments Offload Some of the Risk in Investment in This Sector?
Transit-demand risk points to the need for transit agencies to take steps to mitigate the exposure that taxpayers face if future demand does not meet expectations. Involving the Canada Infrastructure Bank and private capital should improve demand forecasting by increasing accountability for the estimates. A private-sector investor has a substantial investment riding on the accuracy of the demand forecast, and his or her performance is judged on that rate of return, ample incentive to evaluate forecasts very carefully. The consequences to governments of cost overruns are less existential: higher taxes or higher deficits that are only a part of the judgment voters make of government performance.
While Canadian cities struggle to fund and finance their own infrastructure investments, Canadian institutional investors, notably the seven largest Canadian public pension plans as well as global investors, are looking to participate in new user-fee-supported infrastructure – both in existing assets and in new projects. As of 2018, Canada’s largest pension plans have invested $98 billion of their $1 trillion-plus assets in infrastructure, but mostly abroad. Meanwhile, Canadian and foreign institutional investors, such as pension funds and insurance companies, would likely place a high value on Canadian user-fee-financed infrastructure, but Canadian governments have opened few opportunities for such investment (Dachis 2018). A greater role for pension and other private investors, as well as the Canada Infrastructure Bank (which is already involved in transit in Canada in Montreal and in the suburban Toronto rail network), can help mitigate the risk to taxpayers of future demand uncertainty. These groups can manage risk through competitive tension in bidding and supervision of costs and by questioning lenders’ assumptions. Indeed, if the Canada Infrastructure Bank and other bidders are invited to participate in infrastructure investments and choose not to invest, that is a strong signal of the demand outlook.
As Robins (2017) argues, the key question is whether the value of risk transfer – both of demand risk and in project execution – from governments to investors outweighs the higher costs of private capital and contracting. This is particularly true in a post-COVID-19 world if investor risk premiums have increased. Similarly, contracts should ascertain what kinds of risks are best placed on private developers; i.e., which are best for an infrastructure bank like the Canada Infrastructure Bank and which are best for governments to take on directly. For example, risks around housing development associated with transit investments and avoiding expensive scope changes, are largely business decisions that specific actions by the investor can mitigate. Other risks, such as those related to the social and broader benefits of transit, are more appropriately borne by governments. If governments selecting transit projects deem the wider economic benefits (such as agglomeration) to be large, they can subsidize private providers. Giving them a stable subsidy flow may counteract the uncertain demand and make a risky (but socially beneficial) project worthwhile for investors. Governments can also take other steps to reduce risk, such as encouraging more housing construction along transit lines, improving certainty in regional/local transit-planning decisions and clarifying long-term funding plans.
What Is the Overall Cost of Fare Increases or Government Subsidies?
The above analysis highlights the economic cost of raising fares and subsequently reducing travel. The alternative of relying on government subsidies also has a wider economic cost. This wider cost is because a government subsidy requires that municipal revenues increase to finance a shortfall.
Raising taxes imposes a cost on the overall economy, lowering the social rate of return. When a government raises an additional dollar of revenue through taxes to finance an infrastructure project – whether through income tax, fuel taxes, a consumption tax or any other tax not directly related to the use of infrastructure – it affects a firm or person’s decision-making. This cost is an economic harm because as a result, for example, a firm may put off hiring decisions or a consumer may delay spending decisions. One measure of this harm is known as the marginal cost of funds (Dahlby and Ferede 2016).
The specific kind of economic damage caused by raising revenues depends on the tax. The marginal cost of funds measures the change in economic behaviour due to the government raising additional revenue and varies by the type of tax, with corporate income and other business taxes usually having the highest cost and consumption taxes having the lowest.
In 2019, the TTC had revenue ridership of $525.5 million. Riders paid an average of $2.39 per fare. A 5 percent increase in fares would amount to a 12-cent net increase. The estimated net revenue gain in the year following a 5 percent fare increase would be approximately $62 million, taking into consideration the short-run resulting loss in ridership.33Following the findings of Li, Kasraian and Shalaby (2020), we use a short-run fare elasticity of -0.24 and a long-run elasticity of -1.13. These elasticities imply that a 5-percent fare increase leads to a 1.2 percent and 5.6 percent reduction in transit demand, respectively. The estimated short-term reduction in wider-economic benefits would be $32 million, while the longer-term reduction would be $152 million, as discussed above.
The flat-rate fare structure used by the TTC is least reactive to changes in fares. Existing studies have shown that commuter rail transit, which usually has zone- or distance-based fares, can see demand reductions as a result of a fare increase that are nearly three times that of bus and light rail transit service (Iseki and Ali 2018, Litman 2004, Liu, Wang, and Xie 2019).
A proper cost-benefit analysis of a fare increase would compare the alternative economic cost of other ways to finance the revenue gap, including the economic cost of reduced service.34This would be similar to the scenario presented in Table 1 of a 6 percent service reduction. However, the exact cost savings from that service reduction is outside the scope of this analysis. The decision should also layer in other social and economic elements not analyzed here, such as effects on fares for children, the disabled, low-income communities, etc. The wider economic cost of the tax revenue to fill a $62 million gap would depend on the exact marginal cost of the increased tax funds to fill the hole. The marginal cost ranges from as low as around $2 of economic cost for every dollar of sales tax revenue raised to as high as more than $5 in economic cost from revenues raised from land transfer or business property taxes (Dachis 2018).
The latest estimate of sales taxes’ marginal cost is $1.92, meaning that $68 million in increased taxes would result in in $136 million in economic cost, compared to the short- and long-term costs of $32 million and $153 million in lost wider economic benefits from fare increases. That is, the only scenario in which it is wiser economically (trading off only agglomeration economies and the marginal cost of public funds) to subsidize transit to prevent a fare increase is if there are very high elasticities of travel demand with respect to fares and governments are relying on low-cost tax tools such as a consumption tax.
Increases in land transfer or business property taxes would result in more than $375 million in wider economic costs, making the case for subsidies weaker still. The exact marginal cost of funds will vary based on a city’s revenue mix and the taxes increased or the value of other city services that are of lower value and can be cut. Alternatively, cities can rely on other user fees, such as driver congestion charges that either have no broader economic cost or can actually reduce economic harms by reducing traffic.
Conclusion
COVID-19 has had a dramatic effect on the public transportation sector. This is true both in the short-term while the pandemic rages but also in the long run as businesses and households reconsider their long-term locations and travel decisions. As governments make decisions on transit operations and investment, the economic benefits of agglomeration should be an explicit part of the cost benefit analysis. Without including these wider economic benefits, future decisions may result in under investing in economically critical transportation infrastructure. If Canadian businesses over invest in moving toward more working-from-home setups, this will result in losses in agglomeration’s wider benefits. The outcome will be less economic growth. Governments can mitigate against this incentive for companies to move toward a work-from-home model by continuing to invest in transportation that makes it easier for Canadians to travel in urban areas.
The authors thank Jeremy Kronick, Rosalie Wyonch, Grant Bishop, Drew Fagan, Pierre Pyun and the Toronto Transit Commission for comments on an earlier draft. The authors retain responsibility for any errors and the views expressed.
References
Barrero, Jose Maria, Nicholas Bloom, and Steven Davis. 2020. “Why Working from Home Will Stick.” Becker-Friedman Institute Working Paper 2020-174. December.
Bartik, Alexander, et al. 2020. “What Jobs are Being Done at Home During the Covid-19 Crisis? Evidence from Firm-Level Surveys.” NBER Working Paper No. 27422.
BC Auditor. 2013. “Shaping Transit's Future in British Columbia.” Accessed at: https://www.bcauditor.com/pubs/2013/report4/shaping-transits-future-british-columbia
Beckstead, Desmond, et al. 2010. “Cities and Growth: Earnings Levels across Urban and Rural Areas: The Role of Human Capital.” Statistics Canada. Catalogue no. 11-622-M – No. 020.
Behrens, Kristian, Sergey Kichko, and Jacques-François Thisse. 2021. “Working from home: Too much of a good thing.” VOX CEPR. February 13.
Beyazit, Eda. 2015. “Are wider economic impacts of transport infrastructures always beneficial? Impacts of the Istanbul Metro on the generation of spatio-economic inequalities.” Journal of Transport Geography 45: 12-23.
Bloom, Nicholas, et al. 2014. “Does Working from Home Work? Evidence from a Chinese Experiment.” The Quarterly Journal of Economics 130 (1);165–218.
Boyer, Marcel, Eric Gravel, and Sandy Mokbel. 2013. The Valuation of Public Projects: Risks, Cost of Financing and Cost of Capital. Commentary 288. Toronto: C.D. Howe Institute. September.
Ciccone, Antonio, and Robert E. Hall, 1996. “Productivity and the Density of Economic Activity.” American Economic Review 86 (1): 54-70.
Combes, Pierre-Philippe, et al. 2010. “Estimating agglomeration economies with history, geology, and worker effects.” In Agglomeration Economics, pp. 15-66. University of Chicago Press.
Combes, Pierre-Philippe, Gilles Duranton, and Laurent Gobillon. 2019. “The Costs of Agglomeration: House and Land Prices in French Cities.” The Review of Economic Studies 86 (4): 1556–1589.
Dachis, Benjamin. 2013. Cars, Congestion and Costs: A New Approach to Evaluating Government Infrastructure Investment. Commentary 385. Toronto: C.D. Howe Institute. July.
_____________. 2015. “Tackling Traffic: The Economic Cost of Congestion in Metro Vancouver.” E-Brief 206. Toronto: C.D. Howe Institute. March.
_____________. 2018. “A Roadmap to Municipal Reform: Improving Life in Canadian Cities.” C.D. Howe Institute Policy Study. October.
Dahlby, Bev, and Ergete Ferede. 2016. The stimulative effects of intergovernmental grants and the marginal cost of public funds. International Tax and Public Finance 23(1), 114-139.
de la Roca, Jorge, and Diego Puga. 2017. “Learning by Working in Big Cities.” CEPR Discussion Paper 9243. Center for Economic and Policy Research. Accessed at: https://academic.oup.com/restud/article/84/1/106/2669971
Duranton, Gilles, and Hubert Jayet. 2011. “Is the Division of Labour Limited by the Extent of the Market? Evidence from French Cities.” Journal of Urban Economics 69 (1): 56-71.
Ellison, Glenn, and Edward L. Glaeser. 1999. “The geographic concentration of industry: does natural advantage explain agglomeration?” American Economic Review 89 (2): 311-316.
Flyvbjerg, Bent, Nils Bruzelius, and Werner Rothengatter. 2003. Megaprojects and Risk: An Anatomy of Ambition. Cambridge, U.K.: Cambridge University Press.
Flyvbjerg, Bent, and Cass Sunstein. 2016. “The Principle of the Malevolent Hiding Hand; Or, the Planning Fallacy Writ Large.” Social Research 83 (4): 979–1004.
Fuller, Daniel, et al. 2019. “Impact of a public transit strike on public bicycle share use: An interrupted time series natural experiment study.” Journal of Transport & Health 13: 137-142.
Giuliano, Genevieve, Sanggyun Kang, and Quan Yuan. 2019. “Agglomeration economies and evolving urban form.” Annals of Regional Science 63: 377-398.
Glaeser, Edward L., and Matthew G. Resseger. 2010. “The complementarity between cities and skills.” Journal of Regional Science 50 (1): 221-244.
Glaeser, Edward L. 2020a. “Cities and Pandemics Have a Long History.” City Journal. Spring.
_____________. 2020b. “Infrastructure and Urban Form.” NBER Working Paper 28287. December.
Holmes, Thomas J. 1999. “Localization of Industry and Vertical Disintegration.” The Review of Economics and Statistics 81(2): 314-325.
Iseki, Hiroyuki, and Rubaba Ali. 2015. “Fixed-effects panel data analysis of gasoline prices, fare, service supply, and service frequency on transit ridership in 10 US urbanized areas.” Transportation Research Record 2537 (1): 71-80.
Jacobs, Jane. 1969. The Economy of Cities. Vintage Books.
Jales, Hugo, Boqian Jiang, and Stuart Rosenthal. 2020. “Separating Selection From Spillover Effects: Using the Mode to Estimate the Return to City Size.” Working Paper. Department of Economics and Center for Policy Research, Syracuse University.
Knowles, Richard D., and Fiona Ferbrache. 2016. “Evaluation of wider economic impacts of light rail investment on cities.” Journal of Transport Geography 54 (2016): 430-439.
Kronick, Jeremy, and Paul Jenkins. 2021. “From Here to Full Inoculation: How an Epidemiological-Economic Model Can Help as We Rollout Vaccines.” C.D. Howe Institute Working Paper. February.
Li, Lisa, Dena Kasraian, and Amer Shalaby. 2020. “Empirical Analysis of Long-Run Elasticities and Asymmetric Effects of Transit Demand Determinants.” Transportation Research Record 2674 (8): 274-284.
Lindquist, Kathy, Michel Wendt, and James Holbrooks. 2009. “Transit farebox recovery and US and international transit subsidization: synthesis.” Washington: Washington State Department of Transportation.
Litman, Todd. 2004. “Transit price elasticities and cross-elasticities.” Journal of Public Transportation 7 (2): 3.
Liu, Yan, Siqin Wang, and Bin Xie. 2019. “Evaluating the effects of public transport fare policy change together with built and non-built environment features on ridership: The case in South East Queensland, Australia.” Transport Policy 76: 78-89.
Marshall, Alfred. 1890. Principles of Economics. London: Macmillan and Co.
Metrolinx. 2018. Business Case Guidance. March.
Metrolinx. 2020a. “How COVID has impacted transit – Metrolinx releases ridership map covering all GO Transit rail routes.” November 19. Accessed at: https://blog.metrolinx.com/2020/11/19/how-covid-has-impacted-transit-metrolinx-releases-ridership-map-covering-all-go-transit-rail-routes.
_____________. 2020n. “Ontario Line Preliminary Design Business Case.” December. Accessed at:: http://www.metrolinx.com/en/regionalplanning/projectevaluation/benefitscases/2020-12-08-Ontario-Line-PDBC-Public-Final.pdf
Miller, Caroline, and Ian Savage. 2017. “Does the demand response to transit fare increases vary by income?” Transport Policy 55: 79-86.
Moretti, E. 2012. The New Geography of Jobs. Houghton Mifflin Harcourt.
Nguyen-Phuoc, Duy Q., et al. 2018. “Exploring the impact of public transport strikes on travel behavior and traffic congestion.” International journal of sustainable transportation 12 (8): 613-623.
Overman, Henry, and Diego Puga. 2010. “Labour Pooling as a Source of Agglomeration: An Empirical Investigation.” In Glaeser, Edward L., ed. Agglomeration Economics. The University of Chicago Press: Chicago.
Rice, Patricia, Anthony J. Venables, and Eleonora Patacchini. 2006. “Spatial determinants of productivity: analysis for the regions of Great Britain.” Regional Science and Urban Economics 36 (6): 727-752.
Robins, Steven. 2017. Banking on Infrastructure: How the Canada Infrastructure Bank Can Build Infrastructure Better for Canadians. Commentary 483. Toronto: C.D. Howe Institute. June.
Rosenthal, Stuart S., and William C. Strange. 2004. “Evidence on the nature and sources of agglomeration economies.” In Handbook of Regional and Urban Economics 4: 2119-2171. Elsevier.
Rosenthal, Stuart S., William C. Strange, and Joaquin Urrego. 2021. “Are City Centers Losing Their Appeal? Commercial Real Estate, Urban Spatial Structure, and COVID-19.” Working Paper. Department of Economics and Center for Policy Research, Syracuse University. January 26.
Spurr, Ben. 2020. “What to expect from historic TTC service cuts coming next week over the COVID-19 crisis.” The Star. Accessed at: https://www.thestar.com/news/gta/2020/05/05/what-to-expect-from-historic-ttc-service-cuts-coming-next-week-over-the-covid-19-crisis.html
Stanton, Christopher, and Pratyusj Tiwari. 2021. “Housing Consumption and the Cost of Remote Work.” NBER Working Paper No. w28483. February 24.
TTC. 2020. “Latest News on Covid” Toronto Transit Commission. Accessed at: https://www.ttc.ca/COVID-19/Latest_News.jsp
United Kingdom Department for Transport. 2005. Transport, Wider Economic Benefits, and Impact on GDP. Discussion Paper. July.
Venables, Anthony J. 2007. Evaluating Urban Transport Improvements: Cost-Benefit Analysis in the Presence of Agglomeration and Income Taxation. Journal of Transport Economics and Policy 41 (2): 173-188.
Verbich, David. 2016. Affordable and fair? Analyzing Transit Fare Purchases, Service Quality, and Affordability and Their Implications for Social Equity. Master’s Thesis, School of Urban Planning McGill University. Accessed at: http://tram.mcgill.ca/Teaching/srp/documents/DavidV.pdf
Wanek-Libman, Mischa. 2020. “TTC Implements Second Phase of Cost Cutting Plan, Lays off 450 Employees.” Mass Transit Magazine. Accessed at: www.masstransitmag.com/management/article/21139620/ttc-implements-second-phase-of-cost-cutting-plan-lays-off-450-employees
Warner, Andrew M. 2013. “A Framework for Efficient Government Investment.” International Monetary Fund Working Paper WP/13/58. February.
Weisbrod, Glen, Corinne Mulley, and David Hensher. 2016. “Recognising the complementary contributions of cost benefit analysis and economic impact analysis to an understanding of the worth of public transport investment: A case study of bus rapid transit in Sydney, Australia.” Research in Transportation Economics 59: 450-461.
Wessel, Nate. 2020. “TTC Funding.” Accessed at: https://github.com/Nate-Wessel/TTC-funding
Policy Area: Public Investments and Infrastructure.
Related Topics: Crown Corporations and other Government Enterprises; Public-Private Partnerships.
To cite this document: Dachis, Benjamin, and Rhys Godin. 2021. Trains, Lanes and Automobiles: The Effect of COVID-19 on the Future of Public Transit. Commentary 598. Toronto: C.D. Howe Institute.
C.D. Howe Institute Commentary© is a periodic analysis of, and commentary on, current public policy issues. Michael Benedict and James Fleming edited the manuscript; Yang Zhao prepared it for publication. As with all Institute publications, the views expressed here are those of the authors and do not necessarily reflect the opinions of the Institute’s members or Board of Directors. Quotation with appropriate credit is permissible.
To order this publication please contact: the C.D. Howe Institute, 67 Yonge St., Suite 300, Toronto, Ontario M5E 1J8. The full text of this publication is also available on the Institute’s website at www.cdhowe.org.