


- Canada’s tax system has contributed to weak economic performance over the past decade, as the country has recorded the slowest per-capita income growth in the G7 while relying heavily on personal and corporate income taxes that impose relatively high economic costs.
- This report proposes a sweeping, “big bang” reform that would restructure Canada’s tax system to improve growth, reduce distortions, and simplify compliance and administration. At the federal level, it would lower marginal personal income tax rates, introduce an optional simplified $10,000 tax credit to reduce complexity, and overhaul corporate taxation through either a 10 percent “Irish-style” rate with base broadening or a 13 percent distributed profits tax that defers federal taxation on retained earnings until profits are distributed.
- The reform is designed to be revenue-neutral in the short term. To offset lower income tax rates, it would shift toward less distortionary sources of revenue, including either a modest increase in the GST or the introduction of a new employer-paid payroll tax dedicated to healthcare, thereby reducing reliance on economically harmful income taxation.
- Over the long run, the reforms could increase non-residential capital by roughly $140 billion and raise GDP by approximately $79 billion (about 2.5 percent), generating more than $26 billion annually in additional tax revenues while preserving Canada’s strong redistributive outcomes.
Introduction
“For a nation to try to tax itself into prosperity is like a man standing in a bucket and trying to lift himself up by the handle.” – Winston Churchill
Tax policy is a powerful policy tool for shaping an economy. The primary aim of taxation is to raise revenue to fund well-managed public services. However, taxes discourage whatever we choose to tax. Some taxes create more economic harm than others. If governments rely on a poorly designed tax structure to raise revenue, they unnecessarily undermine economic prosperity and make it harder for the economy to sustain the public services voters expect.
After a decade of virtually stagnant per capita economic output, tax reform and broader growth reforms are now on the front burner once again. The need for bold growth-oriented policy changes has become even more acute in light of US “America First” tariff policies, geopolitical tensions, and higher private and public debt financing costs. The federal government promised an “expert review” of the corporate tax system in the last election, but it is absent from its first budget. The budget includes enhanced tax depreciation allowances for a few sectors. We argue that Canada needs a much broader and more comprehensive reform effort.
Several tax reform efforts have been successful in the past. Some were initially unpopular – such as the adoption of the Goods and Services Tax (GST) in 1991 – but were later judged successful because they ultimately improved the economy while providing the government with more stable revenue. The federal and provincial income tax reforms of 1972, 1985–87,11 Corporate tax reform began with the 1985 budget and was completed in 1987 when personal income tax reform was also introduced in reaction to the 1986 Reagan tax reforms in the United States. and 2000 lowered tax rates and broadened the base, creating a more neutral and fair system that benefited the economy. By contrast, reforms that raise rates or provide preferences for politically favoured activities increase complexity, raise economic costs, and worsen fairness. As American actor and humorous social commentator Will Rogers, once said: “The difference between death and taxes is death doesn’t get worse every time Congress meets.”
In this paper, we propose several “big bang” tax reforms to promote greater Canadian prosperity. We emphasize “big bang” because Canada urgently needs to reorient its economy onto a more prosperous path. These reforms are politically difficult, especially if the aim is to maintain the same level of revenues. The winners from revenue-neutral reform are often silent while the losers strongly oppose any shift in tax burdens. If tax reform is undertaken with some loss in revenue, paired with spending reductions, the reform becomes easier since most taxpayers will be winners.
While our focus is on growth and simplification, we do not ignore fairness. By fairness, we mean both (i) a level-playing field with an equal treatment of equals and (ii) distributing tax burdens according to ability to pay. Canada already achieves the lowest degree of inequality among G7 countries after accounting for taxes and transfers. However, it has also had the lowest per capita growth rates among all G7 countries in the past three decades. Thus, our emphasis is on pro-growth tax reform, given the heightened concern that Canadians have over the economy, with little change in households’ average tax rates.
Below, we set out the case for “big bang” tax reform. Canada relies too much on personal income taxes with high marginal tax rates at relatively low levels of income compared to other G7 countries. These rates discourage work effort, risk-taking, and investment, and they encourage Canadians to migrate abroad. The corporate income tax no longer provides an advantage for locating businesses in Canada and distorts the allocation of capital markedly to its most profitable use. Unlike other major countries, Canada relies too little on taxes that cause less economic harm, such as the GST (which itself could be improved) and payroll taxes.
Our “big bang” reform includes four major recommendations that work together as a package while relying less on the most economically damaging taxes, relying more on those that are less harmful, and improving the taxation of corporate income. In designing this package, we have sought to ensure it remains implementable, even if politically challenging, and that does not compromise Canada’s high level of income redistribution:
- Reduce marginal personal income tax rates and widen income brackets. Federal income tax rates would begin at 14 percent for incomes up to $60,000, 20.5 percent for incomes between $60,000 and $180,000, and 26 percent on incomes above $180,000. Provincial rates would apply in addition to the federal rates: the top rate on average would be 45 percent, similar to a decade and a half ago.
- Introduce an optional simplified $10,000 tax credit. Taxpayers could choose this credit instead of itemizing numerous deductions and credits. This policy would especially benefit most low- to mid-income taxpayers and simplify the tax system.
- Reform the corporate income tax to remove preferences. We explore two options. The first reduces the federal corporate income tax rate by five points to 10 percent with the elimination of tax incentives including accelerated depreciation, the small business deduction, and tax credits. The second option exempts retained earnings reinvested in business activities and taxes only distributed book profits at 13 percent. This would result in a substantially lower tax cost on investment for all businesses and encourage venture capital and research. Given that three- to four-fifths of the corporate income tax falls on labour incomes, the reform will improve wages for workers.
- Offset reduced reliance on income taxation by increasing less harmful taxes. We propose either a 2.8-point increase in the GST or a new employer payroll tax at the rate of 3.22 Gross National Income is a better measure of prosperity for residents of a country. It is measured as GDP minus payments to non-residents plus payments received by residents from other countries. This measure is especially important for measuring prosperity since it eliminates net payments to foreign investors. percent of pay earmarked for healthcare, similar to many European countries and the United States. The payroll tax would apply to payroll and self-employed earnings above $15,000 earned by each individual and therefore fall more on higher earnings.
Our reform will increase investment by $140 billion in the long run and GDP by $79 billion. This analysis holds federal revenues constant in the short term. Naturally, if governments also moderated business grants or other spending, they could reduce taxes further and improve neutrality with respect to business taxation and grant support.
Over time, as economic activity increases due to the tax reform, the reform could yield over $26 billion in additional tax revenues annually across all levels of government.
What Ails the Canadian Tax System?
Over the past decade, Canada has had the worst growth in per capita Gross National Income (GNI)2 compared to G7 countries and some selected Organisation for Economic Co-operation and Development (OECD) countries (Table 1). In 2023, Canada’s per capita GNI was $45,796 (in 2021 international dollars), below the average of high-income countries of $56,964 and only 74 percent that of the United States.
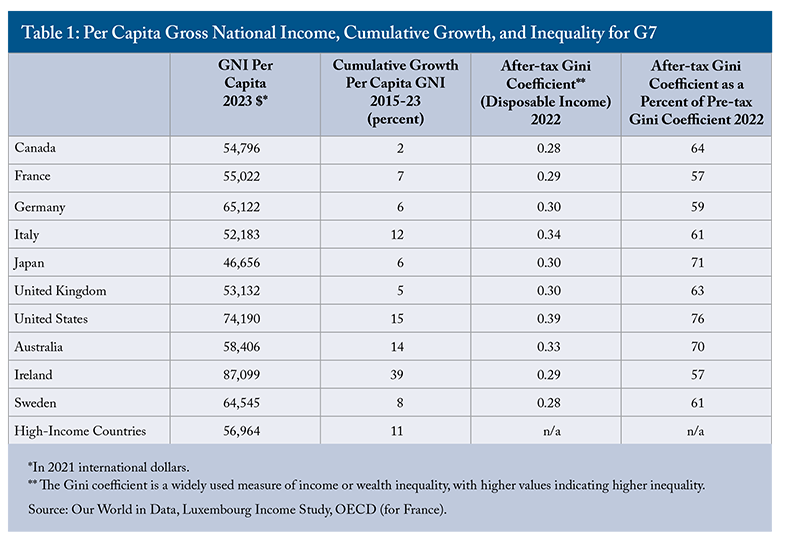
Canada’s real growth in per capita GNI has virtually stalled in the past decade, with only a 2 percent cumulative gain. Ireland is one of the fastest-growing high-income countries and has one of the highest per capita GNIs in the OECD, surpassing even the United States. (We discuss below how taxation impacted Ireland’s growth). Australia, resource-intensive like Canada, did better with higher cumulative growth at 14 percent and a per capita GNI that was 6.5 percent higher than Canada’s in 2023. Sweden, also resource-rich and with low taxes on capital income under a “dual income tax” system, performed better than Canada. Its per capita GNI was 18 percent higher than Canada’s.
While Canada’s record on economic growth this past decade has been disappointing, it has a much better record in redistributing income once accounting for taxes and government transfers. On an after-tax basis, Canada has the lowest income inequality among the G7 countries, tied with Sweden as of 2022. If we measure the impact of redistributive polices by taking the ratio of the after-tax to pre-tax Gini coefficient,33 The Gini coefficient is a measure of inequality ranging from 0 (complete equality) to 1 (complete inequality). The after-tax Gini coefficient is based on market incomes plus government transfers net of taxes. The pre-tax Gini coefficient is based on market income only. Canada’s fiscal system reduces inequality by 36 percent from 0.44 to 0.28.44 However, income inequality measures that include transfers and taxes as in Table 1 do not include free or subsidized public services like healthcare and education, accrued or realized capital gains on the sale of assets and business taxes/subsidies that can be shifted onto labour or capital owners. While France, Germany, Ireland, and Sweden redistribute even more, they have achieved superior economic growth to Canada. The United States has grown faster in per capita GNI but has the highest after-tax inequality and the least redistribution through its tax and transfer system.
From this analysis, we conclude that Canada’s focus for tax reform should be on economic growth, while limiting the burden on those with less ability to pay. Below, we lay out the existing problems with the tax system that impair economic growth.
Canada’s Tax Competitiveness Challenge
Ignoring non-tax revenues like user fees and royalties, Canada’s tax revenues are about 35 percent of GDP as of 2023, higher than the OECD average (Table 2). If social security taxes that fund mainly pension benefits (and in some countries, health insurance) are ignored, Canada’s tax burden stands at 29.6 percent of GDP – the highest of the G7 and OECD average. Taxes are much higher than in the United States, our most important trading partner, whether social security contributions are included or not. This gap compounds Canada’s competitiveness challenge, as pre-tax per capita GNI in Canada is about three-quarters of US levels (as noted in Table 1).

Income taxes account for about half of revenues collected in Canada: 37 percent from personal income taxation and 14 percent from corporate income taxation. Sales taxes account for another 22 percent of taxes paid in Canada, while payroll and social security taxes account for a further 16 percent. Canada relies more heavily on personal and corporate income taxes as a share of GDP (18 percent, the highest in the G7) than the OECD average (12 percent) or the United States (12 percent). Canada is light in taxing consumption with sales and excise taxes at 6.9 percent of GDP compared to the OECD average of 10 percent. In the United States, sales and excise taxes account for only 4 percent of GDP. Canada and the United States also rely less on payroll and social security taxes (5.2 and 6 percent of GDP respectively) compared to the OECD (9 percent) and other G7 countries. Canada’s economic growth is harmed by relying on a tax structure heavily focused on income taxes, which impose a higher economic cost than consumption or payroll taxes.
Canada’s Over-Reliance on Personal Income Taxes
As noted above, Canadian federal and provincial governments rely disproportionately more on personal income taxes (PIT) compared to other revenue sources. As shown in Figure 1, the increased reliance on PIT began after the Second World War. In 1965, governments collected less PIT (5.8 percent of GDP) than sales and excise taxes (8.5 percent). By 1970, PIT revenues had risen to about 10 percent of GDP and peaked at 12 percent by the mid-1980s. In response to mounting deficits and debt, governments pushed PIT revenues to record highs in the late 1980s and 1990s – reaching 13 to 14 percent of GDP, almost double the revenue from sales and excise taxes. After falling during the 2000s, PIT revenues have been rising again, growing from 11 percent of GDP in 2010 to 13 percent in 2023. Today, PIT is almost twice the size of any other source of federal or provincial taxes.

PIT rates in Canada are progressive.55 The top combined federal/provincial marginal tax rate is roughly 53 percent in British Columbia, Ontario, and Quebec, and is greater than 50 percent in 8 of 10 provinces (roughly 48 percent in Alberta and Saskatchewan). The top tax rate is generally applied at incomes around 2.8 times the average wage in 2024 (see OECD Data Explorer). In contrast, the US applies a top rate of 44 percent at 8.8 times the average wage. Income earned on retirement assets (including pensions, registered retirement savings plans [RRSPs], tax-free savings accounts [TFSAs], and principal residences) is tax exempt. Dividends and capital gains are taxed preferentially to mitigate double taxation at the corporate and personal levels. However, capital gains face lower top rates than eligible or ineligible dividends, which encourages taxpayers to recharacterize income as capital gains rather than dividends to minimize personal income tax.
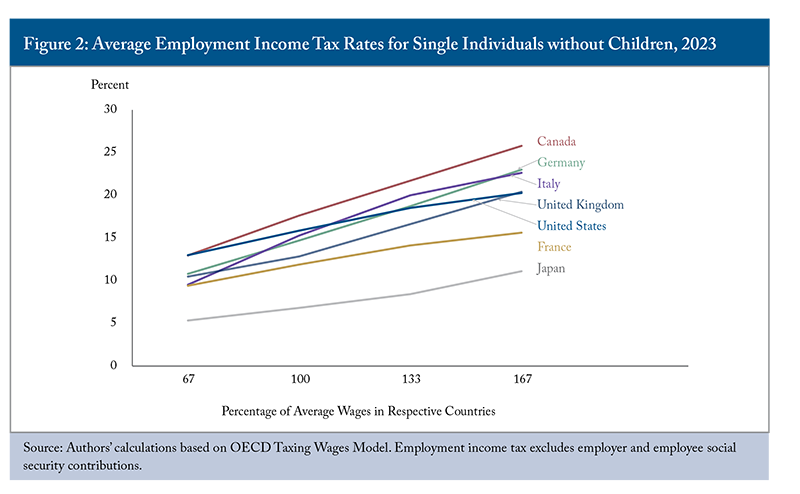
Given Canada’s greater reliance on PIT as a share of GDP than any other G7 country, Canada’s PIT average tax rates on employment income (Figure 2) are correspondingly higher across much of the income spectrum. According to OECD data, Canada’s income taxes as a share of wages and salaries for single individuals without children are higher at the average-wage scenario up to the top income scenario.
Canada’s Corporate Income Taxes No Longer Provide a Distinct Advantage
Corporate tax competitiveness has concerned policymakers for decades. Canada faces two distinct disadvantages for investment: a small population dispersed across a large landmass along its southern border, which limits economies of scale, and a cold climate (Mintz 2003). The Technical Committee on Business Taxation (1997) recommended a corporate tax rate below that of other countries and a more neutral tax system to create a policy advantage to attract investment and profits while reducing economic distortions in the tax system. While much focus is on the United States, the current federal government’s desire to diversify trade means that Canada needs to create a distinct policy advantage to attract investment compared to many countries today.
Since the May 1985 budget, when corporate tax reform was proposed, Canada has embarked on a series of corporate income tax reforms to reduce rates and broaden tax bases. Initially, reform was intended to improve market efficiency and reduce tax erosion due to tax preferences. However, after the 1986 Reagan corporate tax reform in the United States that reduced the federal rate by 12 points (from 46 to 34 percent), corporate tax reform was also pushed by the potential loss of investment and corporate income to the United States. By 1988, the federal general corporate income tax rate was lowered from 36 to 28 percent and investment tax credits, inventory allowance, and depreciation deductions were scaled back. With a federal surtax of about one point and provincial tax rates of 14 points, the general rate topped at 43 percent.
As other countries were reducing corporate income tax (the US rate was about 39 percent), Canada had the highest corporate income tax rate among industrialized countries by the end of the 1990s (Canada 1997). Concerned about base erosion and competitiveness, governments reduced corporate income tax rates again. By 2012, the federal general rate had fallen to 15 percent and provincial rates ranging in 2026 from 8 percent in Alberta to 15 percent in Newfoundland and Labrador and Prince Edward Island, with tax preferences also reduced. Canada enjoyed a clear advantage over the United States until 2018, when the US Tax Cuts and Jobs Act lowered the federal corporate rate by 14 points, from 35 to 21 percent. Including state taxes, 2026 US corporate rates range from 21 percent (e.g., Ohio, Texas, and Washington) to 30.1 percent in New Jersey.
CIT revenues have therefore been affected by both economic conditions and corporate tax reforms. CIT revenues fell from 4 percent of GDP in 1975 to 2 percent following a deep recession that ended in 1992 (Figure 1). They rebounded in the next decade as profitability improved and corporate tax reforms in 1986-87 lowered rates while eliminating or scaling back many tax preferences. With robust profitability, CIT revenues remained relatively stable from 2000 to 2020, despite reductions in statutory rates. Since 2020, CIT revenues have risen again, reaching 4.7 percent of GDP.
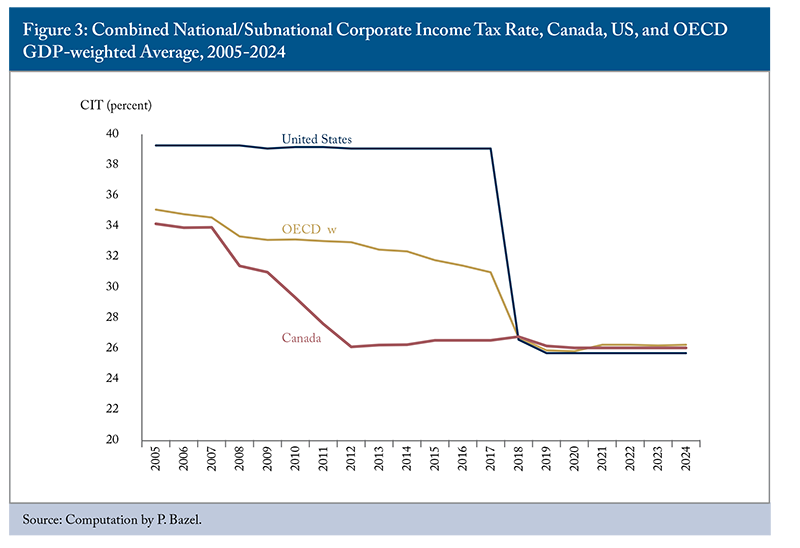
As shown in Figure 3, Canada achieved a significant tax advantage in 2012 by lowering the combined federal-provincial corporate income tax rate well below the GDP-weighted OECD average. However, that advantage has since disappeared. The US rate cut in 2018 – particularly significant given the US share of roughly one-quarter of global GDP – eliminated Canada’s statutory rate advantage entirely. By 2024, Canada’s combined corporate tax rate stood at 26.1 percent, virtually identical to the OECD weighted average, while the US rate was 25.7 percent.66 OECD Corporate Tax Database. 2025. https://data-explorer.oecd.org/vis?lc=en&fs[0]=Topic%2C1%7CTaxation%23TAX%23%7CCorporate%20tax%23TAX_CPT%23&pg=0&fc=Topic&bp=true&snb=15&df[ds]=dsDisseminateFinalDMZ&df[id]=DSD_TAX_CIT%40DF_CIT&df[ag]=OECD.CTP.TPS&df[vs]=1.0&dq=.A.CIT_C.ST..S13%2BS1311%2BS13M..&lom=LASTNPERIODS&lo=1&to[TIME_PERIOD]=false&vw=tb.
The effect of taxation on investment depends not only on the statutory tax rate but also on tax incentives, such as accelerated depreciation and investment tax credits. Other taxes on capital, such as sales taxes on capital inputs, real estate and financial transfer taxes, property and asset-based taxes, also affect capital decisions. Even these taxes do not tell the whole picture. Payroll taxes on labour and fuel and carbon taxes on energy increase input costs in production. A more complete measure to compare tax competitiveness would focus on production costs to incorporate taxation of different inputs (McKenzie, Mintz and Scharf 1997; Technical Committee on Business Taxation 1997).
Nonetheless, it is useful to consider how the profit-based taxes impact investment in Canada, particularly across sectors, to determine how they distort the allocation of capital (the finance sector is excluded due to a lack of data). Including the 2025 Budget provisions, Bazel and Mintz estimate the marginal effective tax rate (METR) on new investment in Canada to be 12.6 percent in 2025 and 18.6 percent by 2034 when the accelerated provisions are phased out.
Canada’s tax competitiveness and productivity are weakened by a distortionary corporate income tax system, which leads to a misallocation of capital. The system particularly favours forestry (including lumber and pulp and paper manufacturing activities), critical mining, and manufacturing, all of which face effective tax rates substantially lower than those of service sectors and oil and gas (Table 3).
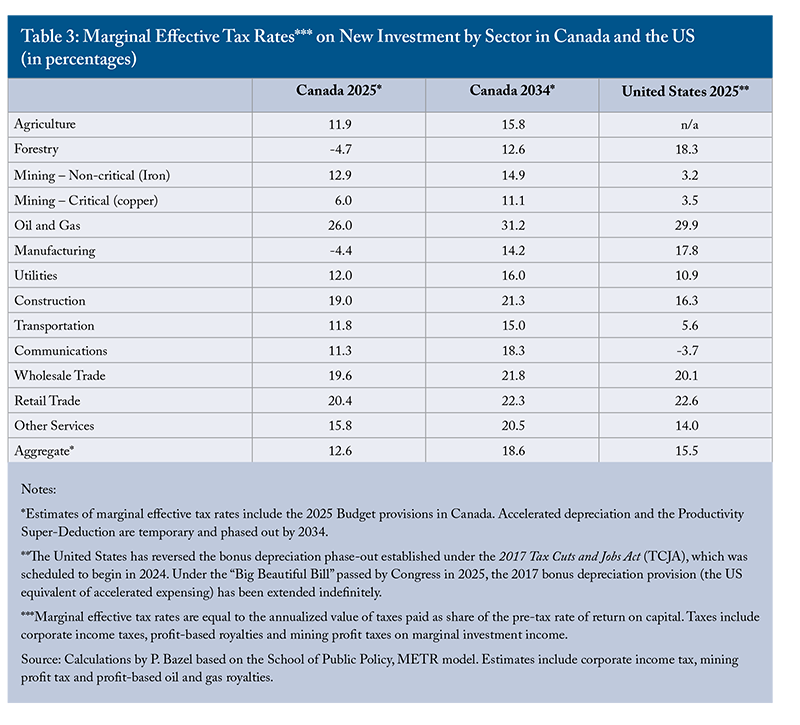
In 2025, the dispersion in effective tax rates (26.7 percentage points) is more than twice the average effective tax rate. By 2034, this dispersion falls to 20.1 percentage points with the elimination of accelerated depreciation. Eliminating accelerated depreciation and the productivity incentive would make the profit-based business tax more neutral, although effective tax rates would increase.
In some instances, tax incentives target low-growth industries. The Budget 2025 Productivity Super-Deduction particularly benefits manufacturing. Yet, despite this and previous favourable tax incentives, manufacturing has declined for other reasons, such as the shift of production to China and other Asian countries since 2000. Manufacturing value-added as a share of GDP has steadily fallen from 15 percent in 1997 to 9 percent in 2025.77 Based on Statistics Canada, Table 36-10-0449-01. Bazel and Mintz (2022) show that Canada has historically the most biased system towards manufacturing than any other OECD or BRIC country except India.
In 2025, Canada’s average effective tax rate on capital (12.6 percent) will be somewhat below that of the United States (15.5 percent). However, eight of 12 industries, including the technology-intensive communication sector, mining, utilities, transportation and construction, are currently more heavily taxed than in the United States. Once the 2025 Budget proposals expire in 2034, the effective tax rate on capital in Canada (18.6 percent) will exceed the US rate (15.5 percent), leaving nine of 12 sectors in Canada disadvantaged.
The above estimates of effective tax rates on new investment mask other distortions with the corporate income tax, including:
- Effective tax rates vary by type of investment. The system provides preferences for clean energy, research and development, and machinery and equipment that are taxed much less than structures and inventory investments.
- The estimates assume the same degree of leverage (40 percent debt financing) for all industries. Yet, given the deductibility of debt financing, the corporate tax system encourages greater leverage unless limited by thin capitalization rules.
- Given that governments take a greater share of profits than their shares in losses, income taxation discourages investment in risky enterprises, including high-tech and start-up companies.
- Foreign income, especially in low-tax jurisdictions, is typically taxed less than domestic income earned by Canadian corporations, thereby encouraging capital outflows. Foreign companies operating in Canada may be taxed more highly than Canadian companies due to withholding taxes on income remitted to foreign investors and limits on interest and other deductions, thereby discouraging foreign ownership. The new 15 percent global minimum corporate tax, including Canada’s domestic minimum tax, will raise taxes on large multinationals, though foreign investment may still receive relatively favourable treatment.
- Small businesses are given preferential corporate income and payroll tax rates. Canadian-controlled private corporations face a small business corporate rate of about 13 percent compared to roughly 26 percent for large businesses, while unincorporated business income is taxed in the hands of individual investors.
In other words, Canada’s business tax structure is a jumble of distortions that misallocate capital in the economy, with tax considerations influencing investment decisions rather than having them taken solely on the basis of economic profitability.
Efficiency Considerations
While progressive personal income tax rates play a redistributive role, high marginal rates discourage work, labour force participation, savings, and risk-taking. They can also weaken incentives for entrepreneurship and innovation and may encourage high-income earners to emigrate. Numerous studies show that personal income taxes impose a higher efficiency cost per dollar of tax revenue than consumption or property taxes (Table 4). This cost rises exponentially as top tax rates increase.88 The methodologies employed for the estimates reported in Table 4 vary. Baylor and Beauséjour (2004) use a calibrated general equilibrium model. Dahby and Ferede (2011, 2022) compute marginal cost of funds (MCFs) based on tax base semi-elasticity estimates as the main input. The 2011 semi-elasticity estimates are based on an instrumental variable correlated to the tax regime in place in various jurisdictions (the ruling political parties), while the most recent estimates rely on variations in the top tax rate.

Corporate income taxes are generally considered even more distortionary. Dahlby and Ferede (2011, 2022) demonstrate their high economic cost due to their impact on investment decisions and incentives for profit shifting. However, the incidence of corporate tax depends on firm size. Corporate taxes on large, internationally financed firms tend to be regressive, with much of the burden passed on to relatively immobile labour and consumers. By contrast, corporate taxes on small private firms may be progressive, since these firms’ profits often reflect returns to personal savings.
The GST is widely regarded as one of the least distortionary taxes. It does not penalize savings and has little effect on the economy, though it can reduce work incentives at low-income levels. While the GST/HST is regressive in isolation, refundable tax credits mitigate its impact on low-income households. Middle-income households bear the heaviest burden, which may explain political resistance to rate hikes.
Still, Canada’s GST/HST collects from slightly less than half the potential tax base due to exemptions and zero-rating (OECD 2024), which increases its distortionary impact. Broadening the base, as in New Zealand’s value-added tax (VAT), which collects 96 percent of potential consumption, could lower GST/HST rates by almost half while improving efficiency. Alternatively, the additional GST/HST revenue could be used to reduce more harmful taxes.
Payroll taxes fund social insurance programs like the Canada Pension Plan, Employment Insurance, and provincial workers’ compensation. Some provinces also levy general employer-paid payroll taxes. Unlike consumption taxes, which retirees also bear, payroll taxes apply only to workers and employers. Contribution ceilings also cap their fiscal and behavioural impact. About two-thirds of OECD countries use payroll taxes to fund healthcare – a potential alternative to general tax-financed health contributions (Khanal, MacKinnon and Mintz 2024). Payroll taxes are generally less distortionary than personal and corporate income taxes, especially when designed as flat contributions with benefit linkages. Expanding the role of payroll taxation, particularly for healthcare, may offer a more efficient and transparent way to raise revenue while preserving economic growth.
Complexity
Canada’s tax system is extremely complex. Originally enacted in 1917 as a six-page document, the federal Income Tax Act has expanded dramatically over the past century. On the personal income tax side, the T1 General Income Tax Return has grown to include 14 schedules and multiple sections, reflecting decades of accumulated rules and preferences. As a result, non-experts increasingly rely on accountants or specialized software, especially when reporting income beyond standard T4 employment income.
The corporate income tax system is even more intricate. The Income Tax Act devotes hundreds of pages to corporate taxation. Although the T2 Corporation Income Tax Return is nominally nine pages, corporations often complete dozens of additional schedules depending on their activities. Businesses claiming investment tax credits, carrying forward losses, or engaged in research and development must complete highly detailed forms. Frequent and layered tax changes further increase complexity.
Recent years have seen the introduction or expansion of measures such as Specified Corporate Income rules, the Tax on Split Income, Adjusted Aggregate Investment Income thresholds, the Underused Housing Tax, bare trust reporting requirements, the Excessive Interest and Financing Expenses Limitation, the Digital Services Tax, the Global Minimum Tax, the new Mandatory Disclosure Rules, updates to the General Anti-Avoidance Rule (GAAR), and a suite of clean economy investment tax credits. Each of these measures introduces additional definitions, filing obligations, and interpretive uncertainty, making compliance significantly more difficult for businesses and their tax advisors. Taxpayers must also navigate differing federal and provincial rules, further increasing compliance burdens and reliance on tax professionals.
Measuring compliance costs is difficult because they vary by taxpayer and income source. One analysis shows that the time taken to fill out the average personal income tax forms has fallen from 5.6 hours in 1985 to 2 hours in 2022 with digitization (Vaillancourt 2020). However, taxpayers increasingly purchase software or hire professionals. Vaillancourt estimates that the cost per tax return has fallen from $288 in 1985 to $138 in 2022 (in 2024 dollars). In 2022, self-employed taxpayers paid 1.7 times the average cost per form ($235), while the highest income tax filers incurred a cost 1.4 times the average ($193). Total personal income tax compliance costs reached an estimated $4.2 billion in 2022 ($4.5 billion in 2024 dollars). These estimates exclude compliance costs for other taxes including property, payroll taxes, and many tax benefits that require special forms (such as home ownership and education plans).
For businesses, the World Bank estimates that the average Canadian firm spent 131 hours per year complying with taxes in 2019.99 World Bank. Paying Taxes. 2020. https://databank.worldbank.org/source/doing-business. Data are limited to businesses in the largest city of the country. About 45 hours are spent on corporate income taxes, 36 hours on payroll taxes, and 50 hours on VAT/sales taxes. Compliance time is highest in Chile (291 hours) and Poland (260 hours). Of the G7 countries, Italy tops at 238 hours, followed by Germany (218 hours) and the United States (175 hours). Canada’s compliance time exceeds that of the United Kingdom (110 hours), Australia (105 hours), Ireland (82 hours) and Switzerland (63 hours). With an average hourly cost of $40 in 20241010 The Canada Job Bank reports the median hourly wage for chartered accountants to be $40 in 2024. Statistics Canada reports a $39 hourly wage for professional services in the fourth quarter of 2024 (Table 14-10-0442-01). The Canada Revenue Agency reports the number of corporate taxpayers as 2.645 million in 2022. https://www.canada.ca/content/dam/cra-arc/prog-policy/stats/t2-corp-stats/2017-2022/t2-crp-sttstcs-tbl01-e.pdf. Multiplying the hourly rate of $40 by the average time to pay taxes of 131 hours and the total number of corporate taxpayers (2.8 million in 2024), we derive a business tax cost of $14.7 billion. and 2.6 million corporate taxpayers, the compliance costs for business taxes in Canada are estimated to have been $14.7 billion in 2024.
Governments also incur significant administrative costs in collecting taxes. The Canada Revenue Agency’s operating budget (excluding transfer payments) is $6.2 billion as of 2024/25.1111 See CRA (2024). Provincial tax administration, court proceedings, and tax policy development add further costs. However, a rough estimate for provincial tax administration (based on Ontario tax and benefit administration in 2023/24) is $1.3 billion. Overall, compliance and administrative costs of Canada’s tax system total approximately $26.4 billion, or 2.1 percent of tax revenues. This figure likely understates the true burden, as it excludes many costs associated with tax expenditures, property taxes, land transfer taxes, and vacant property taxes.
Fairness
Tax systems strongly influence income distribution. Typically, tax fairness has been defined in terms of horizontal equity (equal treatment of equals) and vertical equity (generally measured according to the ability to pay tax). As Table 1 shows, Canada has successfully redistributed income through its tax/transfer system compared to other G7 countries.
While the system is successful in achieving vertical equity, it is less successful in achieving horizontal equity. It particularly benefits seniors relative to the working population. Crisan, McKenzie and Mintz (2015) measure effective net tax rates (taxes paid minus transfers divided by market income), on personal and corporate income, payroll, sales/excise and property taxes, and money transfers, including the Canada Pension Plan (CPP)/Québec Pension Plan (QPP), Employment Insurance, and social assistance. The richest quintile pays an average net tax rate of 34 percent, and the poorest pay a net tax of -47.7 percent.
However, working individuals pay much more tax than seniors, even in the highest quintile. For example, workers aged 25-29 in the top quintile face a net tax rate of 34.2 percent, while those between 70-74 pay less than half at 15.5 percent. Middle-income workers aged 30-34 (third quintile) face a net tax rate of 20.3 percent, compared to 7.2 percent for those aged 60-64. Even though the data are from 2015, it remains applicable today: horizontal equity is not fair across taxpayers of different age groups. None of this is particularly surprising given the transfers geared to seniors, including Old Age Security, the pension income deduction, the age credit, and pension income splitting.
Few studies consider the effect of business taxation on individual income. Theoretically, taxes are shifted to customers through higher consumer prices, workers through lower wages or layoffs, or owners through reduced capital income receipts. Corporate profits in part reflect economic rents that can be shared by capital owners and workers through wage negotiation. Foreign-owned businesses should also be considered when assessing the impact of taxes on Canadian households.
Past studies have shown mixed impacts. The company income tax has been found to be passed on by corporations as higher prices charged to consumers (Baker et al. 2020),1212 Baker et al. (2020) estimate that 31 percent of the corporate tax is borne by shareholders, 38 percent by workers, and 31 percent by consumers. or largely by reducing employment and wages paid to workers (McKenzie and Ferede 2018). An Australian government analysis on the incidence of the company tax finds that two-thirds falls on workers through lower real wages and the rest on capital owners (Rimmer et al. 2014). A German and an American study each found that about half of corporate taxes are shifted onto workers, with the balance onto capital owners (Fuest et al. 2017; Kennedy et al. 2022). Crisan, McKenzie and Mintz assume that the tax on large corporations falls primarily on workers, while owners of small corporations largely bear the corporate tax (roughly one-fifth of taxable business income is earned by corporations claiming the small business tax deduction).1313 See Department of Finance. “Tax Expenditures. Background Statistics.” 2024. https://www.canada.ca/en/department-finance/services/publications/federal-tax-expenditures/2025/part-2.html#t3.
Growth and Taxation
Canada’s tax system is ailing. It is inefficient and complex. This is certainly pertinent to the fact that Canada has had a decade of lost opportunity. Its per capita GNI growth lags all other G7 economies since 2015. Non-residential investment per worker has declined sharply, and Canada’s capital stock per worker is below other G7 countries, especially the United States (Bafale and Robson 2024). Taxes also affect labour supply, human capital accumulation, and the mobility of skilled workers.
Economic growth depends on multiple factors beyond taxation, including interest rates, regulatory frameworks, political stability, and the rule of law. Rigorous studies control for non-tax impacts when analyzing GDP effects. The online Appendix presents recent empirical work. Below is a preview of the main findings from these studies.
Growth and Employment, and Migration Effects
Extensive empirical evidence demonstrates that higher personal and corporate tax rates constrain economic performance, while lower rates promote growth and employment. The magnitudes are economically significant. Peterson and Blair (2022) estimate that each percentage point increase in US corporate income tax rates reduces per-capita GDP by over $1,000. Provincial evidence from Canada shows that corporate tax reductions have lifted GDP per capita by more than 1 percent (Ferede and Dahlby 2019). Analysis of the US Tax Cuts and Jobs Act yields GDP-level gains ranging from 0.5 percent to 1.8 percentage points (York et al. 2023; Mertens 2018).
Employment responds similarly. Duan and Moon (2025) find that Quebec’s four-percentage-point reduction in small business corporate tax rates increased employment by 1.7 percent and payrolls by 2.3 percent. Conversely, Curtis and Decker (2018) show that start-ups lose 3 to 4 percent of their workforce for each percentage point increase in corporate taxes. Personal income tax changes also influence labour markets: Ferede (2021) finds that a one-point cut in Canada’s top federal personal income tax rate increased private employment by 0.25 percent.
Migration patterns confirm that individuals and businesses respond to cross-jurisdictional tax differences. While domestic inventors show limited responsiveness to tax changes (Akcigit et al. 2016), foreign inventors and high earners are more sensitive to tax policies. Akcigit et al. (2016) and Agrawal and Foremny (2018) report that a one percent increase in tax rate results in one to two percent more emigration for these mobile skilled populations. Kalin et al. (2024) document similar migration responses among retirees relocating to Portugal, with emigration effects equal to 1.5 to 2 percent for a percentage increase in the tax rate.
Investment, Taxable Income, and Incidence Effects
Tax policy significantly influences investment decisions through its effect on the cost of capital. Hartley et al. (2025) estimate that each percentage point decline in the user cost of capital increases investment by 1.3 to 2.4 percentage points. The US tax reform experience provides additional evidence: Chodorow-Reich et al. (2023) and York et al. (2023) document investment gains of 7 to 20 percent, alongside long-run increases in corporate capital stock of 7 to 14 percent.
Taxable income exhibits considerable sensitivity with respect to tax rates, creating revenue feedback effects. Estimates for each percentage increase in the tax rate range from a 0.9 percent loss in reported income for firms (Coles et al. 2022) to over 2 percent for high-income individuals (Gorry et al. 2018). These studies imply that tax rate increases erode the tax base, reducing the revenue gains from higher rates.
Tax incidence studies reveal that workers bear substantial portions of ostensibly capital-based taxes. Corporate tax burdens fall on workers to the extent of 36 to 56 percent (Duan and Moon 2025; Kennedy et al. 2022; Fuest et al. 2017). Provincial corporate tax increases in Canada have reduced wages by more than the additional revenues collected (McKenzie and Ferede 2018). Payroll taxes show similar patterns: Canadian workers bear nearly the full burden (Deslauriers et al. 2018), while US workers bear about 58 percent (Carloni 2021).
Implications
The empirical evidence spanning the past quarter-century documented in the online Appendix consistently supports theoretical predictions about taxation’s economic effects. Higher tax rates demonstrably reduce per-capita GDP levels, constrain employment growth, discourage investment, trigger migration of mobile factors, and often fail to deliver proportional revenue increases due to base erosion. These findings highlight the importance of considering economic efficiency alongside revenue needs when designing tax policy. While taxes remain necessary to fund public services, the substantial economic costs documented in this literature review suggest that over-reliance on income taxes should be approached with caution, particularly for personal income taxes on high earners and corporate taxes.
The Need for Big Bang Tax Reform
Personal income taxes are too high. Canada no longer has a corporate tax advantage to offset other disadvantages for investment. The tax system is inefficient and complex. Further, as global trade realigns in response to US tariffs, economic growth will be a challenge in a world competing for capital.
A modest reform, such as a tax point reduction here or there, will not have much impact on the economy. Instead, we argue that Canada needs a “big bang” reform that substantially restructures the tax system to raise living standards. This is particularly important now given reduced access to the US market and the goal of trade diversification.
We realize that a “big bang” tax reform is not easy to accomplish. Some reforms involve scaling back tax preferences that will raise opposition to reform. If governments lose too much tax revenue, they will have difficulty meeting their budgets. However, a marginal reform such as the recent reduction in the lowest marginal personal tax rate to 14 percent, while welcomed by taxpayers for some relief, will not significantly improve the economy nor make it easier to balance the federal budget. Better reforms of equal revenue cost would have a larger impact on the economy by reducing reliance on the most harmful tax policies. Past major reforms, such as Ireland’s unique corporate tax strategy (see Box A), demonstrate how a “big bang” tax reform can strengthen growth while sustaining public revenues. That is our goal in the proposals below.

Big Bang Personal Tax Reform
Canada’s overreliance on personal income tax is the result of higher tax rates across the income spectrum, particularly at higher income levels. The first stage of our growth-oriented tax reform lowers personal income tax rates where they most affect growth, while also introducing a generous basic allowance. This allowance, consolidating numerous tax preferences into a simplified tax credit, will disproportionately benefit lower-income earners.
Taxpayers who would benefit more from itemizing tax provisions rather than claiming the simplified tax credit would still have the option to do so. However, a simpler system – with lower documentation and filing costs, and greater certainty of outcomes – will reduce pressure on politicians to maintain or expand special tax preferences. Many countries operate far simpler personal tax systems. In jurisdictions with fewer opportunities for tax optimization, filing is often far easier, and in some cases tax returns are automatic or unnecessary (Laurin and Dahir 2022). The simplified tax credit would move Canada toward a system where filing could eventually become much easier.
Reducing Personal Income Tax Rates
We propose reforming the federal personal income tax schedule to compress marginal tax rates at higher income thresholds while maintaining the government’s recent reduction in the lowest tax bracket. As discussed earlier, rate reductions are more economically effective at higher income levels, while the new simplified tax credit will disproportionally benefit lower-income workers. The proposed federal rate structure is presented in Table 5.
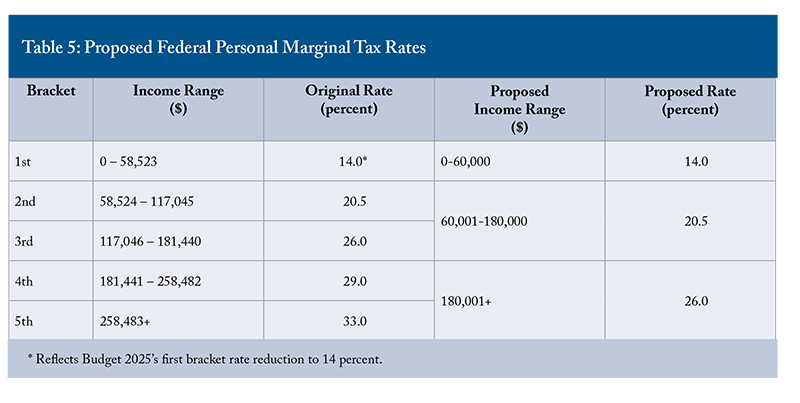
The reform lowers the marginal tax rates applying to income above roughly $117,000 while preserving current rates at lower income levels. The proposal aims to enhance economic efficiency by reducing disincentives to earn additional income, particularly among higher-income earners, where behavioural responsiveness to tax rates is well documented (see online Appendix).
Provinces may reduce, increase, or maintain their current personal tax rates. If they leave rates unchanged, the top tax rate will be, for example, 46.53 percent in Ontario and 41 percent in Alberta. These rates are somewhat above the top rates in 2011, with Ontario at 46.41 percent and Alberta at 39 percent. An important principle, argued by the Carter Report, is that top rates should be below 50 percent to balance social fairness with economic pragmatism, since high rates discourage effort, initiative, and tax compliance.
Before accounting for behavioural responses, the proposed rate changes would reduce federal personal income tax revenues by roughly $15.5 billion in 2026 (Table 6). However, taxpayers are known to respond to lower marginal tax rates. Empirical research suggests that higher-income individuals exhibit greater responsiveness to marginal tax rates through a variety of channels, including labour supply, tax planning, and income shifting. Estimates suggest that a one percent reduction in after-tax income resulting from a higher marginal tax rate would lower the taxable income of high-income individuals by approximately 0.4 to 0.7 percent – known as the elasticity of taxable income (ETI).1414 The ETI measures the percentage change in taxable income in response to a 1 percent change in the net-of-tax rate (1 − marginal tax rate).
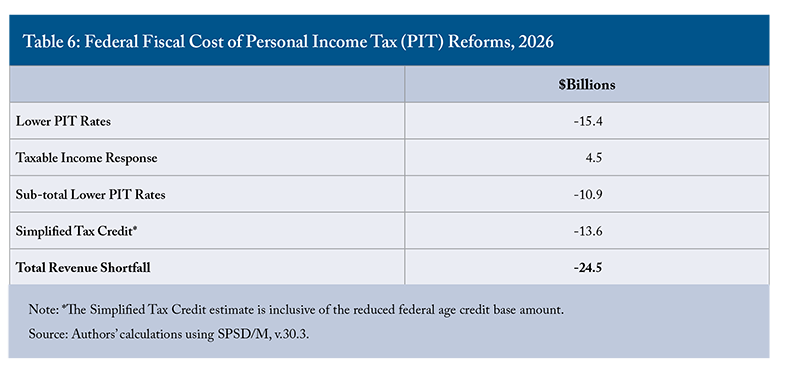
In this analysis, a 0.4 percent response for the top tax bracket is applied to reflect this behavioural adjustment, consistent with estimates from the Department of Finance and other sources (Canada 2010; Laurin 2015; Milligan and Smart 2014; Parliamentary Budget Officer [PBO] 2022). Following the PBO (2022) guideline assumptions, individuals in the fourth bracket are assigned an ETI of 0.2 percent, while those in the third bracket are assigned an ETI of 0.1 percent. These conservative response estimates were chosen to keep the focus on the fiscal cost estimates, rather than on the precise value of the ETI. After incorporating behavioural responses, the net fiscal cost of the reform is reduced by approximately one-third to roughly $10.9 billion (Table 6).1515 Dufour, Michaud, and Smart (2026) find that the effect of higher average tax rates on high-income earners is to encourage tax avoidance strategies, resulting in a stronger effect on taxable income than reducing labour supply or saving.
While immediate effects on labour supply will be modest for some taxpayers, particularly primary earners, the cumulative impact of reduced marginal tax rates can be substantial over time, particularly when considering the broader, long-run impacts on work experience, skills development, and productivity (Keane 2010). The rate reductions will also help attract high-earning talent to Canada and encourage entrepreneurs to invest in riskier ventures. By targeting rate relief where behavioural responsiveness is highest, the reform provides a more efficient path to boost productivity and strengthen long-term economic growth than broad-based cuts.
Critics argue that reducing top personal income tax rates favours higher-income Canadians. This is not surprising since higher-income taxpayers account for most of the personal income taxes paid. Those with incomes above $117,000 pay 55 percent of total personal income taxes, while those with less than $60,000 pay only 11 percent, even though the latter represent more than 60 percent of all tax filers.
Nevertheless, individuals in the first and second tax brackets would also see a reduction in the amount of personal income tax they owe, through a simplified tax credit described below.
A Simplified Personal Income Tax Credit
To reduce complexity and improve transparency, we propose a new optional non-refundable simplified tax credit that would replace numerous existing deductions and credits. The simplified credit amount would be set at $10,000 and added to the existing Basic Personal Amount. As a result, individuals could earn more than $26,000 tax-free.1616 Our reform also replaces the income-tested small enhancement to the Basic Personal Amount.
The reform would also lower the federal age credit base amount to $4,000 from roughly $9,000. Seniors today are the least likely age group to live in poverty (Statistics Canada 2022), given the importance of Old Age Security, the Guaranteed Income Supplement, and provincial credits targeted at low-income seniors. Most seniors eligible for the age credit will benefit from the new simplified credit, more than offsetting the age-credit reduction, and resulting in a net reduction in tax payable.
The simplified credit would be optional. Tax filers could claim the $10,000 simplified credit or retain access to all existing provisions by forgoing it. A limited set of targeted provisions would remain within the simplified system, namely: allowances for social security and tax-recognized savings, recognitions for work-limiting circumstances such as caregiving or disability, charitable donations, personal/corporate tax integration provisions, and expenses incurred to earn income. For those opting in, the tax form would retain only a small number of credits and deductions. These would include:
Non-Refundable Credits:
- Basic Personal Amount (and Unused Amount Transferred for Spouse/Child).
- Simplified Tax Credit.
- CPP and EI contribution credits.
- Disability and caregiver credits.
- Charitable donations credit.
- Federal dividend and foreign tax credits.
Deductions:
- RRSPs, registered pension plans (RPPs), and other tax-deferred contributions.
- Alimony paid.
- CPP/QPP on self-employment income.
- A 50 percent capital gains inclusion.
- Select employment and business-related deductions.
Filers claiming the simplified credit would forgo other provisions, including:
- Pension income splitting.
- Employment credit.
- Union and professional dues.
- Childcare expenses.
- Moving expenses.
- Capital gains exemption (LCGE).
- Tuition tax credit.
- Age and pension credits.
- Volunteer firefighter credit.
- Home accessibility and home buyers’ credits.
- Medical expenses and refundable medical supplement.
- Canada Training Credit.
- Political contributions credit.
- Investment and labour-sponsored fund credits.
- Many other narrow provisions.
By reducing line items and eligibility calculations, the simplified option would ease the tax filing burden for many Canadians, lower their compliance costs, and facilitate tax-filing automation by greatly increasing the number of people with basic tax returns. As the federal government moves to expand automated tax-filing options for low-income Canadians, the new simplified tax credit will make this process much easier, since overcomplexity is the main barrier (Laurin and Dahir 2022). Over time, it could also curb the tendency of elected officials to introduce narrowly targeted tax preferences as tools for political gain or broad policy objectives, fostering a more neutral tax system.
The new optional simplified tax credit, including the baseline reduction of the federal age credit base amount, would cost approximately $13.6 billion. We expect more than 90 percent of filers to choose the simplified credit rather than itemizing individual deductions and credits. Over time, as provinces align and taxpayers adapt, the option to itemize could be phased out, allowing the tax system to play a more limited role in social policy.
Big Bang Corporate Tax Reform
With the goal of building up productive capacity, a big-bang approach is needed to put Canada into a better position to attract investment and reduce distortions in the business tax system. There are some major revenue-neutral reforms that could improve neutrality and simplify what has become an overly complex corporate tax.
One option, following the United States, would be to expand and make permanent accelerated expensing of machinery and equipment to all business activities, beyond its current application for manufacturing, clean technology, exploration, and research and development. Expensing could also be widely implemented for all capital expenditures, including structures, inventories, and land and development expenditures in the resource sector.
However, when coupled with interest deductibility on debt used to fund capital expenditures, expensing can lead to negative effective tax rates, as the value of tax deductions exceeds the cost of purchasing capital. Expensing policies also favour short-lived capital (e.g., machinery) over long-lived capital like structures, thereby increasing distortions. Many expenditures, such as inventories and land purchases, do not qualify for incentives. Because of the richness in deductions, many companies accumulate tax losses to be carried forward against future profits. Firms may then use after-tax financing and other schemes to transfer these losses to other companies, reducing revenue predictability.
A second option is to adopt a rent-based corporate tax that allows companies to write off the cost of new equity financing, including changes in the tax value of retained earnings. A rent tax, in principle, is neutral for marginal investments since the full cost of capital is deducted. Only the return in excess of the cost of investment is subject to tax. Two approaches have been used to tax rents:
- Allowance for Corporate Equity (ACE): Firms deduct the cost of equity financing in addition to interest, while capital is depreciated.
- Cash flow tax: Firms expense capital fully which is equivalent to deducting net interest and equity financing costs.
The ACE approach has been used in a few countries, and the cash flow approach has been used as a means of levying profit-based royalties on non-renewable resource companies (as seen in Alberta’s oil sands and British Columbia’s mining profit taxes).
A rent-based approach has merit, especially if the personal tax is also converted into a tax on earnings and economic rents (above-normal returns). A personal tax would remove limits on deductions for RRSP savings (dissaving would be fully taxed), and other net capital income, including housing, would be taxed in excess of the “normal return to capital.” This is an appealing approach towards a full expenditure-based personal tax that exempts savings from taxation, but it requires greater study since it could lead to higher income tax rates being levied to maintain tax revenues. A related model is the Scandinavian “dual income tax,” which taxes capital income at rates less than labour income. For example, Norway’s top personal income tax rate is 47.4 percent, while its corporate and capital income tax rate is 22 percent.
While the rent-based approach to corporate tax alone offers an interesting way to tax all corporate investments, it is not consistent with the personal income tax system. Corporate rents would still face taxation at both corporate and personal levels, encouraging firms to recharacterize rents as wages or deductible payments. Further, deducting equity costs at the corporate level without corresponding adjustments to personal capital gains taxation would create mismatches (see Canada 1997). Investors could deduct interest personally while corporations deduct equity costs on the same financing, creating unintended advantages.1717 Multinational companies achieve a double deduction for financing costs with the ACE in Canada and associated debt interest deductions taken in other countries. The standard allowance rate for equity finance is typically tied to the government bond rate, which is lower than the true cost of equity once risk and the lack of refundability of tax losses are factored in – thereby discouraging risky investments. The risk-inclusive cost of equity finance is not easy to measure and can lead to distortions in the tax system.
Below, we suggest two types of reform: adopting an “Irish-style” low corporate tax rate or implementing a corporate tax that exempts retained profits invested in business activities from taxation (a corporate tax on distributed profits).
An “Irish” Approach to Corporate Tax Reform
Consistent with past approaches to corporate tax reform in Canada, a major reform would be to substantially reduce the corporate income tax rate while broadening the corporate tax base to eliminate as many non-neutralities as possible. Lowering the rate would reduce non-neutralities across sectors and make Canada more attractive for companies to shift investment and profits into the country. A uniform corporate rate for all businesses, large and small, would also simplify the system by eliminating the small business deduction and consolidating the two dividend tax credits into one.
The Irish approach would involve reducing the federal corporate income tax rate to 10 percent. At the same time, accelerated depreciation, investment tax credits, the Scientific Research and Experimental Development (SR&ED) credit, and the small business deduction would be eliminated. This would raise the small business rate from 9 percent to 10 percent. Eliminated incentives would also include the Atlantic Investment Tax Credit, clean economy tax credits, film and video credits, and flow-through shares. Together, these measures total $14.7 billion in 2026/27.
Table 7 provides an estimate of the revenue impact assuming no base expansion (i.e., static effect). It also presents an estimate of the behavioural response with an expansion in the tax base due to investment and profit-shifting impacts. Since the small business tax rate rises from 9 percent to 10 percent, the base will shrink somewhat. The estimated impact on small business income is based on the PBO’s estimate (a 1.2 percent loss in the tax base for a one-point increase in the tax base). The base-expansion effect of reducing the corporate income tax rate by 5 points is based on estimates by Mintz and Smart (2004) for profit-shifters (non-paying tax corporations are excluded). The estimated base-expansion effect is 10.3 percent.
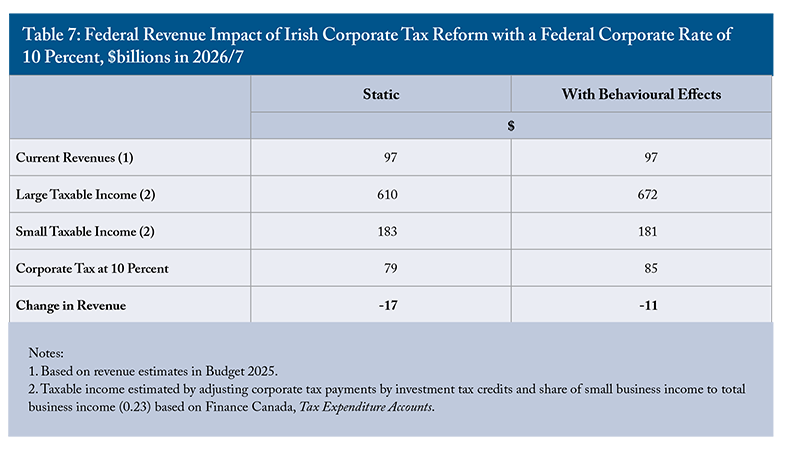
If the SR&ED tax credit were retained to encourage innovation, the revenue loss would be $5 billion more than shown in Table 7. While the Irish approach for a lower corporate tax rate is appealing by reducing non-neutralities, the impact will depend on provincial tax reforms. If provincial tax rates are reduced on average by a point to 10 percent (which is possible with base expansion), Canada’s federal-provincial corporate income tax rate would be 20 percent. However, provincial tax rates on eligible small business income are exceedingly low. Likely, provinces will not want to raise their own provincial corporate income tax rate to 10 percent on small business income, even though eliminating the small business preference would improve efficiency and fairness.
Lowering the corporate income tax rate (while raising the small business rate by one point) would also reduce the dividend tax credit that is provided to offset the corporate tax on profits before they are distributed. Similarly, since corporate taxes reduce the capital gains earned by shareholders, the exclusion rate for capital gains could be reduced as well. We do not include these revenue effects without further analysis.
The Retained Earning Exemption (Distributed Profits) Corporate Tax
We now explore a different approach: a corporate tax that exempts retained profits invested in business activities and, in other words, applies only when profits are distributed.1818 If new equity issues are treated as “negative distributions,” the proposal below would be another form of rent taxation. However, we are not recommending that new equity issues reduce the distributed profit base without a significant change to the personal tax system. This system defers corporate income tax until the income is paid out to shareholders. It would eliminate the need for preferential corporate income tax rates on manufacturing, clean energy investments, and small businesses. All types of investment – in land, structures, inventories, machinery, exploration, development, and research and development, and net financial assets – would qualify, since retained profits used to finance investment would not be taxed. Accelerated depreciation that also defers tax is redundant. To discourage corporations from accumulating cash so as to avoid personal income tax, the system would tax investment income and corporate capital gains, with a refund when profits are distributed as dividends or share buybacks.
Under a distributed profits tax, book profits from investment activities would be taxed only when they are distributed. Shareholders would then pay personal tax on net-of-corporate-tax dividends, share buybacks, or deemed corporate distributions such as non-business expenses and, if desired, certain tax haven payments.
Why Exempt Retained Earnings?
Exempting retained earnings is a departure from a comprehensive shareholder tax on corporate income. One argument to do so is based on informational market imperfections. Outside investors have less information about firms than insiders. As a result, investors put a premium on companies that have more retained profits to fund investment (Myers and Majluf 1984). Strong firms signal quality through their ability to accumulate earnings. Corporate taxation reduces retained earnings and thereby hurts investor confidence in strong companies. Further, financial constraints can have a powerful effect in discouraging investment (Fazzari, Hubbard and Petersen 1998). A recent Canadian study finds that financial constraints have a more powerful effect on investment than the user cost of capital (Bilicka 2020).
This proposed model is not perfect, but it is better than the current system. A distributed profits regime would make corporate income taxation fairer and simpler, reducing administrative and compliance costs substantially without significantly eroding corporate tax revenues. Some distortions remain, including profit-based mining taxes and oil and gas royalties. Governments might still introduce refundable investment tax or grants to support business, but the exemption of taxes on reinvested profits reduces the political pressure for other incentives.1919 With respect to research and development, the exemption of retained profits from inventions would provide similar benefits as a patent box.
With retained earnings as a marginal source of finance, corporate taxation is not relevant since the tax saved by reinvesting rather than paying out dividends is equivalent to the discounted future tax payments on dividends earned from the investment. Retained earnings finance is also better than debt finance since the latter imposes bankruptcy costs on the business without reducing corporate tax payments associated with reinvested profits. On the other hand, the distributed profits tax favours retained earnings finance over new equity financing. While this puts startup companies at some disadvantage initially, companies will be able to accumulate faster cash flow to finance future investment.
Evidence from Estonia,2020 Besides Estonia, Latvia, Georgia, and Lithuania have adopted distributed profits taxes. Austria and Switzerland apply tax on distributed profits in exempt reserves. Low tax rates on reinvested profits have been used in Chile (a 10 percent tax rate on retained earnings compared to a corporate tax rate of 50 percent), and China introduced a 10 percent credit in 2025 if profits are reinvested rather than distributed by foreign-owned businesses. which introduced its system in 2000, is informative for estimating revenue impacts below (Masso, Meriküll and Vahter 2013). With the elimination of the corporate tax on reinvested profits, debt as a share of assets fell from 49.4 percent to 42 percent, and the profit base expanded by 18 percent between 1999 and 2008. Retained earnings as a share of assets rose from 24 percent to 35 percent due to the elimination of tax, but also a shift from paying dividends. Investment growth increased by 0.378 percentage points annually, cumulating to roughly one-third over eight years. Corporate tax revenues initially fell from €105 million in 1999 to €55 million in 2000 (partly reflecting a recession) but recovered to €138 million in 2003 and averaged €205 million from 2004 to 2010.2121 OECD. “Tax Explorer.” https://data-explorer.oecd.org/vis?lc=en&df[ds]=DisseminateFinalDMZ&df[id]=DSD_REV_OECD%40DF_REVEST&df[ag]=OECD.CTP.TPS&df[vs]=2.0&dq=..S13....A&pd=1999%2C&to[TIME_PERIOD]=false&vw=tb.
Impact of a Retained Earnings Exemption in Canada
Our analysis includes several other provisions:
- Intercorporate dividends between resident companies would be tax-free.
- The current 2 percent tax on share buybacks would no longer be applied.
- Profit distributions from affiliates in treaty countries, with at least 10 percent ownership (votes and value), would be exempt.2222 It is possible to include foreign income as part of book profits with a credit for foreign taxes as an alternative. This is different from Canada’s current approach.
- Canadian shareholders would receive a dividend tax credit for distributions subject to corporate income tax.2323 Given the exemption for retained earnings, an increase in the capital gains inclusion rate would be appropriate for this reason. However, since only realized capital gains are taxed, full taxation of nominal capital gains on shares would increase the effective tax rate on real gains earned and encourage investors to hold assets rather than sell them (the lock-in effect). If capital gains were to be fully taxed on a realization basis, it would be necessary to introduce some form of indexation for inflation as well as a rollover provision to reduce the impact of higher capital gains taxes on the lock-in effect. Ignoring provincial taxes, if a corporation earns $100 in distributable profits, it would pay $13 in corporate tax and distribute $87. The $87 would be grossed up to $100, with a $13 credit applied against personal tax.
- If a corporation is reorganized, existing rules would apply, enabling deferral of distributions if they are retained in the new entity.
- An ordering rule would apply to dividend distributions to first exhaust current profits, followed by past undistributed profits. Retained earnings prior to the start-up of the system would be exempt upon distribution after the exhaustion of post-retained earnings paid out in dividends.
- Similar to European corporate tax systems, book profits would be a starting point with some adjustments needed for contingencies, reserves, and non-deductible items (e.g., club fees, stock options, and life insurance payments). For small firms, an alternative presumption approach (such as a presumed margin on revenues) could be optional for simplification.
- Under the global corporate minimum tax that is levied at a tax rate of 15 percent, Canada would apply a qualifying minimum top-up tax on book profits earned by large multinationals that would be paid if the distributed profits tax were less than the minimum tax (with appropriate carry-forward amounts).
Additional issues would need sorting out, especially with respect to taxation of foreign income, financial companies, and trusts.
Table 8 provides an estimate of distributed profits tax if it is in place for five years. With no behavioural impacts, federal taxes paid would be equivalent to the existing system. While less corporate tax is paid with exempt retained earnings, the 13 percent tax on distributed book profits exceeds the current effective rate of roughly 9 percent. Taxes on deemed dividends, investment income, and capital gains would add to revenues.

Once incorporating behavioural impacts, we estimate that the distributed profits tax at 13 percent would result in a loss of $15 billion in revenue (although in Estonia, the corporate tax on profits and capital gains returned to previous levels due to the growth in the tax base). Book profits would expand by 20 percent due to an increase in equity financing to replace debt. We assume that profits grow due to a growth in investment by 3 percent annually over five years, resulting in a total expansion in profits by 40 percent. The dividend payout ratio would drop from 57 to 3 percent. Overall, the corporate tax base would fall from $776 billion to $631 billion after accounting for share buybacks as deemed distributions and including investment income and capital gains. If the distributed profits tax were levied at 15 percent instead of 13 percent, the revenue loss would only be $3 billion.
A distributed profits tax that exempts retained earnings at 13 percent would improve the incentive to invest in Canada by 2034 (Table 9) if both federal and provincial governments adopt the same base with a federal-provincial combined rate of 26 percent. Compared to the corporate tax as of 2025, the METR on capital would decline by about a quarter from 12.6 percent to 9.4 percent if the distributed profits tax were adopted (Table 9).

Variation across non-resource sectors would be minimal because targeted incentives, including investment tax credits, would no longer apply. For mining and oil and gas, we assume the mining profit taxes and oil and gas royalties remain in place, which results in low marginal effective tax rates on mining and higher ones on oil and gas compared to other industries. Most industries would benefit from the exemption of retained earnings from tax, unlike the existing confluence of tax preferences. Forestry and manufacturing would be exceptions, as they currently receive special manufacturing and processing incentives.
As with the Irish-style reform, shifting to a retained earnings exemption under the corporate tax would require provincial agreement under existing Tax Collection Agreements. Some issues are simpler: the small business deduction would no longer be needed. Provinces keeping their existing general rates (averaging 11 percent for large firms) do not lose much revenue if rates do not change. The small business deduction would also become redundant. Even if dividends are subject to a higher corporate tax, the tax credit at the personal level will fully offset the increase.
Between the two options, the Irish reform is consistent with Canada’s existing approach to taxing corporate income. It simplifies the system by broadening the tax base and lowering rates sufficiently to eliminate the small business deduction at the federal level (provincial action would still be required). The distributed profits tax is a much more significant change. It enables companies to defer corporate income taxes if they reinvest earnings in business activities. This is not consistent with the income approach, but it is a simpler, more efficient, and fair approach for deferring capital expenditures compared to expensing them. It also improves corporate liquidity and enhances investor confidence by overcoming adverse selection in capital markets.
Making the Reform Revenue Neutral
Our big bang reform is designed to make the tax system more efficient and less complex by minimizing the economic and compliance costs of raising each dollar of revenue. The objective is to improve tax design, not to reduce the overall size of government. That said, we expect the long-run economic gains from the reform to help boost revenues and, in turn, reduce the deficit.
On the PIT side, after factoring in taxpayers’ responses to lower rates and a simplified credit structure, the reform would cost about $24.5 billion (Table 6). On the CIT side, shifting to an Irish reform would reduce revenues by about $11 billion. A shift to a 13 percent distributed profits tax would reduce revenues by roughly $15 billion. Combined PIT and CIT reforms would therefore cost between $35 billion and $39 billion, depending on the corporate tax reform adopted.
To make up the shortfall, we propose either increasing the GST or introducing a new employer payroll tax dedicated to healthcare.
Raising the GST Rate
Consumption taxes are generally shown to have a less harmful impact on the economy, particularly when they make up a smaller share of revenues than income taxes, as in Canada.2424 See, for example, Nguyen et al. (2021), who estimated the macroeconomic effect of changes in income taxes as opposed to changes in consumption taxes in the UK. As noted earlier, the costs of raising an additional dollar of revenue vary by tax bases once economic distortions are taken into account. The efficiency cost of value-added consumption taxes, such as the GST, is much lower than that of income taxes. Shifting toward greater reliance on the GST would therefore support economic growth. Increasing the GST rate by 2.8 percentage points – from 5 percent to 7.8 percent – would raise approximately $35.5 billion in 2026 after accounting for small behavioural responses.2525 We assume that a 1 percent of GDP consumption-tax increase lowers the tax base by roughly 0.5 percent (adapted from Nguyen et al. 2021).
A New Employer-Paid Payroll Tax
Employer-paid payroll taxes typically have flatter rate structures and, when combined with direct benefit linkages in the case of social security contributions, are generally less distortionary than progressive income taxes. Deslauriers et al. (2021) find that payroll taxes in Canada have no measurable impact on employment or sales but reduce wages. This implies that payroll taxes are passed almost entirely from employers to workers through reduced wages. Although workers ultimately absorb the cost, payroll taxes have smaller effects on economic activity and GDP than do higher income taxes.
We propose a new employer payroll tax of 3.2 percent of pay, dedicated to a fund for healthcare costs. This would improve political acceptability and limit distortionary impacts. Similar taxes exist in countries such as the United States, France, and Germany (MacKinnon, Mintz and Khanal 2024). The tax would be applied to payroll and self-employed earnings above $15,000 for each individual and would raise about $35.5 billion annually, earmarked for healthcare. Provinces could participate through an arrangement similar to the Canada Pension Plan.
Reducing Business Subsidies
Reducing business subsidies could also help finance reform. John Lester (2025) notes that business subsidies in Canada have risen sharply from about $17 billion in 2015 to $37.4 billion today and are projected to climb another 20 percent by 2028/29. While our suggested corporate tax reforms eliminate many investment tax preferences, business subsidies as grants could be moderated to help grease tax reform’s wheels including regional development grants, supply management, clean energy grants, and export subsidies.
Distributional Impacts of Reforms
The personal income tax rate reductions, combined with the simplified tax credit, would lower taxes across all household income quartiles, though the percentage reduction grows with income (Table 10). One reason is that low-income seniors benefit less than low-income workers because the gain from the simplified credit is largely offset by the reduction in the age credit. Another is that higher earners benefit more because they pay more tax and gain more from a cut in the top rate.

When revenue-neutral measures are incorporated, the overall package is distributionally neutral. We assume that the new payroll tax, although remitted by employers, is ultimately passed on to employees over time through lower wages. Because this adjustment takes time, however, the personal income tax reforms would initially feel like a tax cut for employees. Since the payroll tax applies only to workers – and workers, on average, gain more than retirees from the PIT package – and has a basic exemption, this option is closer to being distributionally neutral than a GST increase.
Corporate income tax reform would have some impact on income distribution. The lower METR will increase both income paid to labour and, in the case of small Canadian-controlled private corporations, income accruing to investors. Under either the 10 percent Irish corporate tax rate or the 13 percent distributed profits tax, and assuming a 50 percent pass-through, the loss in corporate tax revenues could boost wages by over 1.2 percent. As discussed below, potential economic impacts are expected to generate roughly $26 billion in additional annual tax revenue over the long run due to investment and efficiency gains. We expect these gains to be relatively distributionally neutral, with about half of the benefit accruing to lower-income workers.
Potential Economic Impacts
The tax reform would have positive effects on employment, investment, and overall economic growth. Over time, these benefits would raise incomes and government revenues, providing relief for deficit-challenged governments.
On the PIT side, Dahlby and Ferede (2022) estimate that raising an extra dollar of federal tax revenue imposes an economic cost of $1.86 in the long run, reflecting changes in how people adjust their economic activity. Adjusting for the efficiency cost of the GST and payroll taxes, which is much lower (see Table 4), the PIT reform could increase GDP by up to $23 billion annually over time.2626 From Table 4, let’s assume the efficiency cost is about $0.14 per dollar of consumption/payroll tax revenues, and $1.86 per dollar of PIT revenues. On a static basis, the PIT rate reductions would cost $15 billion with the consumption/payroll tax increase raising $35 billion. A back-of-the-envelope calculation yields (15 x 1.86) – (35 x 0.14) = $23 billion present-value economic gain in 2025 dollars.
On the corporate income tax side, the reform modifies the tax base, not just the tax rate. So, we cannot directly use the efficiency costs computed by Dahlby and Ferede. Focusing on the distributed profits tax, the reform would have two major impacts: reducing the impact of taxation on the incentive to invest and making the corporate income tax more neutral across assets and industries.
The investment effect is significant. A 13 percent distributed profits tax would reduce the effective tax rate on capital by nearly one-quarter compared to the 2025 system (Table 9). The cost of capital would fall by 4.6 percent. Total non-residential capital stock in Canada is $3.66 trillion. The long-run increase in capital stock (investment flow) would reach $140 billion.2727 The estimated impact on capital stock demand to a point change in the METR is equal to one (averaged for structures and machinery and equipment), based on Wen and Yilmaz (2020). This increase would raise GDP by $56 billion (1.8 percent of 2025 GDP) and federal revenues by $9 billion. Provincial and municipal revenues would also rise by about $9.5 billion, assuming no changes in their tax policies.
GDP also improves with a more neutral corporate income tax (assuming the aggregate effective tax rate is the same). The reduction in the dispersion of the METR across business activities under the distributed profits tax would yield potential increases in GDP as well.2828 Fatica (2014) finds that eliminating the dispersion of effective tax rates in Europe would result in a GDP gain of 4 percent. We have not quantified the effect for Canada.
In total, the PIT and CIT reforms could add roughly $79 billion to the GDP in 2025 dollars, or about 2.5 percent of GDP in the long run. Since total tax revenue represents approximately one-third of GDP (Table 2), this growth effect from our big bang reforms could increase federal, provincial, and municipal tax revenue by about 0.8 percent of GDP annually – more than $26 billion in 2025 dollars in newfound tax revenues.
Conclusion
Canada’s economic performance over the past decade has been disappointing. Per capita income growth, business investment, and productivity have all lagged peer economies, while the tax system has grown more inefficient, complex, and uncompetitive.
At the same time, Canada has achieved strong income redistribution. After taxes and transfers, it has the lowest income inequality among G7 countries. This strong redistributive outcome, however, has come at a cost: an overreliance on personal income taxes that discourage work, saving, entrepreneurship, and the retention of talent and capital.
On the business side, empirical evidence consistently shows that high corporate tax rates constrain economic activity, while lower and more neutral tax structures encourage investment, innovation, and job creation. Canada’s business tax system is riddled with distortions that misallocate capital across sectors and erode competitiveness. Given Canada’s climate and dispersed population, the country has lost the crucial corporate tax advantage it held in 2012 over the United States and other peers.
Simply trimming tax rates by a few points here and there will not reverse these trends. Canada needs a more fundamental, growth-oriented reform: one that simplifies the system, broadens the base, and lowers the marginal tax burden where it most constrains productivity.
The “big bang” reform proposed in this study would meet these objectives. On the personal side, lower rates combined with a simplified, broad-based basic allowance would reduce reliance on income taxes while preserving progressivity. On the business side, either an Irish-style reform or a distributed profits tax (exempting retained earnings) would encourage reinvestment and substantially lower the effective tax rate on capital. Together, these changes would make Canada’s tax system more efficient and easier to administer, without reducing revenues once growth effects and offsetting measures such as a modest GST or payroll levy are considered.
In total, the reforms could lift GDP by roughly 2.5 percent over time, strengthening the country’s fiscal position and laying the foundation for a more dynamic, competitive, and prosperous Canadian economy.
The authors extend gratitude to Philip Bazel for providing research assistance. They also thank Mawakina Bafale, Brian Ernewein, Tasnim Fariha, Kate Koplovich, John Lester, Kim Moody, Shawn Porter, Munir Sheikh, Trevor Tombe, Kevin Wark, and several anonymous referees for valuable comments and suggestions. The authors retain responsibility for any errors and the views expressed.
REFERENCES
Advani, Arun, David Burgherr, and Andy Summers. 2023. “Taxation and Migration by the Super-Rich.” IZA Institute of Labor Economics. Discussion Paper. Bonn: IZA.
Agrawal, David R., and Dirk Foremny. 2018. “Relocation of the Rich: Migration in Response to Top Tax Rate Changes from Spanish Reforms.” Munich Society for the Promotion of Economic Research Discussion Paper. Munich.
Akcigit, Ufuk, Salomé Baslandze, and Stefanie Stantcheva. 2016. “Taxation and the International Mobility of Inventors.” American Economic Review 106(10): 2930–2981.
Amberger, Harald, John Gallemore, and Jaron Wilde. 2025. “Corporate Tax System Complexity and Investment Sensitivity to Tax Policy Changes.” arqus Discussion Paper 300. Berlin: Arbeitskreis Quantitative Steuerlehre (arqus).
Arias, Jonas E. 2021. “The Macroeconomic Effects of Changes in Taxes on Labor.” Working Paper. Philadelphia: Federal Reserve Bank of Philadelphia.
Bafale, Mawakina, and William B.P. Robson. 2024. Underequipped: How Weak Capital Investment Hurts Canadian Prosperity and What to Do About It. Commentary 666. Toronto: C.D. Howe Institute. https://cdhowe.org/publication/underequipped-how-weak-capital-investment-hurts-canadian-prosperity-and-what/.
Baker, Scott, Stephen Teng Sun, and Constantine Yannelis. 2020. “Corporate Taxes and Retail Prices.” NBER Working Paper 27058. April.
Baylor, Maximilian, and Louis Beauséjour. 2004. “Taxation and Economic Efficiency: Results from a Canadian CGE Model.” Department of Finance Canada Working Paper 2004-10. Ottawa: Department of Finance Canada.
Bilicka, Katazyrna. 2020. “Are Financing Constraints Binding for Investment? Evidence from a Natural Experiment.” Journal of Economic Behavior & Organization 177: 618–640.
Canada. 1997. Report of the Technical Committee on Business Taxation. Ottawa: Department of Finance Canada.
Canada Revenue Agency. 2024. Canada Revenue Agency Quarterly Financial Report for the Quarter Ended June 30, 2024. Ottawa: Government of Canada.
Canada, Department of Finance. 2010. Tax Expenditures and Evaluations 2010: The Response of Individuals to Changes in Marginal Income Tax Rates. Ottawa: Government of Canada.
Carloni, David. 2021. “Payroll Tax Incidence: Evidence from the United States.” Washington, DC: Congressional Budget Office.
Chodorow-Reich, Gabriel, Owen Zidar, Eric Zwick, and Matthew Smith. 2024. “The Effect of the 2017 Tax Cuts and Jobs Act on Corporate Investment.” Quarterly Journal of Economics 139(2): 623–688.
Coles, Jeffrey L., Naveen Daniel, and Lalitha Naveen. 2022. “Tax Avoidance and Managerial Incentives: Evidence from Elasticity of Taxable Income.” Journal of Accounting Research 60(4): 1259–1299.
Crisan, Daria, Kenneth McKenzie, and Jack M. Mintz. 2015. “The Distribution of Income and Taxes/Transfers in Canada: A Cohort Analysis.” SPP Research Paper 8(5). Calgary: The School of Public Policy, University of Calgary.
Curtis, E. Mark, and Ryan Decker. 2018. “Business Dynamics and the Effects of Corporate Tax Changes.” Washington, DC: Federal Reserve Board.
Dahlby, Bev, and Ergete Ferede. 2011. What Does It Cost Society to Raise a Dollar of Tax Revenue? The Marginal Cost of Public Funds. Commentary 324. Toronto: C.D. Howe Institute. March. https://cdhowe.org/publication/what-does-it-cost-society-raise-dollar-tax-revenue-marginal-cost-public-funds/.
Dahlby, Bev, and Ergete Ferede. 2022. What Are the Economic Costs of Raising Revenue by the Canadian Federal Government? Vancouver: Fraser Institute.
Deslauriers, Jonathan, Benoît Dostie, Robert Gagné, and Jonathan Paré. 2021. “Estimating the Impacts of Payroll Taxes: Evidence from Canadian Employer-Employee Tax Data.” Canadian Journal of Economics 54(4): 1609–1637.
Duan, Zijun, and Hyunseob Kim Moon. 2025. “Corporate Tax Cuts and Their Impact on Jobs, Wages, and Investment: Evidence from Quebec.” American Economic Journal: Economic Policy (conditionally accepted).
Dufour, Xavier, Pierre-Carl Michaud and Michael Smart. 2006. “Salience and the Elasticity of Taxable Income: Evidence from Tax Bracket Tax Reforms.” NBER Working Paper 34371.
Ebrahimi, Philip, and François Vaillancourt. 2016. The Effect of Corporate and Payroll Taxes on Wages in Canada. Vancouver: Fraser Institute.
Fatica, Serena. 2013. “Do Corporate Taxes Distort Capital Allocation: Cross Country Estimates from Cross-Country Data.” Economic Papers 503. European Commission.
Fazzari, Stephen, Glenn Hubbard and Bruce Petersen. 1988. “Financing Constraints and Corporate Investment.” Brookings Papers on Economic Activity 1: 141–206.
Ferede, Ergete. 2021. Impact of Higher Federal Personal Income Taxes on Employment. Vancouver: Fraser Institute.
Ferede, Ergete, and Bev Dahlby. 2019. “The Costliest Tax of All: Raising Revenue through Corporate Tax Hikes Can Be Counter-Productive.” Technical Paper. Calgary: School of Public Policy, University of Calgary.
Fuest, Clemens, Andreas Peichl, and Sebastian Siegloch. 2018. “Do Higher Corporate Taxes Reduce Wages? Micro Evidence from Germany.” American Economic Review 108(11): 3930–3967.
Gechert, Sebastian, and Philipp Heimberger. 2022. “Do Corporate Tax Cuts Boost Economic Growth?” European Economic Review 145: 104114.
Giroud, Xavier, and Joshua Rauh. 2019. “State Taxation and the Reallocation of Business Activity: Evidence from Establishment-Level Data.” Journal of Political Economy 127(3).
Gorry, Aspen, Kevin Hassett, R. Glenn Hubbard, and Aparna Mathur. 2021. “The Elasticity of Taxable Income for High-Income Earners.” American Economic Journal: Economic Policy 13(2): 297–332.
Hartley, Jonathan S., et al. 2025. “Corporate Tax Cuts and Investment: Evidence on User Cost of Capital.” Hoover Institution Working Paper. Stanford: Hoover Institution.
Honohan, Patrick, and Branden Walsh. 2002. “Catching up with the Leaders: The Irish and the Hare.” Brookings Papers on Economic Activity 1: 1–57.
Kalin, Lukas, João Pereira dos Santos, and Miguel Tavares. 2024. “Tax-Induced Migration of Retirees: Evidence from Portugal.” NBER Working Paper.
Keane, Michael P. 2010. “Labor Supply and Taxes: A Survey.” Journal of Economic Literature 49(4): 961–1075.
Kennedy, Patrick J., Christine L. Dobridge, Paul Landefeld, and Jacob Mortenson. 2022. “The Efficiency-Equity Tradeoff of the Corporate Income Tax: Evidence from the Tax Cuts and Jobs Act.” Working Paper. New Haven: Yale University.
Khanal, Manish, James MacKinnon, and Jack Mintz. 2024. “Does Earmarking Lead to More Per Capita Health Spending?” CESifo Working Paper 11306. Munich: CESifo Institute.
Kumar, Anil. 2020. “The Macroeconomic Effects of the Tax Cuts and Jobs Act of 2017.” Dallas: Federal Reserve Bank of Dallas.
Laurin, Alexandre. 2015. Shifting the Federal Tax Burden on the One-Percenters: A Losing Proposition. Commentary 441. Toronto: C.D. Howe Institute, December. https://cdhowe.org/publication/shifting-federal-tax-burden-one-percenters-losing-proposition/.
Laurin, Alexandre, and Nicholas Dahir. 2022. Automatic Tax Filing: A Challenging Idea for Canada. Commentary 616. Toronto: C.D. Howe Institute, January. https://cdhowe.org/publication/automatic-tax-filing-challenging-idea-canada/.
Lee, Young, and Roger. H. Gordon. 2005. “Tax structure and economic growth.” Journal of Public Economics 89(5-6): 1027–1043.
Lester, John. 2025. “An Economic Strategy for Canada’s Next Government.” Special Policy Report. Toronto: C.D. Howe Institute. April. https://cdhowe.org/publication/an-economic-strategy-for-canadas-next-government/.
MacKinnon, Janice, Jack Mintz and Mukesh Khanal. 2024. “Financing Healthcare with Earmarked Taxes.” Tax Notes International.
Maaso, Jaan, Jaanika Merrikül, and Priit Vihtar. 2013. “Shift from Gross Profit Taxation to Distributed Profit Taxation: Are There Effects on Firms?” Journal of Comparative Economics 41(4): 1092–1105.
McKenzie, Kenneth, and Ergete Ferede. 2018. “Who Pays the Corporate Tax?: Insights from the Literature and Evidence for Canadian Provinces.” In Reforming the Corporate Tax in a Changing World, edited by Bev Dahlby. Toronto: Canadian Tax Foundation and The School of Public Policy, University of Calgary.
Milligan, Kevin, and Michael Smart. 2014. “Taxation and Top Incomes in Canada.” NBER Working Paper 20489. September.
Mintz , Jack and Michael Smart. 2004. “Income shifting, investment, and tax competition: theory and evidence from provincial taxation in Canada.” Journal of Public Economics 88(6): 1149-78.
Moretti, Enrico, and Daniel Wilson. 2021. “Taxing Billionaires: Estate Taxes and the Geographic Location of the Forbes 400.” American Economic Journal: Applied Economics 13(4): 221–250.
Munoz, Matteo. 2021. “Top Marginal Tax Rates and Migration of High Earners.” Paris School of Economics Working Paper.
Myers, S., and N. Majluf. 1984. “Corporate Financing and Investment When Firms Have Information That Investors Do Not Have.” Journal of Financial Economics 13(2): 187–221.
Nguyen, Anh D. M., Luisanna Onnis, and Raffaele Rossi. 2021. “The Macroeconomic Effects of Income and Consumption Tax Changes.” American Economic Journal: Economic Policy 13(2): 439–466.
Oliveira Martins, Joaquim, Romina Boarini, Hubert Strauss, Christine de la Maisonneuve, and Clarice Saadi. 2007. “The policy determinants of investment in tertiary education.” OECD Economics Department Working Papers 576. Paris: OECD Publishing.
Organisation for Economic Co-operation and Development. 2024. Consumption Tax Trends. Paris: OECD.
Parliamentary Budget Officer. 2022. Costing Personal Income Tax Changes: The Role of Elasticity of Taxable Income. Ottawa: Office of the Parliamentary Budget Officer.
______________. 2023. A Tax on Share Buybacks. Ottawa: Office of the Parliamentary Budget Officer.
______________. 2024. Long-Term Fiscal Cost of Major Economic Investment Tax Credits. Ottawa: Office of the Parliamentary Budget Officer.
Parsons, Mark. 2008. “The effect of corporate taxes on Canadian investment: An empirical investigation.” Department of Finance Canada Working Paper F21-8/2008-1E. Government of Canada.
Peterson, Ted, and Zachary Blair. 2022. “United States Tax Rates and Economic Growth” Sage Open 12(3).
Rimmer, Xavier, Jazmine Smith, and Sebastian Wende. 2014. “The Incidence of Company Tax in Australia.” Economic Roundup 1: 33–47. Canberra: Australian Government, The Treasury.
Statistics Canada. 2022. “Canadian Income Survey, 2020: Income of Seniors.” The Daily. February 23. Ottawa: Government of Canada.
Vaillancourt, François. 2024. “Tax Complexity and Individual Tax Compliance Costs of the Personal Income Tax in Canada, 1985–2023: A Synthesis.” Working Paper 2024s-13. Montréal: CIRANO.
Wen, Jean-François, and Fatih Yilmaz. 2020. “Tax Elasticity Estimates for Capital Stocks in Canada.” IMF Working Paper WP/20/77. Washington, DC: International Monetary Fund.
York, Erica, Huaqun Li, and Garrett Watson. 2023. The Macroeconomic Impact of the 2017 Tax Cuts and Jobs Act. Washington, DC: Tax Foundation.