


by Charles De Land and Cole Diepold
- This Commentary compares electricity prices across Canadian provinces between 2018 and 2023, examining overall system costs and the prices paid by residential, commercial, and industrial consumers. Provinces with large hydroelectric systems generally recorded the lowest costs, while Alberta, Newfoundland and Labrador, Nova Scotia, and Ontario had the highest system costs in 2023.
- Provincial rate structures distribute electricity costs differently across consumer classes. In most provinces, industrial consumers paid the lowest unit costs, while residential and small business consumers paid the highest. Ontario remained an exception because government mitigation programs reduced residential and small business costs relative to larger commercial and industrial consumers.
- Most provinces saw declining electricity system costs in real terms between 2018 and 2023 despite inflation and population growth. Alberta and Newfoundland and Labrador were notable exceptions, reflecting fuel price volatility, capital replacement needs, and large infrastructure cost recovery. Newfoundland and Labrador demonstrates that hydroelectricity alone does not guarantee low electricity prices when major infrastructure costs must be recovered from a relatively small customer base.
- The paper highlights growing pressure on electricity systems from electrification, industrial development, decarbonization policies, population growth, and emerging high-load sectors such as artificial intelligence. Provinces are increasingly investing in wind, solar, and battery storage, but legacy infrastructure, transmission constraints, and provincial policy choices continue to shape electricity costs. These pressures will make electricity pricing a more important economic and policy issue in the years ahead.
Introduction
One way or another, energy is consumed in all economic activity, and electricity is a critical component of Canada’s energy consumption profile. It is a reliable medium for generating, transmitting, and distributing power that ensures industrial and commercial businesses, communities, and residential households can carry out everyday and business activities, from lighting and heating buildings to charging appliances and running machinery. Because electricity is used across sectors, even small changes in power prices can create significant knock-on effects throughout supply chains. As such, electricity prices – and the related issue of affordability – are critical to industrial growth and economic competitiveness across Canada and its provinces.
All else equal, energy-intensive industrial and commercial businesses tend to locate in regions with relatively low-cost electricity. In other words, the real power prices of today and perceived prices of the future influence economic decision-making. Arguably, this investment consideration has never been more important than it is today, for several reasons.
First, in a globalized world, businesses can relocate relatively easily, making competition to offer low electricity prices increasingly global. Second, global energy demand is projected to grow at unprecedented rates, straining energy supply and requiring incremental grid infrastructure investment, which introduces new costs to the rate base. The increase in load backlog and costs may also shift traditional energy consumption behaviours. For example, large-scale industrial players may seek to generate electricity onsite rather than procure from the grid, or commercial and residential players may invest in behind-the-meter (BTM) solutions. This trend increases the complexity of managing more bidirectional power flows and raises the risk of losing long-term consumers.
Third, many developed nations like Canada are re-entering an era of industrialization and supply chain onshoring, spurred by geopolitical disruptions like Chinese supply chain monopolization and US tariffs. These efforts aim to strengthen economic growth and reduce reliance on unreliable global actors. This exacerbates competition for business investment, particularly for critical sectors like natural resources, manufacturing, healthcare, and information technology and artificial intelligence (AI), where governments have shown willingness to spend significant capital towards securing economic sovereignty.1Economic sovereignty is a nation’s autonomous capacity to formulate and implement its own economic policies, manage resources, and regulate internal markets without undue external control or influence. The aforementioned sectors represent industries that supply essential inputs or are exposed to external supply chain dependencies, while also being large consumers of electricity. While this Commentary is confined to comparing power prices of jurisdictions within Canada, these same competitive pressures also apply between provinces, as businesses operating within Canada may distinguish between favourable and unfavourable provinces based on power pricing, availability, and reliability.
Power prices, shaped by energy demand and supply dynamics, are also an important indicator for grid planning. Balancing electricity supply with demand is important, as excess demand will strain the grid and represent a lost revenue opportunity, while excess supply means real investment losses that must be recouped through inefficiently high rates. Tracking power prices helps producers anticipate when new generation or storage capacity will be economically justified. It also provides early signals of shifting consumption patterns or emerging stress points in the grid, allowing producers to optimize dispatch strategies and long-term capital planning.
A comparative picture of power costs across Canada can help inform electricity system planning and policymaking. This Commentary examines the structure and level of power prices across Canadian provinces, including how they differ across consumer classes (e.g., industrial, commercial and small business, and residential) and how they have changed over time. However, comparing power prices is not straightforward, as provinces and service areas have differing rate structures, tariff components, and regulatory systems that comprise unique power markets. Additionally, calculations of consumer-facing costs do not fully capture the dampening effect of subsidies. While subsidies are relevant to understanding the full cost of operating electricity systems – and are discussed at a high level in the Policy Discussion section – a comprehensive assessment of their impact across provincial markets falls outside the scope of this paper.
Readers should keep in mind that this paper’s primary contribution is descriptive and intentionally leaves room for further discussion on policy implications. That said, the analysis highlights several structural features of electricity systems that shaped costs from 2018 to 2023, and that will continue to impact long-term cost trajectories. In particular, it highlights: the inherent price volatility present in market-based systems; the extent to which subsidies can obscure true system costs and misalign incentives; and the compounding pressures created by future demand growth, capital stock retirements and refurbishments, population growth, and emissions-reduction requirements. Importantly, future demand growth is expected to be influenced not only by traditional economic and demographic factors, but also by emerging high-load sectors such as AI and quantum computing, alongside accelerated electrification of transportation, heating, and industrial processes. These forces collectively point toward higher system costs in the years ahead, while reinforcing the importance of transparent market signals and system-level planning.
Overview of Power Prices Across Canada
This Commentary provides a comparative view of power prices across Canada and explores the impact of different rate structures both at the system level and across residential, commercial, and industrial consumers. It builds and updates the work of a previous C.D. Howe Institute Commentary (Bishop, Ragab, and Shaffer 2020). Its additional contribution is a comparison of power prices both across provinces and over time.
Like its predecessor, this Commentary examines a five-year period of provincial electricity rates, focusing on 2019 to 2023, and includes 2018 for continuity and comparability of findings with the predecessor paper. In certain sections, such as Provincial Consumption, Rate Structures, and Prices, data extend to 2024 where available. The 2018 to 2023 period represents a distinct snapshot of provincial electricity pricing. Alongside the continuity it provides with the previous study, the period reflects a broader shock-and-transition cycle in Canadian electricity markets.
Over this period, demand shocks and rebounds caused by COVID-19, temporary rate measures, oil and natural gas price volatility, carbon pricing escalations, and interest rate and inflation fluctuations all contributed to a uniquely high-pressure cost environment. Electricity systems also underwent operational and structural adjustments, including shifts in generation mix and wholesale market design. Overall, the years from 2018 to 2023 reflect a period of market restructuring, fuel price shocks, macroeconomic pressure, and policy change, providing a stable and internally consistent basis for comparative provincial analysis before a new phase of market evolution. At the time of analysis, 2023 and 2024 were the most recent years for which full data sets were available.
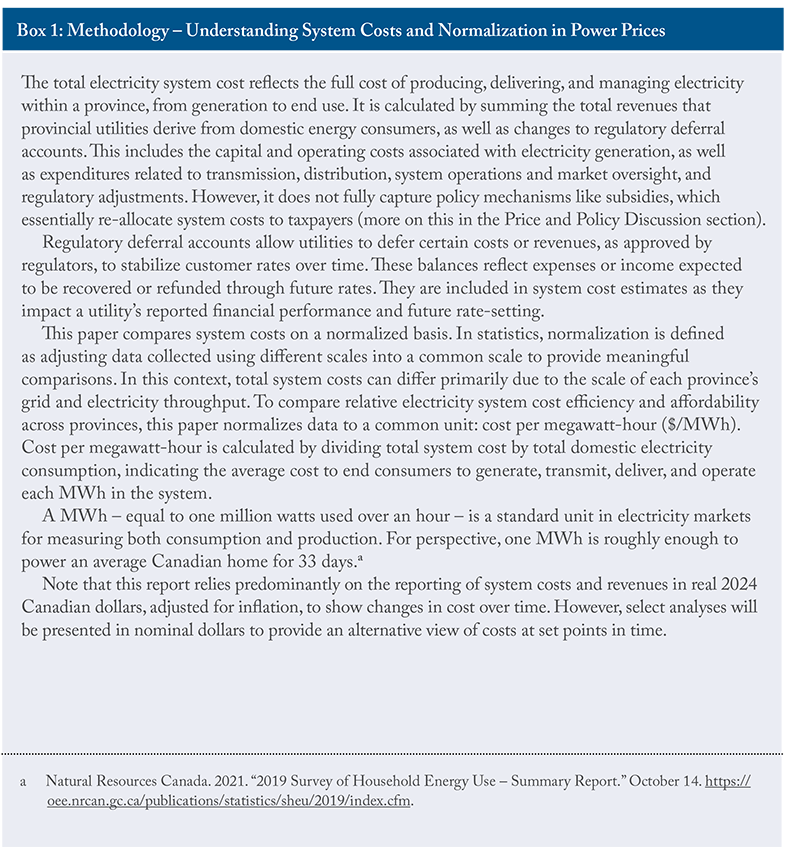
The paper begins by comparing the normalized system cost of power – defined as the total revenues from domestic consumers divided by domestic consumption – across provinces. The analysis shows that normalized system costs, measured on a dollar-per-megawatt-hour ($/MWh) basis, differ significantly across provinces. In 2023, Alberta ($225/MWh), Newfoundland and Labrador ($166/MWh), Nova Scotia ($156/MWh), and Ontario ($142/MWh)2Note that system costs differ somewhat from all-in costs in that they focus on the consumer-facing bill. For example, the Ontario Energy Board estimated that in 2023, the Ontario all-in cost of electricity was $161/MWh. However, this figure does not incorporate the government cost mitigation programs that reduced the all-in cost to Ontario consumers by $5.8 billion in 2023, which is reflected in the authors’ calculation of system costs. had the highest costs for power, in nominal terms. With the notable exception of Newfoundland and Labrador, provinces relying predominantly on hydro generation had the lowest unit system costs. In 2023, Quebec recorded the lowest unit system costs for power at $76/MWh, followed by Manitoba ($91/MWh) and British Columbia ($100/MWh).
To compare pricing across consumer classes, the paper surveys rates from major power providers and applies them to standardized consumer profiles. Electricity costs typically include both fixed charges, such as transmission infrastructure investments, and variable charges tied to electricity consumption or generation fuel costs. In certain provinces, electricity is charged in blocks, with different prices charged below or above a volume or demand threshold. Additionally, commercial or industrial consumers frequently face demand charges based on average or peak load, while some jurisdictions offer incentives for reducing consumption during peak periods.
Although normalized system costs are useful for comparing provincial electricity systems, these costs are not distributed across consumer classes. The complex set of rate components results in unit power costs (i.e., $/MWh) that, in turn, differ between consumer classes. In most provinces, industrial consumers pay the lowest unit power costs, followed by commercial consumers, with small business and residential consumers paying the highest unit costs.
The exception is Ontario. Taxpayer-funded rebates lower power costs for residential and small business consumers, while industrial (Class A) and larger commercial consumers (Class B) face higher costs relative to other provinces, though this anomaly is less pronounced than it was in 2019. Accounting for inflation, Ontario’s residential consumers paid more in 2024 than in 2019, while Ontario’s large commercial and industrial consumers paid less. This rebalancing aligns Ontario with other provinces in the treatment of residential, commercial, and industrial customers.
After comparing unit system costs across major provinces, reviewing provincial power consumption and consumer rate structures, and examining monthly power costs across provinces and consumer classes, the paper comments briefly on policy choices and price outcomes from the findings.
Comparative System Costs Across Provinces
System costs are a critical tool for comparing electricity systems across jurisdictions. This is because they capture the full economic burden of producing, delivering, and balancing electricity, not just the headline cost of generation. By accounting for transmission infrastructure, grid integration, reserve requirements, fuel inputs, and the need for variable resources, system costs reveal how different mixes of technologies perform under real-world operational conditions. This makes them especially useful for evaluating jurisdictions with very different resource endowments, regulatory structures, and demand patterns, as they take stock of all components of the broader system. Ultimately, system cost analysis provides a more holistic and comparable basis for judging the efficiency, resilience, and long-term affordability of electricity systems than simple levelized cost metrics alone.
Provincial Electricity Market Structures
While analysts find it relatively straightforward to compare total system costs, differences in provincial structures can make analyzing the components challenging.
The most notable difference between provinces is the degree of electricity market consolidation and regulation, or conversely, the openness of the system to market supply competition and multiple providers.3See Table A2 in the Online Appendix. Nearly all provinces except Alberta and Ontario have a vertically integrated Crown corporation utility that effectively monopolizes electricity supply. Other exceptions include Nova Scotia, which is served by a vertically integrated but private utility, and Newfoundland and Labrador, which is primarily served by Newfoundland & Labrador Hydro (a vertically integrated Crown corporation utility) alongside private distributor Newfoundland Power (a subsidiary of Fortis).
In Ontario and Alberta, electricity supply is more deregulated and operates across a value chain of several distinct utilities. Ontario operates a partially deregulated hybrid market. The province hosts various generators across public entities like Ontario Power Generation (OPG) and private Independent Power Producers (IPPs), which supply electricity through contract competition or rate-regulated procurement. Transmission is operated by a handful of licensed transmitters, most prominently Hydro One, while distribution is fragmented across 60 municipal and regional utilities, referred to as Local Distribution Companies (LDCs).4Electricity Distributors Association. n.d. “Facts About Ontario’s Local Hydro Utilities.” https://www.eda-on.ca/FOR-CONSUMERS/Ontarios-Local-Hydro-Utilities#:~:text=Facts%20About%20Ontario%27s%20Local%20Hydro%20Utilities,-Local%20hydro%20utilities&text=There%20are%20currently%2060%20LDCs,performance%20standards%20of%20Ontario%27s%20LDCs. The system operator, Ontario’s Independent Electricity System Operator (IESO), manages the wholesale electricity market and long-term planning, introducing market elements within the regulated framework.
Alberta operates the most liberalized, market-driven electricity system. Generation is fully competitive, with prices set through a real-time energy-only market administered by the Alberta Electric System Operator (AESO). Transmission is owned and maintained by a small number of Transmission Facility Owners (TFOs), while distribution is handled by a mix of investor-owned and municipal utilities. Alberta consumers – residential, commercial, and industrial – can choose their electricity retailer, making Alberta unique in its full separation of generation, retail, and delivery functions.
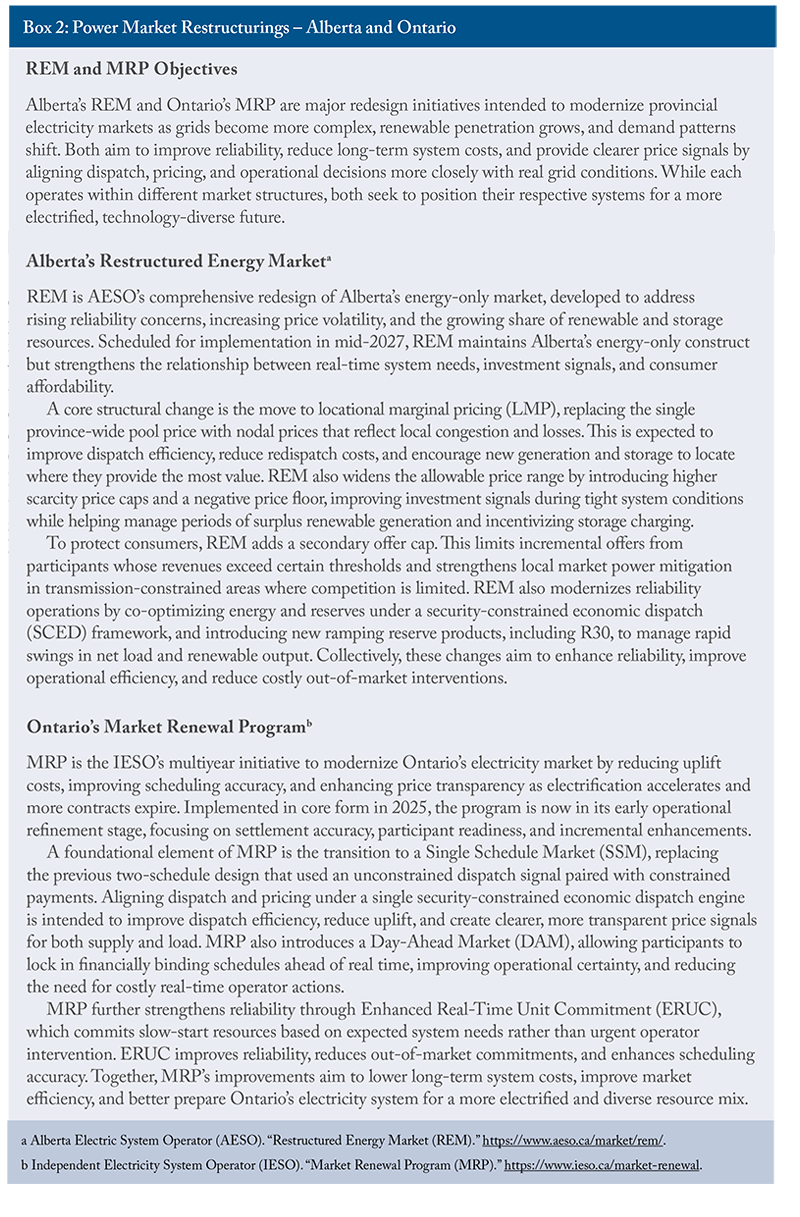
Both Ontario and Alberta have recently re-evaluated their power market pricing schemes through Ontario’s Market Renewal Program (MRP) and Alberta’s Restructured Energy Market (REM). These changes aim to improve electricity affordability and pricing accuracy while continuing to encourage producer participation by better reflecting system reliability needs, the integration and dispatch of new and complex energy technologies, and evolving load dynamics. Nonetheless, these two programs do not affect the data analyzed in this Commentary, as Ontario’s MRP was officially launched on May 1, 2025, while Alberta’s REM is set to launch in mid-2027.
For provinces with monopoly power providers, system costs are calculated by sourcing data from the annual reports of their respective Crown corporations, assessing total reported revenues and consumption for all consumers, net of any changes to regulatory deferral accounts. Each of these provinces has a regulatory body that determines the rates that participants charge for their individual service in the power system, as well as the aggregated rates facing end-use consumers.
In Ontario and Alberta, the costs borne by domestic consumers must be estimated by aggregating revenues across all distinct components and providers of the electricity system: generation, transmission, distribution, and system operation. One challenge is that transmission revenues in these provinces are not reported separately for domestic and export sales. Since transmission applies to all electricity dispatched in the market, the available data may capture sales from both domestic and export consumers. This creates a potential discrepancy, as export prices are generally more market-driven and can differ – often higher, though sometimes lower – from domestic prices. The effect is a slight inflation of calculated system costs for domestic consumers in Ontario and Alberta. However, because this paper focuses on normalized system costs, the impact is expected to be minimal and unlikely to materially affect overall trends in price movements over time, which are the primary focus of the analysis.
By comparison, provinces where separate data are available (i.e., British Columbia, Saskatchewan, Manitoba, Quebec, New Brunswick, and Nova Scotia), our estimates show normalized export prices per MWh were 8.44 percent higher than domestic prices on average in 2023. This methodology is consistent with the approach taken in this paper’s predecessor. By contrast, in other provinces with vertically integrated utilities, the analysis uses only domestic revenues and energy sales to calculate system costs.
Prince Edward Island’s (PEI) system cost was not included in this report’s analysis as it hosts a relatively unique market structure and presents challenges for direct comparison. As Canada’s smallest province, PEI has limited local electricity generation and relies on imports from New Brunswick via submarine cables. As of 2024, PEI imported approximately 68 percent of its electricity from New Brunswick.5Government of Canada. 2024. “Clean electricity in Prince Edward Island.” April 2. https://www.canada.ca/en/services/environment/weather/climatechange/climate-plan/clean-electricity/overview-prince-edward-island.html.
System Cost Results Per Province
In 2023, Alberta had the highest normalized system costs, while Quebec had the lowest, with Saskatchewan representing the median. Figure 1 shows all provincial system costs in 2023.
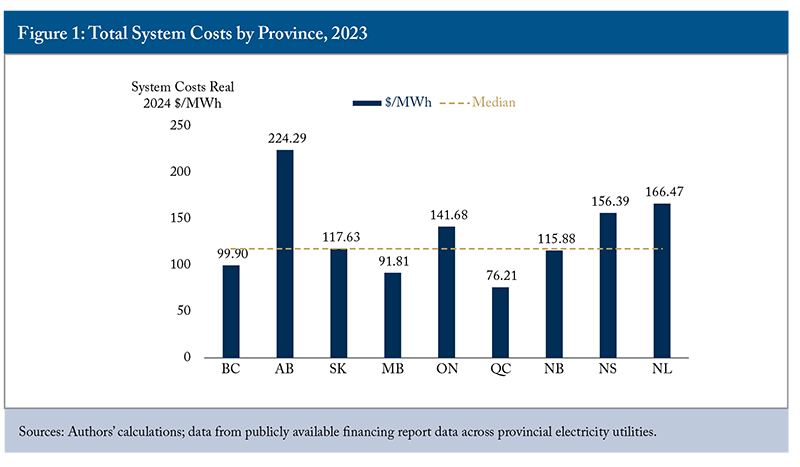
This paper’s predecessor found that, between 2014 and 2018, normalized systems costs were highly correlated with the share of hydroelectric generation in each province. This relationship largely remains true for the observed 2018 to 2023 period, with the exception of Newfoundland and Labrador. As shown in Figure 2(a), Canadian provinces generally fall into two groups: hydro-dominant provinces with lower normalized system costs, and non-hydro provinces with higher normalized system costs.
Hydro-dominant provinces include British Columbia, Manitoba, Quebec, and Newfoundland and Labrador, while non-hydro provinces include Alberta, Saskatchewan, Ontario, New Brunswick, and Nova Scotia. Large-scale hydroelectric generation benefits from substantial economies of scale that can be spread over long asset lifespans, while also avoiding variable fuel costs. However, hydroelectricity depends heavily on geography – particularly elevation and water flow – which is why access to hydro resources varies significantly across provinces. Between 2018 and 2023, hydroelectricity’s share of generation changed very little, reinforcing the notion that hydroelectric generation largely reflects fixed provincial resource endowments.
If a high share of hydroelectric generation is typically associated with low system costs, Newfoundland and Labrador is a notable exception. Despite generating approximately 98 percent of its electricity from hydro in 2023, the province had higher electricity rates than most jurisdictions, including non-hydro provinces. This outcome is driven primarily by capital cost recovery rather than operating costs. The Muskrat Falls project – which cost more than $13 billion – represents a large, recent investment that must be recovered from a relatively small population of roughly 520,000 residents, resulting in high per-customer costs. The scale of this burden is reflected in Newfoundland & Labrador Hydro’s regulatory adjustments, which rose sharply from $33 million in 2021 to $352 million in 2022 and $342 million in 2023. More broadly, this highlights the difference between new and legacy infrastructure: provinces such as Quebec and British Columbia benefit from hydro assets built decades ago whose capital costs have largely been depreciated, while Newfoundland and Labrador’s rates reflect the full, contemporary cost of new infrastructure.
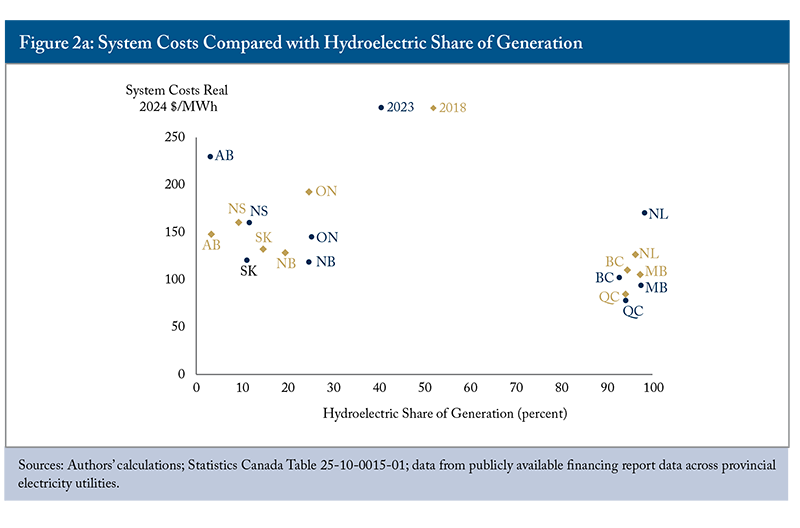
Where hydro resources are constrained, provinces will need to expand alternative forms of generation to meet electricity demand and, ideally, rely on low-cost technologies for new supply. Renewable technologies, wind, and solar in particular, offer such an opportunity while also supporting long-term net-zero objectives. According to the International Renewable Energy Agency (IRENA), “91 percent of all newly commissioned utility-scale renewable projects delivered electricity at a lower cost than the cheapest new fossil fuel-fired alternative” (2024). IRENA also identifies onshore wind as the lowest-cost source of new electricity globally, followed by solar photovoltaic (solar PV). Reflecting these global trends, the International Energy Agency (IEA) projects that variable renewable energy (VRE) sources such as wind and solar will increase their share of global electricity generation from roughly 15 percent in 2024 to 28 percent by 2030. Figure 2(b) illustrates how Canadian provinces expanded utility-scale wind and solar between 2018 and 2023.
The provincial results are less aggressive than might be expected when compared with future global VRE growth trends. Across provinces, the share of wind and solar in total electricity generation increased by an average of 2.6 percent. Declines in VRE share were concentrated in hydro-dominant provinces, though these decreases were small. This outcome reflects the structural reality that hydro-rich provinces already have large amounts of low-carbon, dispatchable generation and therefore face less pressure to expand variable renewable capacity.
By contrast, non-hydro provinces showed larger increases in wind and solar share, reflecting a greater need to diversify their electricity mix toward lower-cost and more resilient technologies, particularly where legacy generation relied heavily on coal. British Columbia and New Brunswick were exceptions to these broader regional patterns: British Columbia increased its wind generation share, while New Brunswick saw a decline in wind generation. Both provinces continue to have negligible utility-scale solar PV capacity
The largest increases in wind and solar share occurred in Alberta (14 percent), Saskatchewan (5 percent), and Nova Scotia (5 percent). By 2023, Alberta had substantially transformed its electricity system, with wind and solar accounting for more than one-fifth of total provincial generation.6In August 2023, the Alberta government announced a seven-month pause on approvals of renewable generation, followed by the enactment of the Electric Energy Land Use and Visual Assessment Regulation, which requires an agricultural impact assessment to be conducted for new wind and solar power plants on high-quality agricultural land. These policies have reduced the number of renewable projects in the AESO project development queue.
However, the relationship between lower normalized system costs and higher VRE penetration remains weak. Alberta stands out as a major outlier, with high system costs despite significant wind and solar deployment (discussed further in the Price and Policy Discussion section). With an average provincial VRE share of only 7.7 percent in 2023 (largely led by Alberta and Nova Scotia), variable renewables are unlikely to deliver major system-wide cost reductions at this stage. Early-stage integration costs, limited scale, and the unique technical requirements associated with low-penetration environments all constrain the cost-reducing potential of wind and solar. Current system costs remain driven primarily by factors such as the existing mix of generation fuel types, legacy infrastructure, transmission constraints, and province-specific pricing and subsidy schemes.
Nonetheless, most provinces are clearly increasing investment in wind, solar, and battery storage, and this trend is likely to continue and intensify over the coming decades. As demand increases and even hydro-dominant provinces reach capacity constraints, jurisdictions across Canada will turn to renewable generation as a lower-cost source of new supply. In fact, hydro-rich provinces may be some of the best suited to adopt VREs because of their ability to store power via pumped-storage hydroelectricity. This is reinforced by recent renewable calls for power from provinces like British Columbia, Manitoba, and Quebec, though this would not have had an impact during the 2018 to 2023 period.
Increasing adoption of VREs is consistent with IEA and IRENA projections and domestic federal and provincial decarbonization plans, such as the Government of Canada’s Clean Electricity Strategy, which sets a pathway to a net-zero electricity grid by 2050.7Government of Canada. 2024. “Powering Canada’s Future: A Clean Electricity Strategy.” October 16. https://natural-resources.canada.ca/energy-sources/powering-canada-s-future-clean-electricity-strategy. However, the pace of adoption and the resulting impacts on system costs remain uncertain.
System Cost Changes Over Time
Between this Commentary and its 2020 predecessor, several system cost trends persisted while some have diverged. In nominal values, every province except Ontario (-11.25 percent) recorded higher system costs between 2018 and 2023. In real values, all provinces saw a decrease in system costs from 2018 to 2023, except Alberta (+55.36 percent)8Alberta’s increase in system costs is notable and is discussed further in the Alberta and Price and Policy Discussion sections. Alberta’s system costs rose dramatically for several reasons, including heightened market control and capital stock replacement of coal-generating assets. and Newfoundland and Labrador (+34.82 percent). These findings are displayed in Figure 3.
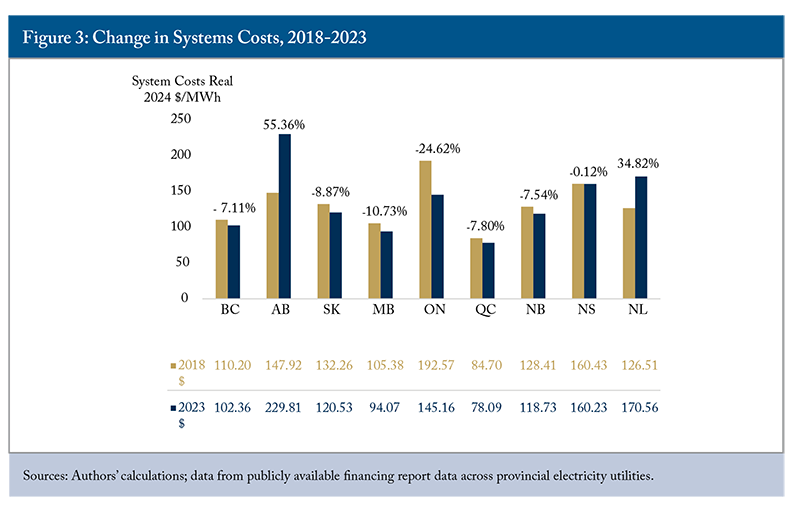
Relative provincial cost rankings also largely remained the same since 2018. Ontario moved down from the highest-cost position in 2018 to the fourth highest in 2023. Over the same period, Alberta moved in the opposite direction. Newfoundland and Labrador also moved up in relative cost from sixth to the second most costly.
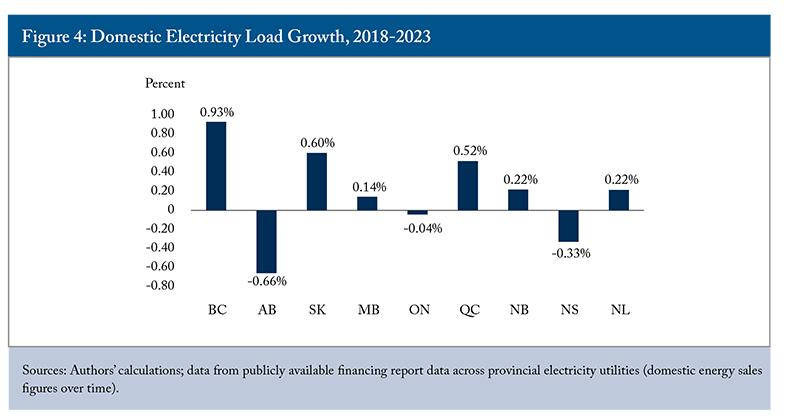
The decline in real system costs across most provinces is notable. It makes sense to expect that over time, electricity demand will grow, thus raising the cost of managing, expanding, and upgrading the system. Electricity demand growth has traditionally been driven by industrialization, urbanization, population growth, and greater adoption of electricity-consuming technologies. Across all provinces surveyed in this Commentary, the population grew at an average compound annual growth rate (CAGR)9Compound annual growth rate is roughly the average annual growth rate. of 1.5 percent from 2018 to 2023.10Statistics Canada. Table 17-10-009-01 Population estimates, quarterly. Nonetheless, as shown in Figure 4, electricity load growth remained modest – below 1 percent in most provinces and negative in Alberta, Ontario, and Nova Scotia.
Several factors likely explain this weak load growth. First, expectations of stronger historical growth may reflect current assumptions about future electrification rather than past trends. Second, although Canada’s economy expanded from 2018 to 2023, much of that growth came from less energy-intensive service and digital sectors. Export Development Canada (EDC) notes that from 2002 to 2022, service exports grew at a 5.1 percent CAGR versus 1.8 percent for goods.11Export Development Canada. 2024. “Service Exports: The Invisible Boost to Canada’s Economy.” February 21. https://www.edc.ca/en/article/service-exports-boost-canadian-economy.html.
Third, efficiency gains continue to reduce electricity demand. LEDs, efficient appliances, modern HVAC systems, and better-insulated buildings have lowered electricity use per household and business. In a mature market such as Canada, growth in electronic devices has not offset these gains. Fourth, the period includes unprecedented shocks such as COVID-19, which sharply reduced commercial and industrial demand during and after lockdowns. Fifth, behind-the-meter (BTM) generation reduces measured grid consumption, but does not fully eliminate reliance, especially at peak demand.
Finally, industrial demand can be highly variable. Facilities may switch fuels, improve efficiency, scale production with commodity cycles, or shut down entirely. Because a small number of large sites can dominate provincial loads, these shifts can outweigh broader economic growth and lead to negative electricity CAGR. This may explain why utilities and provincial governments have been able to limit the rise of system costs, as large-scale grid-related investments have not been required.
Alberta’s negative load CAGR appears to have been driven by industrial cyclicality, expanded cogeneration, and BTM generation. During the 2020 oil-price collapse, industrial behind-the-fence (BTF) load at oil and gas facilities fell sharply. AESO reported that Alberta Internal Load (AIL)12Alberta Internal Load is defined as “a number in MW: (i) that represents, in an hour, system load plus load served by on-site generating units, including those within an industrial system and the City of Medicine Hat; and (ii) which the ISO, using SCADA data, calculates as the sum of the output of each generating unit in Alberta and the Fort Nelson area in British Columbia, plus import volumes and minus export volumes” (Market Surveillance Administrator 2012). In other words, it represents the total electricity consumption within the province of Alberta. dropped to roughly 950 MW (about 10 percent below weather-adjusted normal levels).13Alberta Electric System Operator. 2020. “Impact of the COVID-19 pandemic and low oil prices on Alberta load.” December 2. https://www.aeso.ca/assets/Uploads/COVID-and-Oil-Prices-Impact-on-Load.pdf. The Canada Energy Regulator similarly noted that extremely low oil prices triggered production shut-ins and reduced industrial electricity demand across the province.14Canada Energy Regulator. 2020. “Market Snapshot: COVID-19 pandemic and lower oil prices impact Alberta’s electricity market.” July 2. https://apps2.cer-rec.gc.ca/en/data-analysis/energy-markets/market-snapshots/2020/market-snapshot-covid-19-pandemic-and-lower-oil-prices.html. AESO’s 2020 Market Statistics confirm that average AIL fell 2.4 percent year over year due to both COVID-19 and oil-price-related industrial contraction.15Alberta Electric System Operator. 2024. “Annual Market Statistic Reports.” March 8. https://www.aeso.ca/market/market-and-system-reporting/annual-market-statistic-reports/.
These effects were reinforced by Alberta’s growing onsite cogeneration capacity, which CER shows increased from 1,813 MW in 2000 to 4,528 MW by 2015, demonstrating a trend of reduced reliance on grid-supplied electricity.16Canada Energy Regulator. 2016. “Market Snapshot: Alberta’s cogeneration capacity has grown significantly in the last 15 years, led by oil sands projects.” October 12. https://www.cer-rec.gc.ca/en/data-analysis/energy-markets/market-snapshots/2016/market-snapshot-alberta-cogeneration-capacity-has-grown-significantly-in-last-15-years-led-oil-sands-projects.html. Alberta also experienced some of the fastest growth in behind-the-meter solar in Canada. The Régie de l’énergie found that Alberta’s BTM solar capacity in 2023 was the second highest nationally and exceeded the combined capacity of Quebec, Manitoba, Saskatchewan, New Brunswick, Prince Edward Island, Newfoundland and Labrador, and the territories.17Dunsky Energy + Climate Advisors. 2023. “BTM Solar: Canadian Market Outlook.” October 31. https://www.regie-energie.qc.ca/fr/participants/dossiers/R-4270-2024/doc/R-4270-2024-C-ACER-0012-Preuve-Autre-2024_11_01.pdf. Together, these factors may have materially suppressed Alberta’s grid-connected load growth despite broader economic and population expansion.
Alberta and Ontario
Alberta and Ontario warrant particular attention as their market structure and evolution in costs over time differ significantly from those of other provinces. Both provinces are, to varying degrees, deregulated, yet their system costs have moved in different directions since 2018.
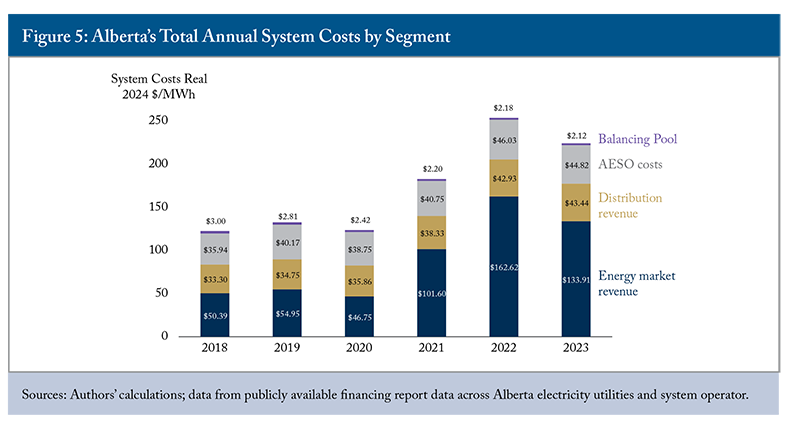
In 2020, Alberta’s real electricity system cost was $145.44 per MWh, consistent with the upward trend observed since 2014. However, in 2021, this figure rose sharply to $207.81 per MWh and peaked at $269.97 per MWh in 2022, the highest value recorded in the reporting series (2014 to 2023), before declining to $229.81 in 2023.
Meanwhile, from 2020 to 2023, Ontario’s system cost rose very little – less than $2/MWh in real terms. Yet in 2018 to 2019, Ontario recorded the highest real system costs in the country, at approximately $192.57. By 2023, real system costs had fallen to $145.16/MWh, reflecting a substantial decline over the period.
Both provinces operate wholesale electricity markets designed to promote competition in electricity generation by moving away from regulated cost-of-service pricing toward price signalling. Third-party energy generators submit hourly offers to the system operator (AESO in Alberta and IESO in Ontario) at the price they are willing to supply electricity. The system operator dispatches supply starting with the lowest-priced offers until demand is met. All dispatched generators receive the same clearing price: the highest-priced offer required to meet demand. In Alberta, this is called the Pool Price. In Ontario, it was historically known as the Hourly Ontario Energy Price (HOEP), now replaced by the Ontario Electricity Market Price (OEMP) (see Box 2).
Alberta
Alberta’s electricity market structure consists of several segments that shape system costs and pricing. The Balancing Pool, a government-established entity, manages legacy Power Purchase Arrangements (PPAs) that were either unsold or returned due to unprofitability or policy shifts. It sells electricity from these assets into the market and passes any net revenues or deficits on to consumers via rate adjustments. While the Balancing Pool no longer holds assets and is expected to wind down by 2030, a charge remains to recover loans issued before 2020.18French, Janet. 2022. “Alberta is moving to dissolve the electricity Balancing Pool. Here’s why that matters to you.” CBC News. April 14. https://www.cbc.ca/news/canada/edmonton/alberta-is-moving-to-dissolve-the-electricity-balancing-pool-here-s-why-that-matters-to-you-1.6417863.
The AESO oversees market operations, system planning, and transmission. AESO-related costs are split into Wires Costs, which cover regulated transmission infrastructure and are paid to Transmission Facility Owners, and Non-Wires Costs. These include essential services like market operations, system reliability, and ancillary services.
Distribution revenues represent the costs of delivering electricity through local low-voltage networks owned by regulated utilities. These are recovered through tariffs on consumer bills and are distinct from transmission and market costs.
Lastly, energy market revenues arise from Alberta’s energy-only wholesale market, where generators are compensated solely for the electricity they produce based on the hourly Pool Price set through competitive bids. This price-based system helps signal investment needs and guides generator dispatch decisions.
Figure 5 breaks down Alberta’s cost structure. As expected, Balancing Pool costs have gradually declined, while AESO costs and distribution revenues have increased. Rising Energy Market Revenue (revenue to producers derived from Alberta’s Pool Price) was primarily responsible for Alberta’s high power prices from 2021 to 2023, showing a stark difference with the 2018-2020 period.
Ontario
Ontario’s electricity pricing structure is similarly composed of several segments that determine what consumers ultimately pay. Historically, the HOEP served as the wholesale market price for electricity, calculated hourly based on generator offers and demand bids. Under the MRP, HOEP was phased out in April 2025 and replaced by the OEMP, calculated as the sum of the Day-Ahead Market Ontario Zonal Price (DAM OZP) and a Load Forecast Deviation Adjustment (LFDA). This reform introduced a Day-Ahead Market and better aligned prices with system conditions. Even before this transition, most consumers did not directly pay HOEP. Instead, they paid a blended price that included the Global Adjustment (GA), which bridges the gap between the wholesale dispatch price and the system’s long-run costs.
The GA covers the difference between what generators earn from the market price and the total payments owed to contracted and regulated suppliers. It funds long-term contracts, regulated rates for nuclear and hydro, and programs like conservation and demand response. When wholesale market prices rise, the GA declines because more system costs are recovered directly through the market.
The GA remains substantial largely because Ontario signed a significant volume of long-term, higher-cost generation contracts in the 2000s and early 2010s while phasing out coal. These contracts guaranteed prices intended to attract investment when gas, nuclear refurbishment, and early renewable projects were more expensive. Those costs still flow through the GA today, making it a significant share of most electricity bills.
Beyond generation, consumers pay for distribution and transmission services. Distribution revenues are collected by local distribution companies (LDCs) to fund the low-voltage delivery network and its upkeep. Transmission revenues cover the high-voltage system operated by entities like Hydro One and are recovered through charges based on peak demand and usage. These costs ensure the reliability of Ontario’s bulk grid and its interconnection with neighbouring jurisdictions.
The IESO administration fee supports market operations, system management, and long-term planning. While modest, it is essential in maintaining system reliability and effective market operations. Together, these components form the full cost stack that supports Ontario’s electricity system, from generation through delivery. Figure 6 breaks down Ontario’s system costs.
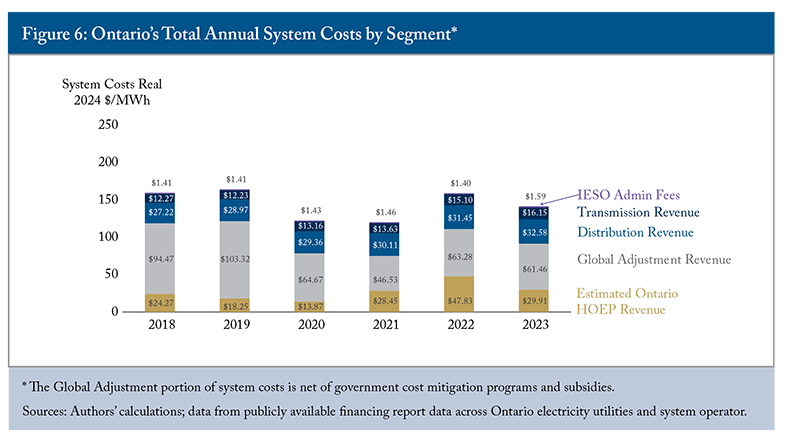
Unlike Alberta, Ontario’s system costs trended down in both nominal and real dollars, allowing the province to move from the highest-cost jurisdiction in 2018 to the third highest in 2023. This decline was driven by a decrease in the GA between 2019 and 2020. Several factors contributed to this decline. Electricity demand steadily caught up with earlier capacity investments financed through the GA. Another is due to increases in dispatch pricing. Lastly, taxpayer subsidies have allowed Ontario to substantially re-allocate system costs from ratepayers (discussed further in the Price and Policy Discussion section).
Other cost segments – particularly transmission and distribution revenues, and to a lesser extent IESO administration fees – increased steadily over time. HOEP also experienced volatility throughout the 2018 to 2023 period but jumped after 2020 to peak at $47.83/MWh in 2022. Because the GA has shown little additional decline since 2019 while other cost components continue to rise, Ontario could face higher electricity prices in the future. Much may depend on the performance of the new OEMP pricing system.
Provincial Consumption, Rate Structures, and Prices
Consumers in different provinces consume electricity differently. Residential, commercial, and industrial consumers respond to prices in different ways depending on climate, industry composition, demographic characteristics, and urbanization.
Canada’s diverse natural resource endowments also shape electricity costs and prices. For example, access to inexpensive natural gas or hydroelectricity can materially affect provincial power systems. Policy choices matter too, particularly tariff and subsidy decisions made by provincial regulators that directly affect consumer prices.
This section examines Canadian electricity consumption patterns, prices, and the factors underlying them.
Provincial Demand Patterns
Figure 7 shows differences in the composition of domestic electricity consumption across provinces. Industrial loads represent a much greater share of electricity consumption in Alberta, Saskatchewan, and Quebec. Residential consumers comprise a comparatively greater share of the Atlantic provinces (except for Prince Edward Island).
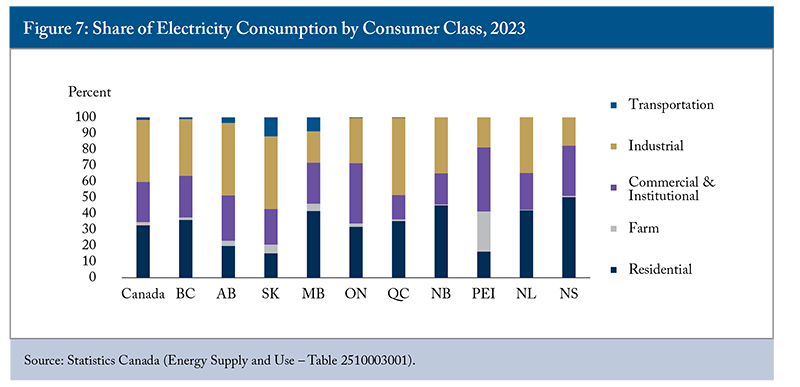
Provinces with greater shares of industrial demand tend to show less variation in hourly consumption since industrial facilities, like factories or chemical plants, typically require around-the-clock power.
Residential energy and electricity demand patterns differ across provinces. Figure 8 shows that the prairie provinces consume more total energy than the Canadian average. Fuel use also varies considerably. Alberta and Saskatchewan rely more heavily on natural gas, while Manitoba derives a greater share of its energy from electricity. Quebec and the Atlantic provinces consume relatively little natural gas and more electricity. The relatively high share of electricity in the prairies comes from electricity used in moving oil and natural gas in pipelines, classified as a transportation activity.
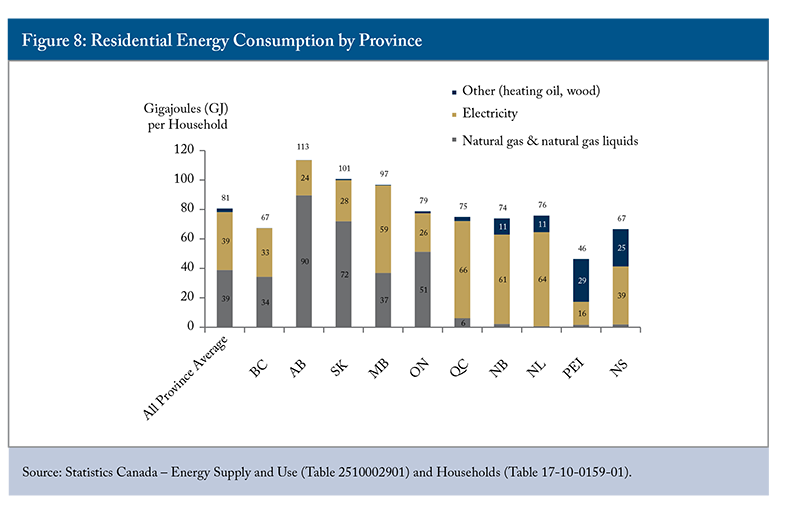
Provincial differences in energy consumption largely reflect variations in resource endowments, transmission infrastructure, relative pricing, and climate.19Figure A1 in the Online Appendix displays the wide variation in residential electricity use across provinces. Households in Alberta and Ontario use much less electricity than the Canadian average, while those in Manitoba, Quebec, New Brunswick, and Newfoundland and Labrador use much more. These differences are driven largely by relative prices and access to energy resources and infrastructure.
Interprovincial Consumer Power Cost Comparison
Electricity rate structures differ significantly across provinces and consumer classes, reflecting varying regulatory approaches and market designs. To standardize comparisons, this paper uses representative residential, commercial, and industrial customer profiles and applies provincial tariff schedules in effect as of April 1, 2024 (see Table A1 in the Online Appendix).
Figure 9 presents average electricity costs by consumer class in 2024, measured in cents per kWh. As in the 2020 study, unit electricity costs generally decline as consumption increases because fixed system costs can be spread across more units of electricity. This means transmission-connected industrial customers generally pay the lowest unit costs, followed by distribution-connected industrial, large commercial, and small commercial consumers. Residential consumers typically face the highest unit costs.
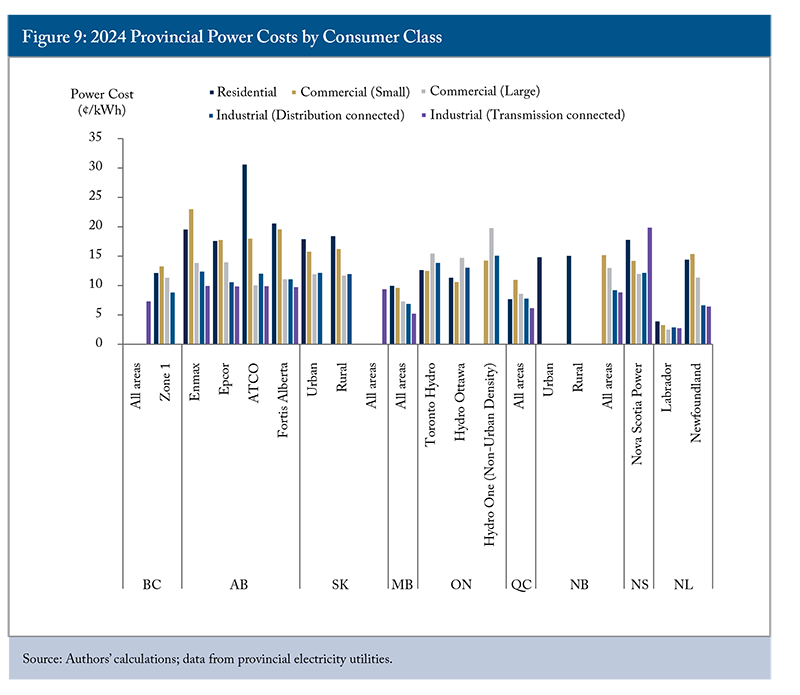
Ontario remains an outlier as its residential prices tend to be closer to those of larger consumers. In 2024, residential and small commercial consumers in urban Ontario paid lower average unit costs compared to large commercial and industrial consumers. Provincially funded rebates have reduced bills for these classes, though less than in 2019. Only British Columbia, Quebec, Manitoba, and Newfoundland and Labrador recorded lower average residential electricity costs than Ontario. As seen in Figure 1, these provinces also continue to have much lower normalized system costs compared to Ontario, Alberta, and Nova Scotia.
Rural residential consumers tend to face significantly higher electricity costs than their urban counterparts. This is evident in the relatively high unit costs for customers served by ATCO in Alberta and by Hydro One in low-density areas of Ontario. Similar rural-urban cost disparities are also observed in Saskatchewan and New Brunswick.
As expected, given that each electricity system must largely “pay for itself” by ratepayers (assuming no outside subsidy), prices across provinces generally reflect system costs, acknowledging that distortions exist in Ontario, and arguably in Quebec (Heritage Pool) and Alberta (withholding). Customers in provinces with a high degree of hydro generation face lower prices across customer classes (Quebec, Manitoba, and British Columbia).
Most provinces saw nominal price increases across most customer classes between 2019 and 2024. Ontario was a notable exception, showing nominal decreases for large commercial (-3.6 percent), distribution-connected industrial (-3.8 percent), and transmission-connected industrial (-10.2 percent) customer classes.
When adjusting for inflation, trends diverged more significantly across provinces and customer classes. Alberta and Ontario saw substantial real increases in average per-unit costs for smaller customers (residential and small commercial) between 2019 and 2024. New Brunswick also experienced real increases across all customer classes, though the magnitudes varied.
By contrast, British Columbia, Saskatchewan, Manitoba, and Quebec recorded real per-unit cost declines across most, if not all, customer classes. Most provinces also maintained similar relative price rankings over the period, except Ontario. After inflation, Ontario residential customers paid significantly more (+22.2 percent), while industrial consumers paid much less (-18.8 percent for distribution-connected customers). This shift is likely a result of the recalibration of residential subsidies after moving renewable contracts into the tax base in 2021. In addition, Ontario’s Comprehensive Electricity Plan (CEP), introduced in 2021, effectively subsidized larger consumers by removing high-priced legacy contracts from system costs.20Government of Ontario. 2023. “Published Plans and Annual Reports 2023–2024: Ministry of Energy.” March 31. https://www.ontario.ca/page/published-plans-and-annual-reports-2023-2024-ministry-energy.
Residential
Provincial residential electricity cost rankings did not change materially between 2019 and 2024, although Alberta and Ontario did see substantial increases. Figure A2 in the Online Appendix shows residential electricity costs by province, with Alberta and Ontario on top. In Ontario, the Ontario Electricity Rebate partially offset monthly bills for residential, small commercial, and farm customers.
In 2024, fixed charges still represented a relatively small portion of the overall electricity bill for most residential customers across provinces.21Figure A2 breaks down residential electricity bills into energy, variable, fixed, and demand components. Most costs are driven by energy usage and, where applicable, variable charges. In Ontario and Alberta, separate variable charges also apply to transmission and distribution services, adding further complexity to bill structures.
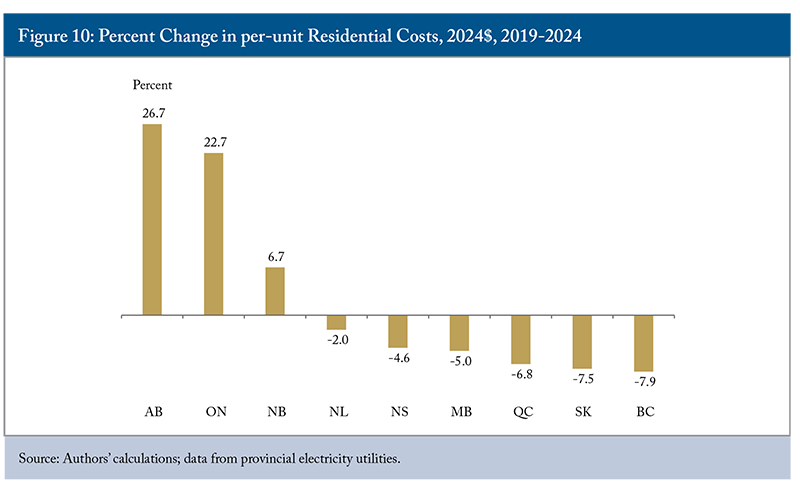
Between 2019 and 2024, residential costs rose in all provinces. Provincial cost rankings essentially stayed the same, with Alberta (+49.9 percent) and Ontario (+45.2 percent) seeing the largest nominal increases, while British Columbia, Saskatchewan, and Quebec were the lowest at about 10 percent. That said, the significant rise in Canadian inflation should be acknowledged. After adjusting the numbers to 2024 dollars, most provinces saw a decrease in real residential per-unit costs, shown in Figure 10. Alberta was a notable exception, with real residential costs rising by nearly 27 percent, followed by Ontario (+23 percent) and New Brunswick (+7 percent). Alberta’s relatively higher energy (wholesale generation) prices were the main culprit, while Ontario’s residential rate rise offsets a decrease in industrial prices, as discussed in more detail in the next section.
Small Commercial
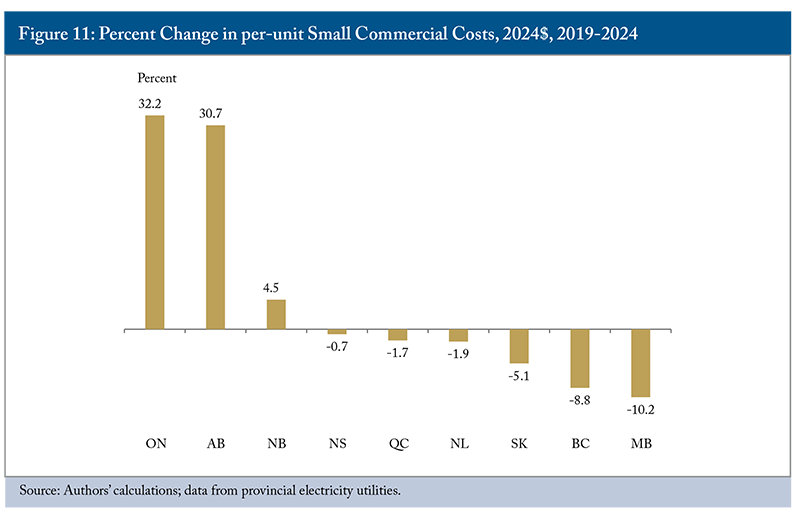
Figure A3 in the Online Appendix breaks down small commercial electricity bills by component, while Figure 11 shows real per-unit cost changes. Alberta and Ontario saw the largest increase in per-unit costs, of over 30 percent in real terms for both. Manitoba, British Columbia, and Saskatchewan saw declines. As with residential consumers, Alberta prices were driven by high wholesale energy costs.
Large Commercial
Total monthly costs for large commercial customers broadly saw increases from 2019 to 2024 across most provinces. Ontario remains generally the most expensive province (see Figure A4 in the Online Appendix).22Large Commercial customers in Ontario assumed Class B.
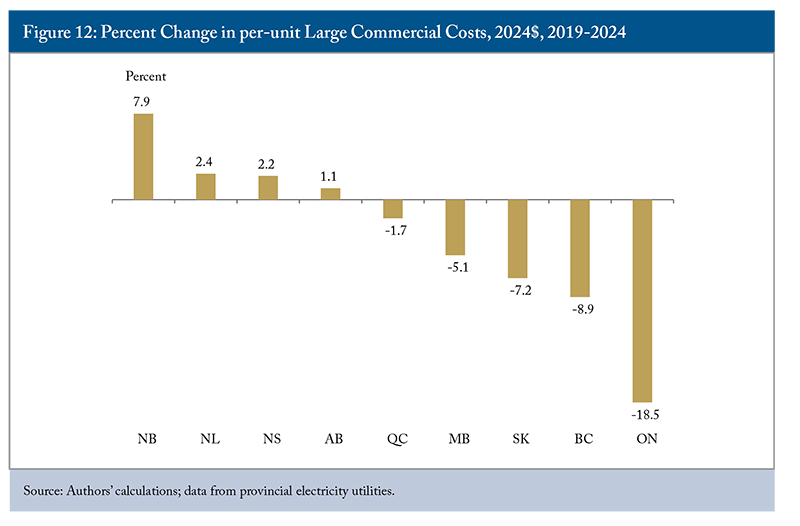
Most provinces also recorded nominal increases in average per-unit costs for large commercial customers over the period. However, when adjusted for inflation to 2024 dollars, the real per-unit cost for large commercial customers decreased in several provinces, including British Columbia (-8.9 percent), Saskatchewan (-7.2 percent), Manitoba (-5.1 percent), and significantly in Ontario (-18.5 percent), as shown in Figure 12. Conversely, real per-unit costs increased in other provinces, such as New Brunswick (+7.9 percent) and Newfoundland and Labrador (+2.4 percent).
Industrial (Distribution-connected)
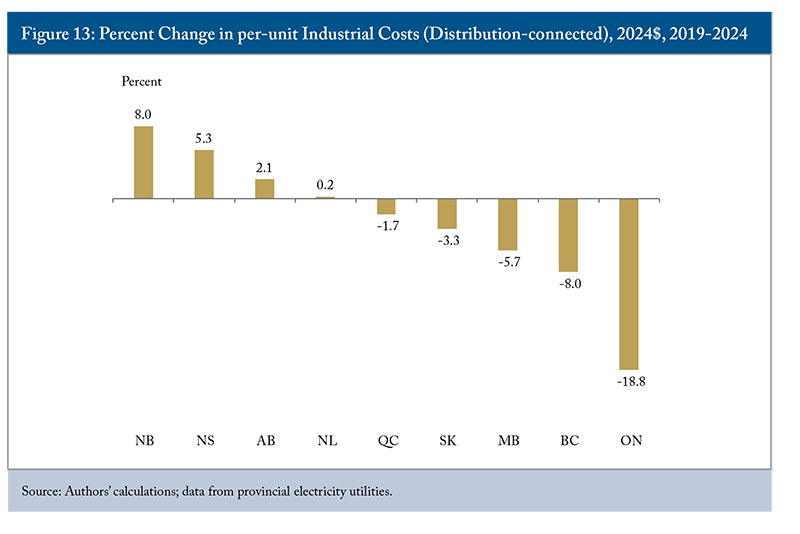
Distribution-connected industrial consumers (those connected in a manner similar to large commercial customers) tend to pay the most in Ontario23Industrial consumers in Ontario assumed Class A. and Alberta (Figure A5 in the Online Appendix), with Manitoba, Quebec and British Columbia paying less. Like large commercial counterparts, Ontario’s industrial consumers enjoyed a significant decline in inflation-adjusted costs from 2019 to 2024 (Figure 13), while New Brunswick saw the greatest increase.
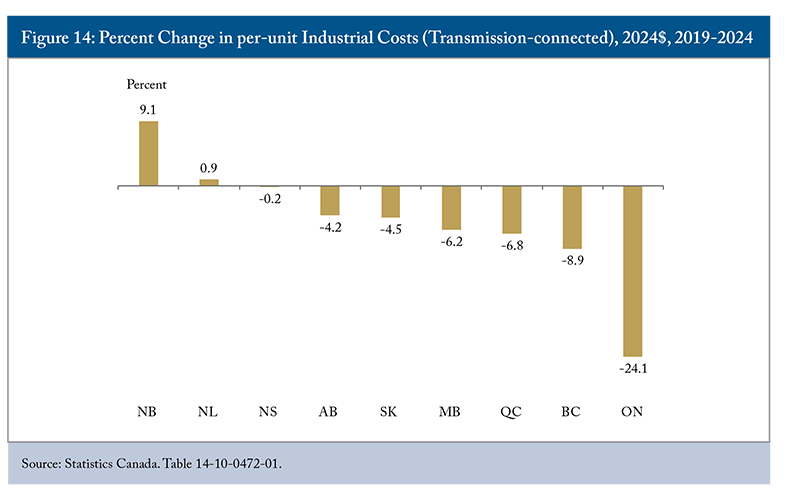
Industrial (Transmission-connected)
The largest industrial consumers are typically connected directly to transmission equipment. While fewer in number than those connected to distribution networks, these consumers often have significant regional economic importance and are commonly targeted through preferential industrial rate structures intended to attract investment.
Figure A6 in the Online Appendix shows that transmission-connected industrial prices broadly follow the same provincial pattern as distribution-connected industrial prices. As in the previous study, customers in regions supplied by a high proportion of hydroelectric generation tend to have the lowest costs: namely, Quebec, Manitoba, British Columbia, and Newfoundland and Labrador.
Ontario’s transmission-connected industrial consumers saw the greatest drop in real costs, far outpacing other provinces with a significant 24 percent decline. New Brunswick was the only province in which transmission-connected consumers faced a real increase in cost (Figure 14).
Price and Policy Discussion
As stated previously, this Commentary provides a descriptive analysis of Canadian electricity pricing and system cost trends. Nevertheless, examining these trends also reveals parallels between policy choices and price outcomes. Three broad conclusions emerge from the analysis: i) deregulated power markets exhibit greater price volatility and higher average prices; ii) market subsidies can reduce costs for ratepayers, but do so by transferring costs to them as taxpayers; and, iii) real declines across many provinces’ system costs are likely unsustainable given expected future demand growth.
Each province makes its own decisions about how to recover or “pay for” the total cost of supplying power. While policy choices often influence total systems costs, they also largely determine how costs are recovered through price. They delimit the nature of each customer class, the breakdown of demand, fixed, or variable charges, the amount of cross-subsidy between classes, and more. Regardless of the structure, system costs must ultimately be recovered in some form.
Volatility in Market-Based Systems
Alberta and Ontario were the only electricity systems with wholesale electricity market elements during the study period. Alberta experienced the sharpest increase in normalized system costs after 2020 and recorded the highest system costs among provinces from 2018 to 2023. This reflected, in part, the volatility inherent in Alberta’s deregulated market structure.
Alberta’s deregulated electricity market began in 1996, when the Electric Utilities Act came into effect to address the lack of private capital and competition between vertically integrated, oligopolistic utilities. This act sought to break up vertical monopolies, mandate open access to the transmission grid, allow generation to be owned/sold competitively, create an independent system operator (AESO’s predecessor), and establish a competitive wholesale market (Power Pool). However, concerns remained that incumbent utilities would continue to dominate the market.
To address this, the Alberta government introduced Power Purchase Agreements (PPAs) in 2000. Under this system, utilities retained ownership of generating assets, but third parties received the right to sell electricity output into the market through 20-year contracts. Because there were more PPA buyers than utilities, market concentration declined and competition increased. When the PPAs expired in 2020, those rights returned to the original owners, reconcentrating market share.
Market concentration and offer control were key drivers of price growth from 2021 to 2023. A study in the International Journal of Industrial Organization found that average peak-hour prices rose 120 percent following the expiry of the PPAs, with roughly two-thirds of the increase attributable to increased market power among large suppliers (Brown, Eckert, and Shaffer 2023). In 2022, prices remained elevated despite a substantial supply cushion (the volume of electricity readily dispatchable to the market), suggesting opportunistic offer behaviour24Power Advisory LLC. 2023. “January 2023 Alberta Electricity Newsletter: 2022 Alberta Market in Review.” January 31. https://www.poweradvisoryllc.com/reports/january-2023-alberta-electricity-newsletter-2022-alberta-market-in-review. at a time when four firms controlled 56 percent of installed capacity (Brown, Olmstead, and Shaffer 2025). Alberta’s Market Surveillance Administrator – the independent monitor of Alberta’s electricity and retail natural gas markets – similarly concluded that pool prices rose because of greater exercise of market power.25Market Surveillance Administrator. 2024. “Quarterly Report for Q4 2023.” February 12. https://www.albertamsa.ca/assets/Documents/Quarterly-Report-for-Q4-2023.pdf. In summer 2023, the Government of Alberta directed the AESO and the MSA to provide advice on potential market design changes, leading the AESO to recommend the development of a REM system. Together, these findings indicate that Alberta’s deregulated market design allows suppliers to engage in economic withholding, artificially restricting available supply to elevate prices paid by ratepayers. While some degree of withholding is inherent in deregulated markets, the 2018 to 2023 period demonstrates that this can lead to significant rate spikes for consumers with inelastic electricity demand.
Other factors also contributed to Alberta’s high system costs and volatility. Extreme weather increased both demand and system stress, including record summer heat in 2021 and severe winter cold in 2022.26Owen, Brenna. 2022. “2021 heat wave over B.C., Alberta was among most extreme since 1960s: study.” Global News. May 4. https://globalnews.ca/news/8810459/bc-alberta-2021-heat-dome-research/; Ivanov, Jennifer. 2024. “Edmontonian weather the cold as 38 spots across the province break records.” Global News. January 13. https://globalnews.ca/news/10224517/edmontonians-weather-the-cold-as-38-spots-across-the-province-break-records/. Alberta also recorded a peak load of 12,193 MW on December 21, 2022.27Power Advisory LLC. 2023. “January 2023 Alberta Electricity Newsletter: 2022 Alberta Market in Review.” January 31. https://www.poweradvisoryllc.com/reports/january-2023-alberta-electricity-newsletter-2022-alberta-market-in-review.
At the same time, thermal generation capacity declined because of coal retirements. In 2018, the federal government set regulations that all coal units in Canada would have to shut down by 2030, combined with Alberta’s Off-Coal Agreements and rising carbon pricing, which accelerated the transition away from coal generation. Alongside other economic factors like high carbon pricing, ageing and maintenance-heavy assets, strategic reliability concerns, and competition from cheap and efficient natural gas plants, coal’s share of Alberta electricity generation fell from 47.4 percent in 2016 to 22 percent in 2021.28Canada Energy Regulator. 2024. “Provincial and Territorial Energy Profiles – Alberta.” August 23. https://www.cer-rec.gc.ca/en/data-analysis/energy-markets/provincial-territorial-energy-profiles/provincial-territorial-energy-profiles-alberta.html. Constraints on generation capacity required significant investments in new generation like solar and wind, shown earlier in Figure 2(b), while maintaining system reliability. Indeed, Alberta’s energy mix transition is one of the most dramatic decarbonization shifts seen across Canada and contributed materially to rising costs.
Since 2024, Alberta’s pool prices have fallen substantially as new renewable and natural gas generation capacity (as well as behind-the-meter solutions) have come online to service demand. The 2025 average pool price was $43.68/MWh, below even the lowest price in the 2018 to 2023 period at $46.75/MWh in 2020.29Alberta Electric System Operator. 2024. “AESO 2025 Annual Market Statistics.” March 8. https://www.aeso.ca/market/market-and-system-reporting/annual-market-statistic-reports/. This reversal demonstrates the volatility that can arise from a market-driven, deregulated system.
The Role of Subsidies in Calculating True System Cost
System costs do not always reflect the true cost of generating, transmitting, and delivering energy. Provinces will subsidize their energy system, shifting the costs from ratepayers to taxpayers to attract industrial development and private investment, to alleviate the cost of living for residential consumers, and to indulge political pressures to keep costs low. While a full review of provincial subsidy programs is beyond the scope of this paper, Ontario provides one of the clearest examples.
Ontario’s nearly 25 percent drop in system costs from 2018 to 2023 is largely due to a sharp decline in the Global Adjustment, driven by the province’s Comprehensive Electricity Plan (CEP), introduced in 2021. The plan shifted roughly 85 percent of renewable energy contract costs from industrial and commercial ratepayers to the provincial tax base. As a result, mid-to-large industrial and commercial consumers saw immediate bill reductions of 14 to 16 percent. The Financial Accountability Office (FAO) estimates that these subsidies will cost the province a net $15.2 billion30Financial Accountability Office of Ontario. 2021. “The Cost of Subsidizing Green Energy Contracts for Industrial and Large Commercial Ratepayers.” March 31. https://fao-on.org/en/report/2021-commercial-industrial-electricity/. (industrial and large commercial ratepayers are projected to receive $6.3 and $9.8 billion, respectively, in subsidies by 2040). Although prices for large commercial consumers remain high by Canadian standards, the subsidy has helped bring Ontario’s industrial rates down. The program’s costs and ratepayer benefits are expected to decline over time as long-term green energy contracts begin to expire around 2028. The Ontario Energy Board also found that government mitigation programs reduced Ontario’s all-in electricity costs by $6.2 billion in 2022 and $5.8 billion in 2023, roughly one-quarter of the unmitigated system cost.31Ontario Energy Board. 2024. “State of the Market Report 2023.” September 5. https://www.oeb.ca/sites/default/files/Final%20MSP39%20SotM23%20_As%20of%20Aug22.pdf.
Other provinces, notably Quebec, use regulated pricing mechanisms to keep electricity costs low, rather than direct taxpayer-funded subsidies. In 2000, Quebec created the “heritage pool,” requiring Hydro-Québec Production to supply 165 TWh per year to Hydro-Québec Distribution at a fixed price set by law, largely from older hydroelectric facilities. The initial price was 2.79 cents per kWh and has been indexed to inflation since 2014, reaching roughly 3.08 cents per kWh in 2021.32Hydro-Québec. 2022. “Overview of Hydro-Québec’s Energy Resources.” October 2022. https://www.hydroquebec.com/data/achats-electricite-quebec/pdf/overview-hydro-quebec-energy-resources-2022-2032.pdf. Because these assets have low operating costs and could often earn higher prices in export markets, selling this power domestically at a regulated, static rate functions as an implicit subsidy through foregone revenue. The heritage pool supplies roughly 90 percent of Quebec’s domestic electricity demand and helps maintain some of the lowest electricity prices in North America.33This is demonstrated by Quebec’s positioning as the lowest system cost market in Canada in 2023. The gap between market prices and the regulated heritage price can represent a meaningful reduction in household and industrial electricity bills. In effect, Quebec’s low observed system costs reflect not only low production costs, but also a legislated pricing structure that allocates the economic value of legacy hydro assets to domestic consumers.
While subsidies and regulated pricing schemes have historically helped smooth electricity investments, they risk creating a double burden by straining provincial budgets and masking the true cost of expanding supply, particularly as loads are set to increase significantly. By keeping rates artificially low, subsidies can distort price signals, deter private investment, reduce demand-side conservation incentives, enable unrealistic consumer expectations around long-term pricing, and shift costs inequitably from electricity users to taxpayers more broadly. If governments later face fiscal pressure and reduce subsidies, consumers could experience abrupt price spikes. This is not to say that subsidies are not useful in the right context; however, subsidies used as a lever to simulate the appearance of affordability may be setting up the system to be more volatile and expensive in the long run if the real costs of running the system are not widely understood.
Future System Costs Imposed by Demand Growth
System costs are expected to grow over time, yet somewhat paradoxically, this report found that system costs, in real dollars, decreased across most provinces from 2018 to 2023. There are two major factors at play here: (i) provinces have artificially depressed their system cost through subsidies (or subsidy-like programs) in large part due to political pressure to keep electricity costs low; and (ii) relatively flat energy demand growth has required limited domestic rate base investment, resulting in steady rates.
However, substantial future demand growth is expected across Canada. Electrification in heating, transportation, and industry, combined with population growth, economic expansion, AI and data centre development, and broader decarbonization efforts, will require unprecedented levels of electricity. Ontario estimates that by 2050, provincial demand will increase by 75 percent compared to current levels.34Independent Electricity System Operator. 2024. “Electricity Demand in Ontario to Grow by 75 per cent by 2050.” October 16. https://www.ieso.ca/Corporate-IESO/Media/News-Releases/2024/10/Electricity-Demand-in-Ontario-to-Grow-by-75-per-cent-by-2050. British Columbia and Quebec anticipate that demand could double over a similar period.35Government of British Columbia. 2024. “Powering Our Future: BC’s Clean Energy Strategy.” June 27. https://www2.gov.bc.ca/gov/content/industry/electricity-alternative-energy/powering-our-future; Hydro-Québec. 2024. “Electricity: Should we generate more or use less?” October 29. https://www.hydroquebec.com/residential/energy-wise/generate-more-or-use-less.html.
Meeting this demand will require major investment in generation, transmission, and distribution infrastructure. These costs could be amplified by supply-chain constraints, labour shortages, tariffs, and lengthy permitting processes. Existing grid infrastructure is also ageing and will require modernization and integration with distributed energy resources and smart grid technologies.36Government of Canada. 2024. “Powering Canada’s Future: A Clean Electricity Strategy.” October 16. https://natural-resources.canada.ca/energy-sources/powering-canada-s-future-clean-electricity-strategy. The Canada Electricity Advisory Council estimates that “the overall investment required to fully decarbonize the nation’s electricity production, while expanding to meet new demand, is estimated to be approximately $1.4 trillion, including both private capital and funding from multiple levels of government.”37Canada Electricity Advisory Council. 2024. “Powering Canada: A blueprint for success.” May 31. https://natural-resources.canada.ca/energy-sources/powering-canada-blueprint-success. This is equal to double the current pace of energy infrastructure spending.
Project execution will also play a major role in determining future affordability. Newfoundland and Labrador demonstrate that even well-established technologies can deliver poor outcomes without effective governance. The Muskrat Falls project exceeded its original budget by more than $6 billion (from roughly $7.4 billion to over $13 billion), reflecting inadequate cost estimation, optimistic assumptions, and weak oversight.38Atlantic Business Magazine. 2024. “Muskrat Falls and the Price of Failure.” October 2. https://atlanticbusinessmagazine.ca/web-exclusives/muskrat-falls-and-the-price-of-failure/; British Columbia’s Site C Dam is another large-scale project that faced major cost overruns, with an increase from an initial $8.8 billion budget in December 2014 to $16 billion by February 2021. However, because the project only reached initial operation in late 2024 and full operation in late 2025, it was not included in the provincial rate base for the 2018 to 2023 period and did not impact system costs during that period. These overruns will likely have similar upward impacts on electricity prices in British Columbia, as seen in Newfoundland. The Muskrat Falls Inquiry found the project’s business case was “not sufficiently tested,” with risks underestimated and key decisions made before fully evaluating alternatives, limiting independent scrutiny.39Commission of Inquiry Respecting the Muskrat Falls Project. 2020. “Muskrat Falls: A Misguided Project.” March 5. https://www.muskratfallsinquiry.ca/final-report/.
Although Muskrat Falls addressed legitimate system needs, it was ultimately oversized and over budget, leaving domestic ratepayers to bear the majority of the cost. The result has been a sharp increase in system costs, placing a hydro-rich province among the most expensive electricity jurisdictions in Canada. The province’s experience highlights a critical lesson: poor project execution and weak cost control can materially undermine system affordability, with large-scale investments eroding cost competitiveness when not aligned with realistic planning, forecasting, and oversight.
Overall, electricity costs in real terms are lower today than five years ago in most provinces. However, there is a risk that expectations of low costs will create pressure against utility rate increases, even as investment in electricity supply becomes increasingly necessary. Communication and planning between provincial and municipal governments, utilities, and ratepayers is crucial to ensuring that electricity is supplied at a cost that reasonably balances the requirements of the energy system today and over the long term, while meeting other goals like low-emission electricity supply. Affordability, a major concern facing Canadian households and businesses, should be weighed against the costs of demand and supply side solutions, and the subsidization of grid growth. Each province will pursue its own, unique electricity pricing strategy, and this report provides a high-level view of prices to benchmark against and market structures and mechanisms that can be leveraged to produce different outcomes.
Conclusion
This paper compares electricity costs across Canada’s electricity systems, as well as for representative profiles across residential, commercial, and industrial consumers. The analysis shows a significant variation in normalized system costs overall, from an estimated $76/MWh in Quebec to $225/MWh in Alberta for 2023.
The analysis of Alberta’s system costs and consumer rates revealed that their growth was primarily driven by increases in energy costs, while a lower Global Adjustment reduced electricity prices in Ontario.
A comparison of average unit electricity costs showed that transmission-connected industrial consumers face the lowest prices in most provinces. In contrast to 2019, when Ontario’s generous taxpayer-funded rebates subsidized residential and small commercial customers, reduced residential subsidies and greater support for industrial customers made Ontario’s pricing structure more consistent with other provinces across consumer classes.
The analysis also broke down the share of electricity costs attributable to energy, variable, fixed, and demand charges across consumer classes. This revealed how these components contribute to cost differences between provinces. For example, Ontario’s large commercial and industrial consumers face higher electricity costs than in any other province, largely because Ontario’s energy costs for these consumers exceed those elsewhere. Finally, this paper highlighted policy considerations around electricity rates, including the role of subsidies, volatility in market-based systems, and possible implications of future demand growth.
The authors extend gratitude to Colin Busby, Ben Dachis, Aleck Dadson, Éloïse Edom, Tasnim Fariha, Miranda Keating Erickson, Kate Koplovich, and several anonymous referees for valuable comments and suggestions. The authors retain responsibility for any errors, and the views expressed in this paper do not reflect those of the Canada Development Investment Corporation, its subsidiaries, the Government of Canada, or any past or current affiliations.
References
Reports, Articles, and Institutional Publications
Atlantic Business Magazine. n.d. “Muskrat Falls and the Price of Failure.”
Bishop, Grant, Mariam Ragab, and Blake Shaffer. 2020. The Price of Power: Comparative Electricity Costs across Provinces. Commentary. Toronto: C.D. Howe Institute.
Brown, David P., Andrew Eckert, and Blake Shaffer. 2023. “Evaluating the Impact of Divestitures on Competition: Evidence from Alberta’s Wholesale Electricity Market.” International Journal of Industrial Organization 89: 102953.
Brown, David P., Derek E.H. Olmstead, and Blake Shaffer. 2026. “Electricity Market Design with Increasing Renewable Generation: Lessons from Alberta.” The Electricity Journal 39(1): 107484.
Commission of Inquiry Respecting the Muskrat Falls Project. n.d. Final Report.
Dunsky Energy + Climate Advisors. 2023. “BTM Solar: Canadian Market Outlook.”
Electricity Canada. 2024. “Getting to Yes: 2024 State of the Canadian Electricity Industry.”
Electricity Distributors Association. n.d. “Facts About Ontario’s Local Hydro Utilities.”
Financial Accountability Office of Ontario. 2021. “The Cost of Subsidizing Green Energy Contracts for Industrial and Large Commercial Ratepayers.”
Government of Canada. 2024. “Clean Electricity in Prince Edward Island.”
__________. 2024. “Powering Canada’s Future: A Clean Electricity Strategy.”
Government of Ontario. 2023. “Published Plans and Annual Reports 2023–2024: Ministry of Energy.”
Hydro-Québec. 2022. “Overview of Hydro-Québec’s Energy Resources.”
International Energy Agency (IEA). 2025. “Renewable Electricity – Renewables 2025.”
International Renewable Energy Agency (IRENA). 2025. “Renewable Power Generation Costs in 2024.”
Natural Resources Canada. 2021. “2019 Survey of Household Energy Use – Summary Report.”
Ontario Energy Board. 2024. “State of the Market Report 2023.”
Power Advisory LLC. 2023. “January 2023 Alberta Electricity Newsletter – 2022 Alberta Market in Review.”
Data Sources
Alberta Electric System Operator. 2020. “COVID and Oil Prices Impact on Load.”
__________. 2024. “Annual Market Statistics Reports.”
__________. 2024. “ISO Tariff.”
__________. 2024. “Restructured Energy Market (REM).”
__________. n.d. “Energy Trading System.”
__________. n.d. “Financial Reporting.”
Alberta Market Surveillance Administrator. 2024. “Documents (Annual Reports, Compliance Review, MSOC, Quarterly Reports, Other Reports).”
__________. 2024. “Quarterly Report for Q4 2023.”
__________. n.d. “State of Market Direction.”
Alberta Utilities Commission. n.d. “Annual Distribution Filings (ENMAX Power, EPCOR Distribution, Fortis Alberta, ATCO Electric).”
__________. n.d. “Finance and Operations.”
ATCO Electric. 2024. “Price Schedule Index.”
Balancing Pool. n.d. “Financial Reports.”
BC Hydro. n.d. “Annual Reports.”
__________. n.d. “Powering Our Future.”
Canada Energy Regulator. 2016. “Alberta Cogeneration Capacity Has Grown Significantly in the Last 15 Years, Led by Oil Sands Projects.”
___________. 2020. “Market Snapshot – COVID-19 and Lower Oil Prices.”
___________. 2024. “Provincial and Territorial Energy Profiles – Alberta.”
___________. n.d. “Provincial and Territorial Energy Profiles – Canada.”
Emera Inc. n.d. “Financial Reports.”
ENMAX Power Corporation. 2024. “Distribution Tariff Rate Schedule.”
__________. 2024. “Local Access Fee Rate.”
EPCOR Transmission & Distribution, Inc. 2024. “Distribution Access Service Tariff.”
Export Development Canada. 2024. “How Service Exports Boost Canada’s Economy.”
Financial Accountability Office of Ontario. 2021. “2021 Commercial and Industrial Electricity Report.”
Fortis Alberta. 2024. “Rates and Riders Schedule.”
Government of Canada. 2025. “Prince Edward Island: Clean Electricity Snapshot.” June 4.
Hydro One. n.d. “Financial Reporting.”
Hydro-Québec. 2024. “2024 Tariffs.”
__________. 2024. “Comparison of Electricity Prices in Major North American Cities.”
__________. n.d. “Annual Reports.”
__________. n.d. “Generate More or Use Less (Energy Wise).”
Independent Electricity System Operator. 2024. “Electricity Demand in Ontario to Grow by 75 Per Cent by 2050.”
__________. n.d. “Data Directory.”
__________. n.d. “Demand.”
__________. n.d. “Financial Reporting.”
__________. n.d. “Global Adjustment by Components.”
__________. n.d. “HOEP Predispatch Pricing Reports.”
__________. n.d. “Market Renewal Program (MRP).”
Manitoba Hydro. 2024. “2024 Tariffs.”
Natural Resources Canada. 2024. Powering Canada: A Blueprint for Success: Canada Electricity Advisory Council Final Report. Ottawa: Government of Canada. May..
__________. n.d. “Comprehensive Energy Use Database – Residential Sector.”
New Brunswick Power. 2024. “2024 Tariffs.”
__________. n.d. “Annual and Quarterly Reports.”
__________. n.d. “Publications.”
Newfoundland & Labrador Hydro. 2024. “2024 Tariffs.”
__________. n.d. “Publications.”
Newfoundland Power. n.d. “Delivering Results.”
Nova Scotia Power. 2024. “2024 Tariffs.”
__________. 2024. “Fuel Adjustments.”
Ontario Energy Board. 2024. “Decision and Rate Order (Hydro One Networks Inc.).”
__________. 2024. “Decision and Rate Order (Hydro Ottawa Limited).”
__________. 2024. “Decision and Rate Order (Toronto Hydro-Electric System Limited).”
__________. n.d. “Disclosure of Information – Electricity Retailers.”
__________. n.d. “Electricity Reporting & Record Keeping Requirements.”
__________. n.d. “Historical Electricity Rates.”
Power Advisory LLC. 2023. “January 2023 Alberta Electricity Newsletter – 2022 Alberta Market in Review.”
Régie de l’énergie du Québec. 2024. “Preuve – ACER 0012.”
SaskPower. 2024. “2024 Tariffs.”
__________. n.d. “Annual Reports.”
Statistics Canada. 2025. “Electric Power Generation, Monthly Generation by Type of Electricity.” Table 25-10-0015-01.
Utilities Consumer Advocate (UCA). 2024. “Rate of Last Resort.”
UtilityNet. n.d. “Power Pool Price Analytics.”