






The Study In Brief
Over a recent four-year period, Canadians paid $50 billion per year in premiums to insurers for property and casualty insurance, which includes liability, property and auto.
The purpose of this Commentary is to seek to answer several core questions. How does Canada benchmark relative to its global peers? Do we pay less? Do we pay more? Are there material differences across Canadian provinces?
We begin our Commentary with OECD data to provide a snapshot of the competitiveness and profitability of the P&C insurance industry as a whole. We then focus the analysis on the largest lines of P&C insurance coverage – commercial liability (liability insurance for general business risks), property and auto insurance. To do so, we modified the OECD data for Canada to reflect material gaps in the reporting, primarily to reflect the substantial portion of insurance premiums paid to government insurers in BC, Saskatchewan, Manitoba and Quebec. Finally, we undertake a deeper dive into Canada data, specifically to enable objective comparisons of personal, property and auto insurance among all provinces and territories.
Our analysis indicates that Canada’s P&C sector is highly competitive and that returns on equity are, as expected in such a competitive environment, correspondingly low. Canadians tend to pay higher premium for risk transfer than citizens in many, if not most, other developed nations. This is happening despite the core products being offered by a highly competitive industry with normal claims payouts and generally lower returns on equity. So the explanations must lie elsewhere.
In general, these relatively higher premiums appear in line with claims costs. We can see that Canada’s loss ratio on average has been roughly mid-pack among benchmark peers, with around 66 percent of premiums paid out in claims.
For auto insurance, the issue of higher premiums appears to be directly correlated with ineffective government intervention – either in the form of government monopoly providers (e.g., BC and Manitoba) or self-inflicted consequences of over-regulation (Ontario).
For property insurance, the explanations are harder to identify. However, they are likely a combination of naturally risk-averse Canadian consumers, the costs of higher prudential capital requirements and the absence of government mechanisms common in many other developed nations to support consumers facing catastrophe risk (e.g., earthquakes, flooding) – leaving consumers to absorb a higher total share of risk from these types of event through higher risk-transfer premiums.
While there is much more analysis to be done in order to fully understand these results, we can identify three initial takeaways from this benchmarking exercise:
- The Canadian commercial insurance sector – largely unregulated and highly competitive – charges premiums in line with other major G7 nations;
- Auto insurance, particularly in BC, Manitoba and Ontario, would benefit from reforms that encourage competition (BC, MB) or contain costs (ON); and
- Property insurance costs are intriguingly high and the causes of this merit further study – particularly around risk-sharing between homeowners and government.
From 2015 to 2018, Canadians on average paid almost $50 billion in insurance premiums to private insurers for the three main lines of property and casualty (P&C) insurance: liability, property and auto.
That is more than 2.3 percent of the Gross Domestic Product annually. These numbers can be seen as metrics for the cost of risk transfer that Canadian consumers and businesses incur to ensure they are properly protected in adverse scenarios. But how does Canada benchmark relative to its global peers? Do we pay less? Do we pay more? Are there material differences within Canada? The purpose of this Commentary is to seek to answer these core questions. One way to do so is to compare Canadian premiums with those paid by citizens and businesses of other developed nations.
Methodologically, this global benchmarking exercise proved quite challenging. While the OECD collects insurance statistics for all member countries, including premiums and claims by type of insurance, the lack of standardization in reporting among different countries’ insurance providers makes comparability challenging. These challenges include differences in common underwriting categories – some countries report gross written premiums while others report direct written premiums – and differences in defining insurance classes, such as separating commercial insurance lines from general and personal insurance lines. For Canada, the OECD data exclude the large premiums Canadians pay to government auto insurance providers in BC, Manitoba and Saskatchewan. Even benchmarking within Canada has proven challenging, given the mix of federally and provincially chartered insurers, as well as the mixed degree of public disclosure of insurance premiums and claims for auto insurance in some jurisdictions that offer public insurance for some (e.g., Quebec) or for all (e.g., Manitoba, Saskatchewan and BC) of the auto insurance product.
It is also worth noting that there is no single government authority accountable for insurance across Canada, so we had to rely on data from multiple public and industry sources. Despite these methodological obstacles, we have created a cross-country benchmark with the available information. We believe the potential insights from such a benchmarking initiative are material, particularly because risk transfer is such an essential component of properly functioning economies.
We begin our Commentary with OECD data1For helpful comments on an earlier version of this paper, the authors thank Jeremy Kronick, Alexandre Laurin, Rosalie Wyonch, Paul Kovacs, anonymous reviewers and members of the Financial Services Research Initiative of the C.D. Howe Institute. They also thank Nikki Hui for her research assistance. They retain responsibility for any errors and the views expressed. At the time of writing, the most recent OECD data were for 2018. to provide a snapshot of the competitiveness and profitability of the P&C insurance industry as a whole. We then focus the analysis on the largest lines of P&C insurance coverage – commercial liability (liability insurance for general business risks), property and auto insurance. To do so, we modified the OECD data for Canada to reflect material gaps in the reporting, primarily to reflect the substantial portion of insurance premiums paid to government insurers in BC, Saskatchewan, Manitoba and Quebec. Finally, we undertake a deeper dive into Canada data, specifically to enable objective comparisons of personal property and auto insurance among all provinces and territories.
Any such analysis must acknowledge that there will be differences across jurisdictions regarding the competitive structure of each one’s insurance sector, legal requirements for insurance as well as the litigiousness of the legal system. However, in developed economies businesses are typically required to have general liability insurance, auto insurance is compulsory and home insurance is a must for consumers seeking to secure mortgage financing. Therefore, comparison of these sectors should be valid. Regarding industry structure, our analysis indicates that Canada’s P&C sector is highly competitive and that returns on equity are, as expected in such a competitive environment, correspondingly low. We have also been able to benchmark insurance payouts (as measured by “loss ratios”) and have been able to demonstrate that Canadian insurers pay claims in line with insurers in comparable jurisdictions (in fact, Canada appears a relatively unprofitable country relative to others in our sample).
But what about on the cost side? Insurance is a mechanism for the pooling of risks that enables individual losses to be repaid out of funds contributed by a broader grouping of similar risks. The cost of such insurance can be thought of as a necessary surcharge to mitigate against the risk of asset damage or engaging in risk-bearing economic activity. These risk pools obviously have their own risks – the losses might turn out to be worse than anticipated – and so require the backing of well-capitalized insurers. Since insurance capital is effectively a global capital pool, one would expect that, over time, returns would largely be consistent across jurisdictions. For these reasons, we have generally used GDP as the denominator in our benchmarking comparison. Given the risks discussed around small shifts in GDP data creating large swings in this type of benchmarking, we ranked results based on four-year averages. Still, it is important not to read too much into precise rankings. Rather, Canada’s ranking at or near the top should be interpreted as a general placement in the higher range among the sample of 31 OECD countries.
In Canada, both our commercial and property insurance markets are well-functioning, highly competitive and almost entirely unregulated. Here, benchmarking can help us respond to questions such as:
- How does Canada stack up vs. key trading rivals, given that the cost of litigation (with concomitant requirements for liability insurance) is a cost of doing business?
- How do Canadian property insurance costs reflect unique differences in exposure to natural disaster? Recent natural catastrophe events in Canada have highlighted gaps in coverage (e.g., flood coverage for personal property) and it appears likely that a major earthquake would expose other gaps both in product design and in adequacy of coverage.2In its financial system stability assessment, the IMF highlighted the lack of capital buffers for mortgage insurance due to the exclusion of important risks, such as earthquakes (IMF 2019). Le Pan (2016) discusses the need to address this coverage gap and recommends, among other things, a federal government/industry backstop that would deal with uninsured catastrophic risk and protect against a systemic financial failure. And unlike many other major jurisdictions with substantial exposure to natural catastrophe, there are no federal or provincial government backstop mechanisms in place.
- What impact, if any, does Canada’s relatively higher levels of capital have on pricing for consumers and businesses? Canada has a very proud history of successful prudential oversight earned over many years, but this unblemished solvency track record comes at a cost in higher capital requirements.
- The Canadian auto insurance market, by contrast, is highly regulated, even in provinces where it is private-sector run and where it is not compulsory to purchase car insurance from a monopoly government-owned insurer. Such levels of government engagement are quite unusual internationally. Therefore, benchmarking in this area can help us better understand the answers to questions such as:
- Does the lack of private-sector competition mean certain Canadians are paying more for their auto insurance than others?
- Does the relatively high level of government engagement in the sector yield better or worse financial results for Canadian auto insurance consumers relative to global peers?
Our findings indicate that:
- Once government insurers’ data are included in the analysis, the share of GDP Canadians pay on liability, property and auto insurance premiums increases to more than 2.7 percent – slightly more than in any other OECD country. That said, Canada is in good company, as the other nations that spend comparable amounts are largely also G7 members (e.g., US, UK, Germany) or are among other more economically developed nations (e.g., Denmark, Switzerland).
- These relatively higher premiums appear in line with claims costs. We can see that Canada’s loss ratio on average has been roughly mid-pack among benchmark peers, with around 66 percent of premiums paid out in claims.
- These higher premiums are not necessarily rewarding for Canada’s insurance industry – OECD data show return on equity (ROE) on average to be mid-pack at best over the four-year period. Meanwhile, Insurance Bureau of Canada (IBC) ROE data show that actual returns to the P&C sector compared to the overall insurance industry are in fact among the lowest in our sample.
- Looking specifically at commercial liability, we see that while Canadian businesses pay more for their corporate insurance than those in many jurisdictions, our primary trading partners (e.g., the US) pay similar if not higher amounts.
- The variance within Canadian provinces and territories is also of interest as three provinces consistently show higher-than-average premiums for auto insurance – with one of those a private-sector-run market (Ontario) and the other two government-monopoly markets (BC and Manitoba).
- For personal property insurance, Albertans pay the greatest amount per home – significantly above the Canadian average – presumably at least in part a reflection of the costs associated with their severe and troubling natural catastrophe history in recent years (floods, wildfires, hail, etc.).
- While there is much more analysis to be done in order to fully understand these results, we can identify three initial takeaways from this benchmarking exercise:
- The Canadian commercial insurance sector – largely unregulated and highly competitive – charges premiums in line with other major G7 nations;
- Auto insurance, particularly in BC, Manitoba and Ontario, would benefit from reforms that encourage competition (BC, MB) or contain costs (ON); and
- Property insurance costs are intriguingly high and the causes of this merit further study – particularly around risk-sharing between homeowners and government.
International Benchmarking – Premiums, Claims, Expenses and ROE
Due to severe data limitations, any attempt at benchmarking Canada internationally or benchmarking provinces within Canada will suffer from serious shortcomings that are unavoidable unless the insurance industry, as a whole, improves its data collection and sharing.
With the data we have available, however, we can compare some aspects of the Canadian insurance industry to other OECD countries. While these comparisons are only available in terms of non-life insurance as a whole (versus looking at non-life insurance by class: auto, property and liability), these comparisons still offer insights into the overall P&C insurance industry that in turn can be helpful in the rest of our analysis.
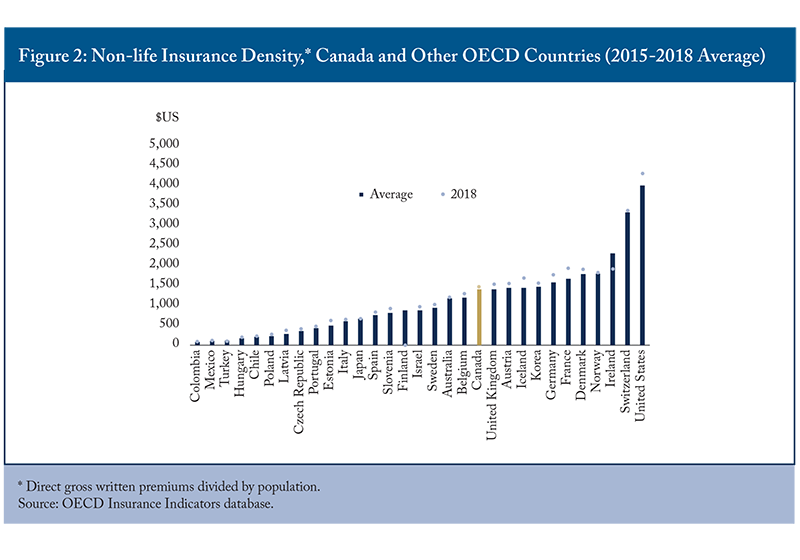
We start by looking at the penetration and density of non-life insurance across OECD countries and for which data are available. The OECD defines such penetration as direct gross written premiums3Direct gross written premiums are the total premiums written by the insurer, not including reinsurance assumed. divided by GDP and considers it a measure of the insurance industry’s importance to the overall economy. The OECD defines density as direct gross written premiums divided by population and considers it a measure of average insurance spending per capita. To guard against potential volatility in reported results in any one year, we have used a four-year, 2015-to-2018, average in the analysis below.
The two figures below show the 2015-2018 average of the OECD penetration and density measures for the “non-life”4“Non-life” insurance means property and casualty insurance – and excludes life insurance and annuity premiums – but includes accident and health. insurance industry in 31 of the 37 OECD countries.
Based on this data, the P&C insurance industry seems of average importance to the Canadian economy. Spending per capita seems also relatively average. Note, however, that this average insurance spending number does not include Canada’s public insurers’ underwriting activities, as the OECD does not collect that data, perhaps due to the difficulty of data collection from the different government providers. Later in this section, we will look at how Canada stacks up internationally once this material component of total premium is added.


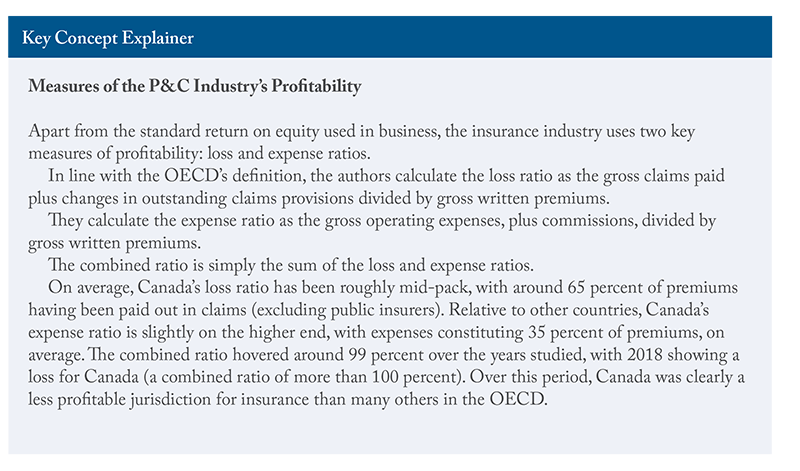
We now move to an examination of the loss and expense ratios in the non-life insurance industry. These measures give us insights into the insurance industry’s profitability. In line with the OECD’s definition, we calculate the loss ratio as the gross claims paid plus changes in outstanding claims provisions divided by gross written premiums. We calculate the expense ratio as the gross operating expenses, plus commissions, divided by gross written premiums. Note that the OECD separates the numerators in these calculations (gross claims paid, gross operating expenses, outstanding claims provisions, commissions) into life, non-life and composite, which includes life and non-life. In most cases, the composite breakdown is available. Unfortunately for Canada, however, this breakdown is not available for operating expenses or outstanding claims provisions. This matters when, for example, the composite gross operating expenses were, from 2015 to 2018, more than triple the pure non-life expenses.
Therefore, in the figures below, we attempt to estimate the share of non-life from Canada’s total composite expenses and outstanding claims provisions. In doing so, we follow the OECD methodology, where it assumes the breakdown to be the same as the one for gross written premiums.
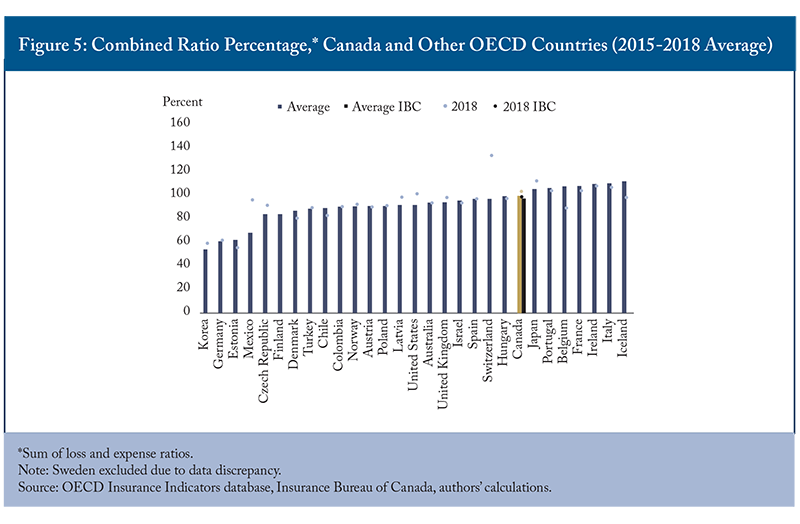
Figure 5 shows the combined ratio, which is simply the sum of the loss and expense ratios. As a check against our assumptions, we include in Figure 5 the combined ratio as reported by the Insurance Bureau of Canada (IBC) (which also excludes public insurers).
We can see that, on average, Canada’s loss ratio has been roughly mid-pack, with around 65 percent of premiums having been paid out in claims (again, excluding public insurers). Relative to other countries, Canada’s expense ratio is slightly on the higher end, with expenses constituting 35 percent of premiums, on average. The combined ratio hovered around 99 percent over the period, with 2018 showing a loss for Canada (a combined ratio of more than 100 percent). Over this period, Canada was clearly a less profitable jurisdiction for insurance than many others in the OECD.
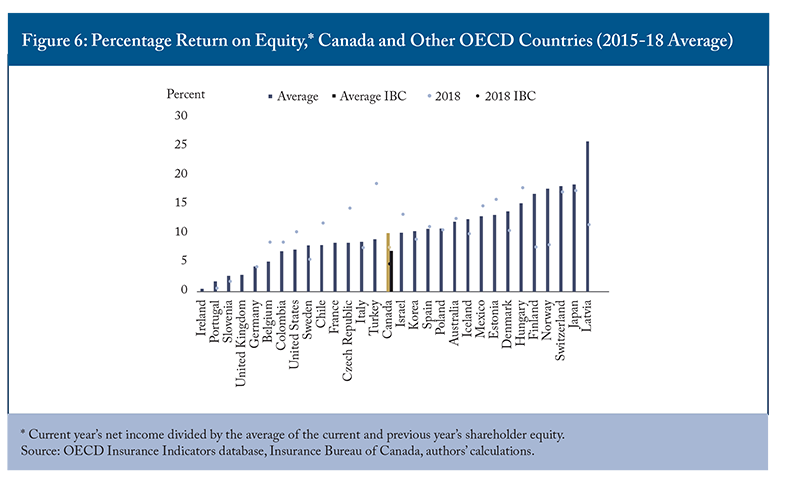
Another measure of profitability and insurers’ income-generating capacity is return on equity (ROE), which the OECD calculates as the current year’s net income divided by the average of the current and previous year’s shareholder equity. As in Figure 5, we show the ROE reported by the IBC (excluding public insurers) as a check on our OECD calculations.5Similar to the other variables described above, net income and shareholder equity are also divided into life, non-life and composite insurance. However, for these two variables, the breakdown of composite undertakings into its life and non-life components is not available for any of the countries included in the sample and, therefore, Figure 6 below does not include them.
Using OECD methodology, Canada’s insurance-ROE has on average been mid-pack, at best, over the period. However, the IBC ROE data shows that actual returns to the P&C sector are in fact among the lowest in the sample.
Such relatively high combined ratios and such relatively low ROEs are predictable given the high degree of competition in the Canadian P&C sector. Later in this Commentary, we will see certain lines of business where Canadian premiums benchmark higher than those in some, or many, jurisdictions. With the extraordinary exception of automobile insurance where in three provinces – almost unique in the world – automobile insurance is offered via a government monopoly, the P&C sector is highly competitive. Hence, lack of competition in Canada is unlikely to be the driver for higher premiums. We undertook a separate exercise to illustrate this key point that can be found in Box 1.

The relatively higher overall average premiums noted above, which are clearly not the result of lower claims payouts or higher insurer profits, must have other domestic explanations, such as greater risk awareness and/or higher risk insure. We can gain more insight into this question through a deeper dive into the three most important classes of P&C insurance - auto, property and liability insurance, using the limited data available – and benchmarking gross direct written premiums as a share of GDP.
International Benchmarking – Auto, Property and Liability
Methodology
Many factors impact the total insurance premiums paid, including the numbers of policies sold, cars, homes, as well as accidents, weather-related events and consumer behaviour. Any benchmarking analysis must acknowledge that there will be differences across jurisdictions regarding the competitive structure of each one’s insurance sector, legal requirements for insurance as well as the litigiousness of the legal system. However, as a general rule, general liability insurance in developed economies is an absolute requirement for business to function, auto insurance is compulsory and home insurance is a must for consumers seeking to secure mortgage financing. Therefore, comparison of these sectors should be valid. Where possible, however, we have checked our GDP-based rankings against other appropriate measures, such as the number of cars and homes.
We also acknowledge upfront the obvious drawbacks of using GDP as our denominator in a cross-country comparison of insurance premiums. A range of other benchmarking comparators would be ideal. However, such information is not widely available due to the non-standardized nature of insurance data across the different countries and reporting systems. This is precisely the motivation for our work – a first step toward enabling an objective comparison in this complex field. Given the data limitations, all of the comparisons presented in this Commentary, particularly international ones with GDP as the denominator, suffer from significant margins of error. It is important that readers consider these rankings with an understanding that they are sensitive to many different factors, including data revisions and updates. Therefore, a rank difference of, say, one or two, is not as relevant as a country’s overall relative position.
While use of other denominators might result in different rankings, we believe that GDP is an acceptable measure to use for benchmarking purposes as it generally captures the wealth of a nation as well as provides a metric for evaluating the scope of risk-bearing activity. To address concerns about data volatility, we have used a four-year data average throughout.
We begin by benchmarking Canada’s overall national result for the sum of auto, property and liability insurance against OECD peers for which data are available. But in order to benchmark Canada, we must deal with a major gap in Canada’s own contribution to the OECD database by including the premiums for compulsory and optional automobile insurance paid to public insurers in BC, Saskatchewan and Manitoba. We also need to add in the portion of premiums paid by drivers in Quebec, via their driver’s licence fees, for accident benefits and bodily injury coverage provided by the SAAQ (Quebec Automobile Insurance Corporation). The process for doing this is not without its own special challenges and our assumptions are outlined in Box 2.


Benchmarking – Total Premiums for Auto, Property and Liability
To establish our benchmarking analysis, we used the “OECD Insurance Indicators” database, which includes underwriting statistics for OECD countries by insurance class. Specifically, we look at the gross direct written premiums for the three classes of insurance from 2015 to 2018 (or last available year) as a percentage of GDP - as illustrated in Figure 7. We then added premiums from Canada’s three large public insurers (as discussed in Box 2). Using GDP as a benchmarking metric, we find that Canada is the highest premium paying country, albeit very close to the US. Canada’s auto, property and liability gross written premiums from 2015 to 2018 amounted to 2.7 percent of its GDP on average, compared to an OECD average of 1.6 percent and a G7 average of 2 percent. These results indicate that Canadian ratios are generally in line with our North American neighbour but higher than other G7 peers.
Commercial Liability
Next, we look specifically at commercial liability (the only component of corporate insurance risk-transfer costs that can be broken explicitly out of the data). Commercial liability covers risks such as product liability, errors and omission, director’s and officer’s liability, and cyber liability. This liability-specific data shows a different picture from the overall result, with a handful of nations paying more than Canada as a percentage of GDP – those nations are largely G7 peers. Canada’s average gross written premiums as a percentage of GDP stood at 0.31 percent, compared to an OECD average of 0.19 percent, and a G7 average of 0.33 percent.

Normally, one would expect nations with a well-established rule of law, clear access to courts for aggrieved counterparties, as well as strong consumer protection legislation, to drive the need for larger limits on liability coverage. As expected, the US business community, with its particularly litigious environment, paid a high price for commercial liability coverage from 2015 to 2018 – 0.3 percentage points higher than Canada’s average over this period. It is perhaps somewhat surprising to see the UK ranking even higher by this metric, but it appears likely that reported UK premiums include workers’ compensation premiums, which are recorded separately in the US, and offered via government mechanisms in many other jurisdictions – including Canada.
Property Insurance
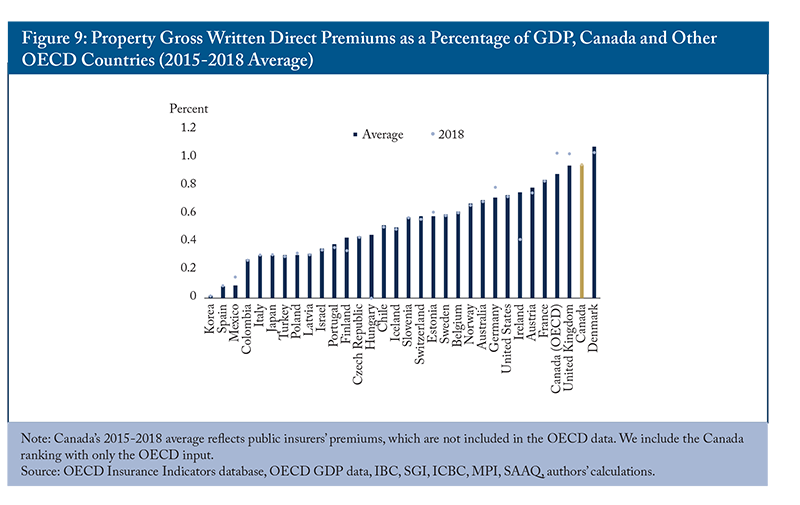
When we turn to benchmarking for property insurance (which here includes both commercial and personal property), we see that Canada is again in the top ranks, paying 0.95 percent of GDP in premiums, more than twice the OECD average (Figure 9).
Interestingly, we see the addition of Denmark at the top and a drop for the US. The US’s result is particularly curious considering the significantly higher value of homes owned by wealthy Americans and the country’s experience with frequent hurricanes. This relatively lower result could be due to many factors, most prominent being the possibility that the number of uninsured properties, particularly in terms of water damage, is quite high. Indeed, a report by Swiss Re (2015) ranks the US as having the world’s largest property-protection gap against natural catastrophes.
Another possible reason for unexpected outcomes using this metric could be the structural differences among different countries’ insurance markets. For example, in many developed countries (notably France, Germany and the US) more risk is transferred to governments via state-run pools or catastrophe backstop mechanisms for disasters including flooding and earthquakes. In Canada, the current absence (in the case of earthquake risk, an inexplicable absence) of such backstop mechanisms could explain why it appears that property owners end up paying more for their insurance than those in other nations.
A recent study regarding uptake of earthquake insurance by BC residents compared to similarly earthquake-exposed neighbours in Washington state suggests another possible explanation – innate Canadian conservatism and prudence (Kelly 2020). It is entirely possible that Canadians’ natural-risk aversion is reflected in a higher insurance-buying propensity with an inclination toward lower self-insured amounts – both of which would contribute to relatively higher average premiums.
Finally, we know that capital standards established by the Office of the Superintendent of Financial Institutions and applicable to all insurers operating in Canada require a particularly high level of capital and reinsurance for insurers choosing to write property risks in disaster-prone areas relative to other developed jurisdictions. It is possible that Canada’s ranking by this metric is driven, at least in part, by this added price for prudence paid to cover the cost of the extra capital allotted to protect the system from insurer failure.
Automotive Insurance
The benchmarking data for auto insurance (which here includes both commercial and private passenger insurance) tells another interesting story. Canadians appear to have paid, on average, the highest premiums in the world relative to GDP (with Estonians intriguingly paying similar amounts, according to OECD data).
It is important to note that there are many more countries within a close margin of the overall average of the automotive premiums to GDP ratio, and a much smaller gap between the top and bottom quartiles, than is the case in our property analysis above. The top quartile paid, on average, 1.2 percent of GDP on automobile coverage over the 2015-2018 period, just less than three times as much as the bottom quartile. In comparison, the top quartile paid four times as much as the bottom quartile for property coverage and 10 times as much as the bottom quartile on liability coverage. This lower automotive gap perhaps indicates a commonality in types of exposure represented by automobile insurance losses as well as a consistency in the cost of remediation (including replacement parts and repair costs) after such losses. Given the risks discussed earlier around small shifts in GDP data creating large swings in this type of benchmarking, it is important not to read too much into this finding. Rather, Canada’s ranking at the top should be interpreted as a general placement in the higher range among the sample of 31 OECD countries.

As we shall see in the next section, there are substantial variations among and between provinces within Canada with certain provinces paying premiums as a percentage of GDP far higher than the average. It is possible that these outliers are the primary driver of the relatively higher Canada ranking in the overall international benchmarking.
Inter-Provincial Benchmarking – Personal Property and Automobile
Canada has both diverse geography and disparate relative economic wealth so it is not unreasonable to assume that there will be at least some disparity in provincial insurance costs as a percentage of GDP. It is also probably true that the cost to replace a car or repair someone injured in a car is relatively constant across Canada. And the basic cost of re-construction for damaged property is also likely relatively consistent. So, it is likely that relatively less well-off provinces might pay more – as a percentage of GDP. However, since insurance purchased is a proxy metric for total owned assets, it is also fair to assume that richer provinces/regions will have higher investment in risk transfer simply because they have more assets to protect. As a result, we believe the GDP gauge is a legitimate one and material variances could still be noteworthy.

Personal Property
We begin by looking at personal property direct gross written premiums as a percentage of GDP by province, using IBC data (Figure 11).6In addition to the premiums written by private insurers reported by the IBC, we add the portion written by the public insurer SGI in Saskatchewan, as well as SGI Canada in Alberta, BC, Manitoba and Ontario. Two Atlantic provinces – Nova Scotia and New Brunswick – top the charts. Presumably, this could be explained, at least in part, by their lower relative wealth. But other more significant factors might include the higher exposure both provinces represent with regard to a large range of natural catastrophes, including wind, flood and wildfire. BC, with its high earthquake and wildfire exposure, as well as Quebec with its high flood risk, also show results above the national average.
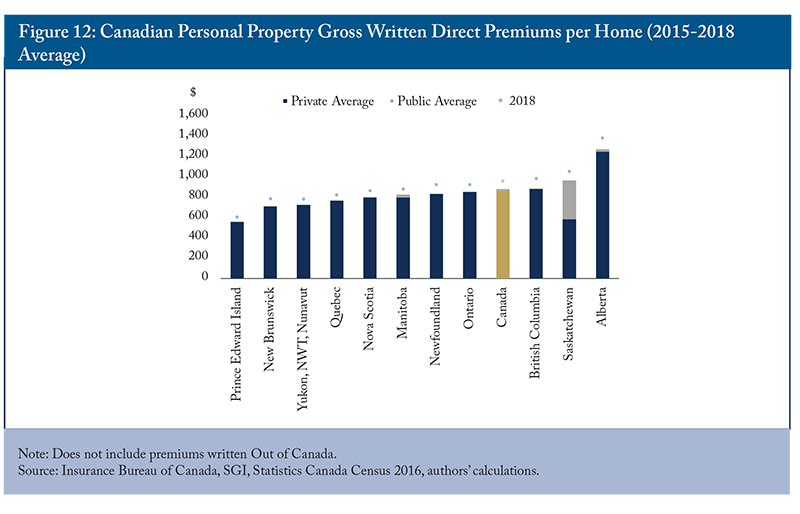
We also benchmarked premiums paid per home (Figure 12) and found that they resulted in more meaningful and representative rankings than those in Figure 11. Alberta, with its relatively higher GDP per capita, ranks lower when using the premiums-as-a-percentage-of-GDP metric. But on a per-home basis, Alberta tops the cost charts. Given the devastating wave of natural catastrophes experienced by that province over the last decade and the severe underwriting losses incurred by the Canadian insurance industry, this result is probably not surprising. Two other relatively wealthier provinces also move up the rankings when using a per-home metric, as does Saskatchewan.


Lastly, we estimated the loss ratio of personal property by province. Using the limited data available to us, the loss ratio presented below is simply the ratio of claims to premiums. Again, Alberta’s very challenging underwriting environment is illustrated clearly by this analysis, with an unsustainably high percentage of total premiums being paid out in claims. BC’s low loss ratio can also likely be attributed to the relatively high take-up of earthquake coverage – premiums are being paid, but in recent years there has not been an earthquake to drive claims costs upwards.
Personal Auto
We remind readers to see Box 2 for the assumptions we have made in order to best address the methodological challenges arising due to the public-private nature of auto insurance in some Canadian provinces.
As we have already seen, Canadians on average pay higher costs for auto insurance than drivers in other countries as a percentage of GDP. But province-by-province comparisons of personal auto insurance show that there are substantial differences, with the amount drivers pay in three provinces (BC, Manitoba and Ontario) pulling up the Canadian average. Indeed, it is likely that these three outlier provinces (with their meaningful share of total premiums paid for auto insurance) are the primary reason for Canada’s high international ranking (see Figure 14).
It is interesting to note that two of these jurisdictions – BC and Manitoba – operate government-run monopolies, while one is the highly regulated but private-sector-run Ontario market. Therefore, the particular business model is not the only cause of Canadians paying higher auto insurance costs on average. More broadly, it would be more accurate to say that ineffective government intervention is the likely cause. However, it is worth noting that the financial performance of the two aforementioned government-run provincial insurers in recent years has been distinctly different. Manitoba’s has been consistently profitable, while BC’s has had severe underwriting losses and is in grave financial condition.
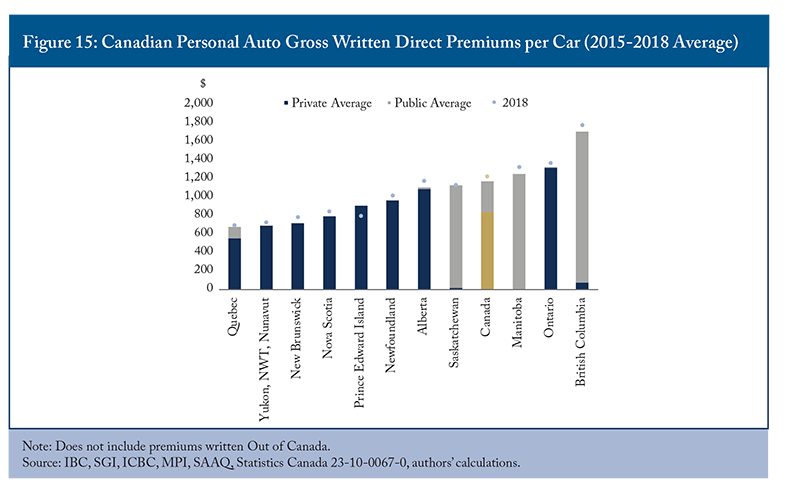
We also benchmarked provincial personal auto costs “per car” (see Figure 15) and, with the possible exception of an upward movement in relatively wealthy Alberta’s ranking, there is little appreciable shift in rankings. The underwriting results in Ontario have long been flagged as being unsustainably poor and the regulated product in dire need of reform.7See the IBC’s submission to the Government of Ontario’s 2019 pre-budget consultations. Available at: http://assets.ibc.ca/Documents/Resources/Pre-budget-2019-submission.pdf. Ontario’s auto insurance sector is one of the most heavily regulated in the country, but seems to provide less benefits for its drivers – with higher average premiums and a combination of increasing rates and regulatory barriers putting a damper on competition and innovation, leaving drivers facing fewer choices (IBC 2019). Indeed, in its 2019 budget, the Ontario government announced a “Putting Drivers First” program with an aim to make auto insurance more affordable (Ontario 2019).

Auto insurance has always been a politically charged topic in Canada, and our government-run insurers remain outliers in the developed world. But this benchmarking analysis would indicate that, whether it is a government monopoly (as in BC) or simply an over-regulated private sector market (such as Ontario), the higher average premiums paid by citizens of those provinces and, therefore by Canadians on the whole (on average), are, at least in part, driven by ineffective government intervention.
Finally, as we did with personal property, we also estimated the personal auto-loss ratio by province - measured by personal auto claims divided by premiums (See Figure 16). In estimating the claims of public insurers, we used the same assumptions as we did in estimating their premiums (excluding Manitoba – as we could not secure personal auto claim data from MPI).
It would be fair to say that these extremely high average-loss ratios indicate that one important reason for Canadians’ higher average auto insurance premiums is their very high levels of claims. With claims costs exceeding total premium collected in four provinces, informed observers would anticipate continued upwards trends on premiums charged – especially given the low returns to insurers in this line (and overall) in Canada. Knowing the high levels of competition in the private-sector provinces and the low ROEs sustained by the industry, public policy remedies will clearly need to focus on product design and levels of coverage rather than counter-productive rate regulation.
Conclusion
We believe the insights gained through this benchmarking exercise have been more than worth the effort to navigate the laborious data challenges described throughout. As can be seen from the high-level results, Canadians tend to pay higher premium for risk transfer than citizens in many, if not most, other developed nations. This is happening despite the core products being offered by a highly competitive industry with normal claims payouts and generally lower ROEs. So the explanations must lie elsewhere.
For auto insurance, the issue appears to be directly correlated with ineffective government intervention – either in the form of government monopoly providers (e.g., BC and Manitoba) or self-inflicted consequences of over-regulation (Ontario). For property insurance, the explanations are harder to identify. However, they are likely a combination of naturally risk-averse Canadian consumers, the costs of higher prudential capital requirements and the absence of government mechanisms common in many other developed nations to support consumers facing catastrophe risk (e.g., earthquakes, flooding) – leaving consumers to absorb a higher total share of risk from these types of event through higher risk-transfer premiums.
Hopefully, this exercise will prompt, as a starting point, better data collection and reporting, and further research and dialogue, so that we can all better understand this essential – but often under-appreciated – segment of the Canadian economy.
References
Holzheu, T., Roman Lechner, and Ginger Turner. 2015. “sigma 05/2015: Underinsurance of property risks: closing the gap.” Swiss Re Institute. September.
Insurance Information Institute. 2016. “How Many Homes Are Insured? How Many Are Uninsured?” The Triple-I Blog. January.
IMF (International Monetary Fund). 2019. Canada Financial System Stability Assessment. IMF Country Report 19/177. Washington, DC. June.
IBC (Insurance Bureau of Canada). 2019. “2019 IBC Pre-Budget Submission.”
______________. 2020. “2020 Facts of the Property and Casualty Insurance Industry in Canada.”
Kelly, Mary, Steven Bowen, and Glenn McGillivray. 2020. “The Earthquake Insurance Protection Gap.” Journal of Insurance Regulation 39 (11).
Le Pan, N. 2016. Fault Lines: Earthquakes, Insurance, and Systemic Financial Risk. Commentary 454. Toronto: C.D. Howe Institute. August.
Ontario. 2019. “2019 Ontario Budget: Protecting What Matters Most.”